

Key Insights
The South African beverage market is projected to reach $19.8 billion by 2025, with an anticipated Compound Annual Growth Rate (CAGR) of 13.3% from 2025 to 2033. Key growth drivers include rising disposable incomes, a growing urban youth demographic, and robust tourism impacting the on-trade sector. Increased health consciousness is also propelling the non-alcoholic segment, with demand for functional and natural beverages on the rise. Challenges include economic instability, fluctuating exchange rates, high raw material costs, and stringent alcohol regulations. The market encompasses both on-trade and off-trade channels, with major players like Coca-Cola, PepsiCo, and Red Bull, alongside a growing presence of local and craft brands. Innovation, brand extensions, and strategic partnerships characterize the competitive landscape. Future market performance will depend on the economic climate and evolving consumer preferences.
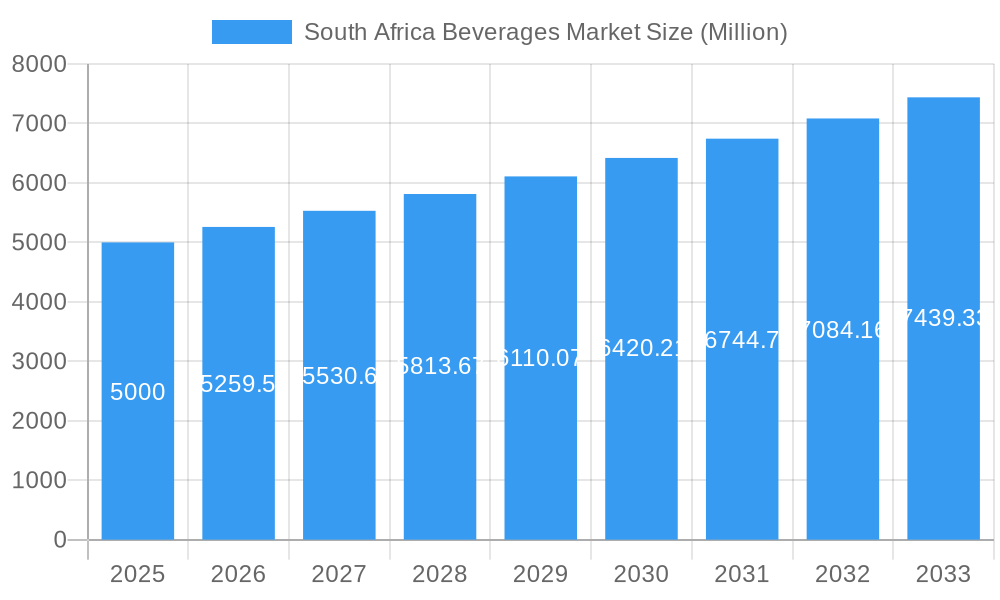
South Africa Beverages Market Market Size (In Billion)
South Africa's beverage market offers substantial opportunities for both multinational corporations and local enterprises. A diverse consumer base, spanning price-sensitive to premium segments, allows for tailored product development. The expanding middle class represents a significant opportunity for higher-margin beverages, while the emphasis on health and wellness drives demand for functional and low-sugar options. Addressing geographical diversity with region-specific marketing and distribution strategies is crucial. Sustainable practices and responsible consumption are paramount for long-term success in this dynamic sector. Understanding consumer behavior and implementing targeted strategies will be vital for market players to leverage growth.
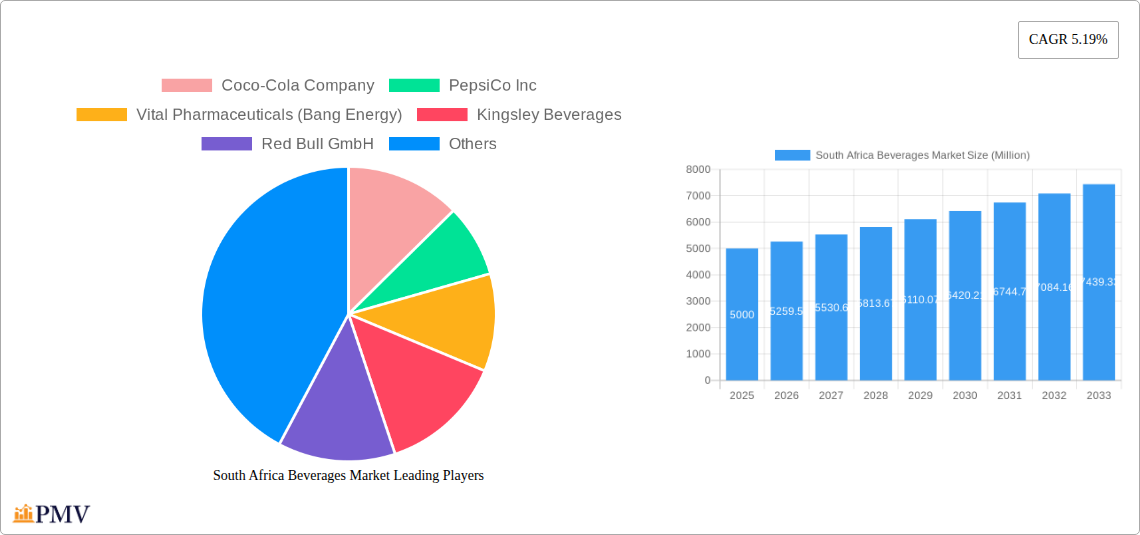
South Africa Beverages Market Company Market Share
South Africa Beverages Market: A Comprehensive Report (2019-2033)
This in-depth report provides a comprehensive analysis of the South Africa beverages market, covering the period 2019-2033. With a base year of 2025 and a forecast period of 2025-2033, this report offers crucial insights into market dynamics, trends, and future growth potential. This analysis includes detailed segmentation by product type (alcoholic and non-alcoholic beverages, including spirits), distribution channel (on-trade and off-trade), and key players. The report utilizes extensive data to provide actionable insights for businesses operating in or planning to enter this dynamic market. The South African beverage market, valued at xx Million in 2024, is projected to reach xx Million by 2033, exhibiting a CAGR of xx% during the forecast period.
South Africa Beverages Market Market Structure & Competitive Dynamics
The South African beverages market exhibits a moderately concentrated structure, with a few multinational giants like Coca-Cola Company, PepsiCo Inc, and Diageo PLC holding significant market share. However, local players like Kingsley Beverages and Twizza Soft Drinks (Pty) Ltd also contribute substantially. The market displays a vibrant innovation ecosystem, particularly in the non-alcoholic segment, with continuous product launches and reformulations driven by evolving consumer preferences. The regulatory framework, while generally supportive of the industry, undergoes periodic changes impacting labeling, taxation, and marketing regulations. Product substitution is a significant factor, with consumers increasingly opting for healthier alternatives like flavored waters and functional beverages.
Mergers and acquisitions (M&A) activities have been moderate in recent years, with smaller players often being acquired by larger entities to enhance market reach and product portfolios. While precise M&A deal values are not publicly available for all transactions, it's estimated that deals in the past five years have totaled approximately xx Million. The market witnesses shifts in end-user trends, with health-conscious consumers driving demand for low-sugar, organic, and functional beverages. These trends influence the strategic direction of companies, leading to innovation in product development and marketing strategies.
South Africa Beverages Market Industry Trends & Insights
The South African beverages market is driven by several key factors, including rising disposable incomes, a growing population, and urbanization. These factors contribute to increased consumer spending on beverages, fueling market growth. Technological disruptions, such as e-commerce platforms and advanced packaging technologies, are reshaping distribution channels and improving supply chain efficiency. Consumer preferences are evolving toward healthier options, leading to increased demand for low-sugar, organic, and functional drinks. The intense competitive landscape necessitates continuous innovation, with companies investing heavily in research and development to stay ahead of the curve. The market penetration of certain product categories, such as energy drinks, is expected to increase significantly due to rising consumer preference for products associated with improved energy levels and productivity.
The market has witnessed a surge in demand for convenient packaging options and on-the-go consumption, leading to increased sales of single-serving cans and bottles. The impact of these trends on market growth can be gauged through the CAGR of xx% for the forecast period. This steady rise reflects the continued success of established players, the emergence of innovative brands, and the growing adoption of new beverage categories.
Dominant Markets & Segments in South Africa Beverages Market
Leading Region/Segment: The Gauteng province dominates the South Africa beverages market owing to its high population density and strong economic activity. Within product types, non-alcoholic beverages hold the largest market share, driven by high consumption of carbonated soft drinks, juices, and bottled water. The off-trade channel, encompassing retail stores, supermarkets, and online platforms, is the dominant distribution channel, reflecting the growing preference for convenient home consumption.
Key Drivers:
- Economic Policies: Government policies regarding taxation and trade liberalization influence pricing and market access.
- Infrastructure: Efficient transportation and logistics networks are vital for distribution, especially in a geographically vast country like South Africa.
- Consumer Preferences: Shifting consumer preferences toward healthier alternatives impact product innovation and market demand.
- Tourism: Tourism significantly contributes to on-trade sales, especially in major cities and coastal regions.
The dominance of Gauteng is attributed to its robust economy, high purchasing power, and large population base. The non-alcoholic segment’s leadership stems from the widespread affordability and accessibility of these beverages. The off-trade channel's dominance highlights the evolving consumer behavior favoring convenience and home consumption.
South Africa Beverages Market Product Innovations
Recent years have seen significant innovation in the South African beverage market, particularly in the areas of functional beverages, organic options, and improved packaging. Companies are increasingly focusing on healthier and more natural ingredients, responding to growing consumer demand for wellness-oriented products. The use of sustainable packaging materials and innovative dispensing systems is also gaining traction, reflecting broader consumer and industry concerns about environmental sustainability. This reflects a broader trend of aligning product development with evolving consumer values and preferences.
Report Segmentation & Scope
Product Type: The market is segmented into alcoholic and non-alcoholic beverages. Non-alcoholic beverages, including carbonated soft drinks, juices, bottled water, and energy drinks, hold a significant market share, projected to grow at a CAGR of xx% during the forecast period. Alcoholic beverages, including beer, wine, and spirits, represent a smaller but still substantial segment, with growth expected to be moderate.
Distribution Channel: The market is divided into on-trade and off-trade channels. The off-trade channel, including supermarkets, retail stores, and e-commerce, dominates the market. Growth in this segment is fueled by increasing convenience and accessibility. The on-trade segment, encompassing restaurants, bars, and hotels, faces fluctuating growth rates impacted by economic conditions and tourism trends.
Key Drivers of South Africa Beverages Market Growth
Several factors contribute to the growth of the South African beverages market. The rising disposable incomes of consumers create greater purchasing power for premium and diverse beverage options. Population growth, particularly in urban areas, fuels market expansion. The adoption of e-commerce and digital marketing facilitates convenient access to a wider range of beverages. Furthermore, positive economic growth supports consumer spending and increases investment in the beverage industry.
Challenges in the South Africa Beverages Market Sector
The South African beverages market faces challenges, including economic volatility and fluctuations in consumer spending. Supply chain disruptions, particularly in accessing raw materials and packaging, can impact production costs and availability. Furthermore, intense competition necessitates continuous product innovation and effective marketing strategies to retain market share. Stringent health and safety regulations necessitate high compliance costs for beverage manufacturers.
Leading Players in the South Africa Beverages Market Market
- Coca-Cola Company
- PepsiCo Inc
- Vital Pharmaceuticals (Bang Energy)
- Kingsley Beverages
- Red Bull GmbH
- Anheuser-Busch InBev NV
- The Beverage Company
- Carlsberg Group
- Ekhamanzi Springs (Pty) Ltd
- Twizza Soft Drinks (Pty) Ltd
- Diageo PLC
Key Developments in South Africa Beverages Market Sector
- June 2022: Bang Energy expands its presence in South Africa through a partnership with SG Gateway Services.
- July 2022: Red Bull launches a new Summer Edition Apricot energy drink.
- September 2022: Coca-Cola introduces its new Cappy juice brand.
Strategic South Africa Beverages Market Market Outlook
The South African beverages market presents significant growth opportunities for businesses that can adapt to evolving consumer preferences and technological advancements. Focusing on healthier options, sustainable packaging, and innovative marketing strategies will be crucial for success. Expansion into underserved markets and leveraging e-commerce platforms will also contribute to future growth. The market's diverse consumer base and dynamic economic landscape offer significant potential for businesses willing to invest in innovation and market adaptation.
South Africa Beverages Market Segmentation
-
1. Product Type
-
1.1. Alcoholic Beverages
- 1.1.1. Beer
- 1.1.2. Wine
- 1.1.3. Spirits
-
1.2. Non-Alcoholic Beverages
- 1.2.1. Energy & Sport Drinks
- 1.2.2. Carbonated Soft Drinks
- 1.2.3. Tea & Coffee
- 1.2.4. Other Non-alcoholic Beverages
-
1.1. Alcoholic Beverages
-
2. Distribution Channel
- 2.1. On-Trade
-
2.2. Off-Trade
- 2.2.1. Supermarkets/Hypermarkets
- 2.2.2. Convenience Stores
- 2.2.3. Online Retail Stores
- 2.2.4. Other Distribution Channels
South Africa Beverages Market Segmentation By Geography
- 1. South Africa
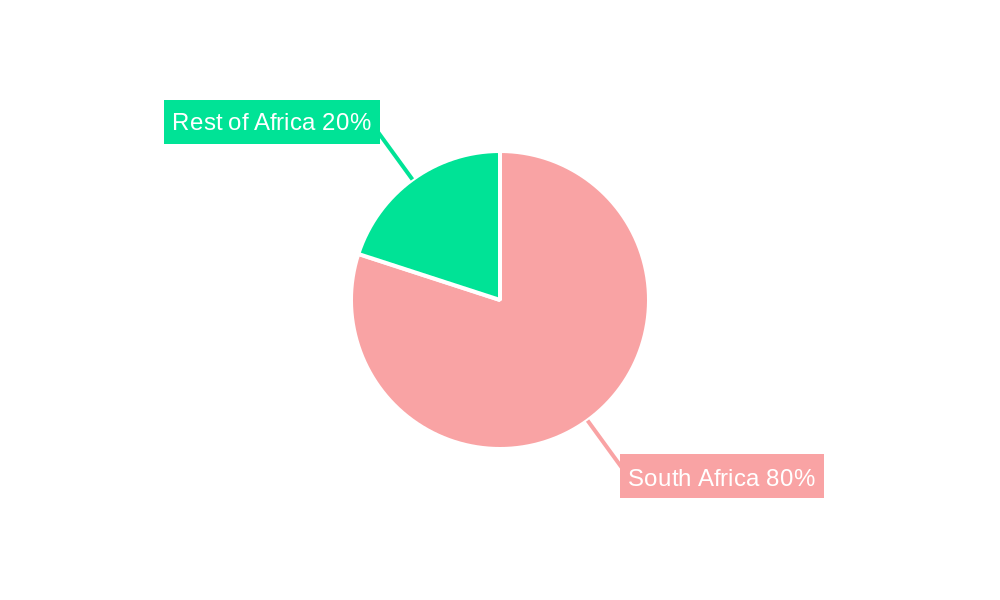
South Africa Beverages Market Regional Market Share
Geographic Coverage of South Africa Beverages Market
South Africa Beverages Market REPORT HIGHLIGHTS
| Aspects | Details |
|---|---|
| Study Period | 2020-2034 |
| Base Year | 2025 |
| Estimated Year | 2026 |
| Forecast Period | 2026-2034 |
| Historical Period | 2020-2025 |
| Growth Rate | CAGR of 13.3% from 2020-2034 |
| Segmentation |
|
Table of Contents
- 1. Introduction
- 1.1. Research Scope
- 1.2. Market Segmentation
- 1.3. Research Objective
- 1.4. Definitions and Assumptions
- 2. Executive Summary
- 2.1. Market Snapshot
- 3. Market Dynamics
- 3.1. Market Drivers
- 3.2. Market Restrains
- 3.3. Market Trends
- 3.4. Market Opportunities
- 4. Market Factor Analysis
- 4.1. Porters Five Forces
- 4.1.1. Bargaining Power of Suppliers
- 4.1.2. Bargaining Power of Buyers
- 4.1.3. Threat of New Entrants
- 4.1.4. Threat of Substitutes
- 4.1.5. Competitive Rivalry
- 4.2. PESTEL analysis
- 4.3. BCG Analysis
- 4.3.1. Stars (High Growth, High Market Share)
- 4.3.2. Cash Cows (Low Growth, High Market Share)
- 4.3.3. Question Mark (High Growth, Low Market Share)
- 4.3.4. Dogs (Low Growth, Low Market Share)
- 4.4. Ansoff Matrix Analysis
- 4.5. Supply Chain Analysis
- 4.6. Regulatory Landscape
- 4.7. Current Market Potential and Opportunity Assessment (TAM–SAM–SOM Framework)
- 4.8. PMV Analyst Note
- 4.1. Porters Five Forces
- 5. Market Analysis, Insights and Forecast 2021-2033
- 5.1. Market Analysis, Insights and Forecast - by Product Type
- 5.1.1. Alcoholic Beverages
- 5.1.1.1. Beer
- 5.1.1.2. Wine
- 5.1.1.3. Spirits
- 5.1.2. Non-Alcoholic Beverages
- 5.1.2.1. Energy & Sport Drinks
- 5.1.2.2. Carbonated Soft Drinks
- 5.1.2.3. Tea & Coffee
- 5.1.2.4. Other Non-alcoholic Beverages
- 5.1.1. Alcoholic Beverages
- 5.2. Market Analysis, Insights and Forecast - by Distribution Channel
- 5.2.1. On-Trade
- 5.2.2. Off-Trade
- 5.2.2.1. Supermarkets/Hypermarkets
- 5.2.2.2. Convenience Stores
- 5.2.2.3. Online Retail Stores
- 5.2.2.4. Other Distribution Channels
- 5.3. Market Analysis, Insights and Forecast - by Region
- 5.3.1. South Africa
- 5.1. Market Analysis, Insights and Forecast - by Product Type
- 6. South Africa Beverages Market Analysis, Insights and Forecast, 2021-2033
- 6.1. Market Analysis, Insights and Forecast - by Product Type
- 6.1.1. Alcoholic Beverages
- 6.1.1.1. Beer
- 6.1.1.2. Wine
- 6.1.1.3. Spirits
- 6.1.2. Non-Alcoholic Beverages
- 6.1.2.1. Energy & Sport Drinks
- 6.1.2.2. Carbonated Soft Drinks
- 6.1.2.3. Tea & Coffee
- 6.1.2.4. Other Non-alcoholic Beverages
- 6.1.1. Alcoholic Beverages
- 6.2. Market Analysis, Insights and Forecast - by Distribution Channel
- 6.2.1. On-Trade
- 6.2.2. Off-Trade
- 6.2.2.1. Supermarkets/Hypermarkets
- 6.2.2.2. Convenience Stores
- 6.2.2.3. Online Retail Stores
- 6.2.2.4. Other Distribution Channels
- 6.1. Market Analysis, Insights and Forecast - by Product Type
- 7. Competitive Analysis
- 7.1. Company Profiles
- 7.1.1 Coco-Cola Company
- 7.1.1.1. Company Overview
- 7.1.1.2. Products
- 7.1.1.3. Company Financials
- 7.1.1.4. SWOT Analysis
- 7.1.2 PepsiCo Inc
- 7.1.2.1. Company Overview
- 7.1.2.2. Products
- 7.1.2.3. Company Financials
- 7.1.2.4. SWOT Analysis
- 7.1.3 Vital Pharmaceuticals (Bang Energy)
- 7.1.3.1. Company Overview
- 7.1.3.2. Products
- 7.1.3.3. Company Financials
- 7.1.3.4. SWOT Analysis
- 7.1.4 Kingsley Beverages
- 7.1.4.1. Company Overview
- 7.1.4.2. Products
- 7.1.4.3. Company Financials
- 7.1.4.4. SWOT Analysis
- 7.1.5 Red Bull GmbH
- 7.1.5.1. Company Overview
- 7.1.5.2. Products
- 7.1.5.3. Company Financials
- 7.1.5.4. SWOT Analysis
- 7.1.6 Anheuser-Busch InBev NV
- 7.1.6.1. Company Overview
- 7.1.6.2. Products
- 7.1.6.3. Company Financials
- 7.1.6.4. SWOT Analysis
- 7.1.7 The Beverage Company
- 7.1.7.1. Company Overview
- 7.1.7.2. Products
- 7.1.7.3. Company Financials
- 7.1.7.4. SWOT Analysis
- 7.1.8 Carlsberg Group
- 7.1.8.1. Company Overview
- 7.1.8.2. Products
- 7.1.8.3. Company Financials
- 7.1.8.4. SWOT Analysis
- 7.1.9 Ekhamanzi Springs (Pty) Ltd
- 7.1.9.1. Company Overview
- 7.1.9.2. Products
- 7.1.9.3. Company Financials
- 7.1.9.4. SWOT Analysis
- 7.1.10 Twizza Soft Drinks (Pty) Ltd*List Not Exhaustive
- 7.1.10.1. Company Overview
- 7.1.10.2. Products
- 7.1.10.3. Company Financials
- 7.1.10.4. SWOT Analysis
- 7.1.11 Diageo PLC
- 7.1.11.1. Company Overview
- 7.1.11.2. Products
- 7.1.11.3. Company Financials
- 7.1.11.4. SWOT Analysis
- 7.1.1 Coco-Cola Company
- 7.2. Market Entropy
- 7.2.1 Company's Key Areas Served
- 7.2.2 Recent Developments
- 7.3. Company Market Share Analysis 2025
- 7.3.1 Top 5 Companies Market Share Analysis
- 7.3.2 Top 3 Companies Market Share Analysis
- 7.4. List of Potential Customers
- 8. Research Methodology
List of Figures
- Figure 1: South Africa Beverages Market Revenue Breakdown (billion, %) by Product 2025 & 2033
- Figure 2: South Africa Beverages Market Share (%) by Company 2025
List of Tables
- Table 1: South Africa Beverages Market Revenue billion Forecast, by Product Type 2020 & 2033
- Table 2: South Africa Beverages Market Revenue billion Forecast, by Distribution Channel 2020 & 2033
- Table 3: South Africa Beverages Market Revenue billion Forecast, by Region 2020 & 2033
- Table 4: South Africa Beverages Market Revenue billion Forecast, by Product Type 2020 & 2033
- Table 5: South Africa Beverages Market Revenue billion Forecast, by Distribution Channel 2020 & 2033
- Table 6: South Africa Beverages Market Revenue billion Forecast, by Country 2020 & 2033
Frequently Asked Questions
1. What is the projected Compound Annual Growth Rate (CAGR) of the South Africa Beverages Market?
The projected CAGR is approximately 13.3%.
2. Which companies are prominent players in the South Africa Beverages Market?
Key companies in the market include Coco-Cola Company, PepsiCo Inc, Vital Pharmaceuticals (Bang Energy), Kingsley Beverages, Red Bull GmbH, Anheuser-Busch InBev NV, The Beverage Company, Carlsberg Group, Ekhamanzi Springs (Pty) Ltd, Twizza Soft Drinks (Pty) Ltd*List Not Exhaustive, Diageo PLC.
3. What are the main segments of the South Africa Beverages Market?
The market segments include Product Type, Distribution Channel.
4. Can you provide details about the market size?
The market size is estimated to be USD 19.8 billion as of 2022.
5. What are some drivers contributing to market growth?
Growing demand for flavored beverages in food and beverage industries.
6. What are the notable trends driving market growth?
Increased Consumption of Alcoholic Beverages.
7. Are there any restraints impacting market growth?
Increasing concerns regarding obesity and health awareness.
8. Can you provide examples of recent developments in the market?
September 2022: Coca-Cola introduced a new juice brand in South Africa, Cappy, a 100% fruit juice in various flavors, including Tropical, Orange Mango, Apple, Orange, and Grape.
9. What pricing options are available for accessing the report?
Pricing options include single-user, multi-user, and enterprise licenses priced at USD 3800, USD 4500, and USD 5800 respectively.
10. Is the market size provided in terms of value or volume?
The market size is provided in terms of value, measured in billion.
11. Are there any specific market keywords associated with the report?
Yes, the market keyword associated with the report is "South Africa Beverages Market," which aids in identifying and referencing the specific market segment covered.
12. How do I determine which pricing option suits my needs best?
The pricing options vary based on user requirements and access needs. Individual users may opt for single-user licenses, while businesses requiring broader access may choose multi-user or enterprise licenses for cost-effective access to the report.
13. Are there any additional resources or data provided in the South Africa Beverages Market report?
While the report offers comprehensive insights, it's advisable to review the specific contents or supplementary materials provided to ascertain if additional resources or data are available.
14. How can I stay updated on further developments or reports in the South Africa Beverages Market?
To stay informed about further developments, trends, and reports in the South Africa Beverages Market, consider subscribing to industry newsletters, following relevant companies and organizations, or regularly checking reputable industry news sources and publications.
Methodology
Step 1 - Identification of Relevant Samples Size from Population Database


Step 2 - Approaches for Defining Global Market Size (Value, Volume* & Price*)

Note*: In applicable scenarios
Step 3 - Data Sources
Primary Research
- Web Analytics
- Survey Reports
- Research Institute
- Latest Research Reports
- Opinion Leaders
Secondary Research
- Annual Reports
- White Paper
- Latest Press Release
- Industry Association
- Paid Database
- Investor Presentations

Step 4 - Data Triangulation
Involves using different sources of information in order to increase the validity of a study
These sources are likely to be stakeholders in a program - participants, other researchers, program staff, other community members, and so on.
Then we put all data in single framework & apply various statistical tools to find out the dynamic on the market.
During the analysis stage, feedback from the stakeholder groups would be compared to determine areas of agreement as well as areas of divergence