


Key Insights
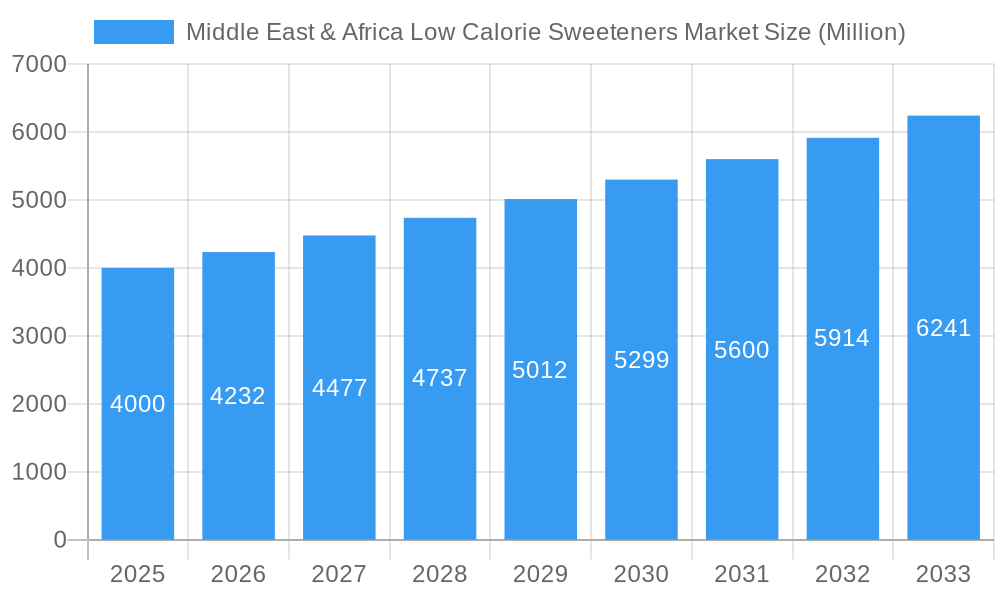
The Middle East & Africa (MEA) low-calorie sweeteners market is poised for robust growth, projected to reach a substantial market size of approximately USD 4,000 million by 2025 and expanding significantly through 2033. This expansion is fueled by a CAGR of 5.80%, indicating a consistent and healthy upward trajectory. Key drivers underpinning this growth include the escalating prevalence of lifestyle diseases such as diabetes and obesity across the region, prompting a surge in consumer demand for sugar alternatives. Furthermore, increasing health consciousness and a growing preference for weight management solutions are steering consumers towards low-calorie options. The burgeoning food and beverage industry in MEA, coupled with advancements in sweetener technology and product innovation, is also contributing to market expansion.
Middle East & Africa Low Calorie Sweeteners Market Market Size (In Billion)

The market is characterized by a diverse range of product types, with Sucralose, Aspartame, and Stevia emerging as dominant segments due to their widespread adoption and perceived health benefits. The application landscape is broad, spanning the dairy and frozen foods, confectionery, bakery, and beverage sectors, all of which are actively incorporating low-calorie sweeteners to cater to evolving consumer preferences. Pharmaceutical applications also present a growing opportunity. While the market benefits from numerous growth drivers, restraints such as fluctuating raw material prices and consumer perceptions regarding the safety and taste of artificial sweeteners warrant attention. However, the increasing availability of natural and plant-based sweeteners like Stevia is helping to mitigate these concerns and broaden market appeal. Leading companies are actively investing in research and development and expanding their regional presence to capitalize on the immense potential of the MEA market.
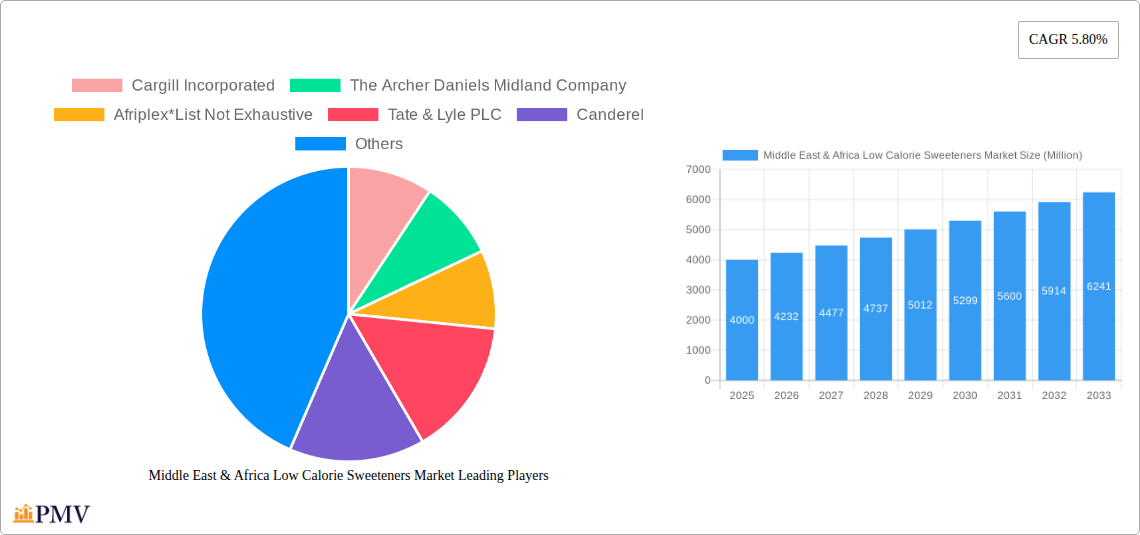
Middle East & Africa Low Calorie Sweeteners Market Company Market Share
This comprehensive report offers an in-depth analysis of the Middle East & Africa (MEA) low calorie sweeteners market, providing actionable insights for stakeholders. The study period spans from 2019 to 2033, with a base year of 2025, and an estimated year also in 2025. The forecast period covers 2025 to 2033, building upon historical data from 2019 to 2024. This report delves into market structure, competitive dynamics, industry trends, dominant markets, product innovations, segmentation, key drivers, challenges, leading players, and strategic outlook, empowering businesses to navigate this dynamic sector.
Middle East & Africa Low Calorie Sweeteners Market Market Structure & Competitive Dynamics
The Middle East & Africa low calorie sweeteners market exhibits a moderately fragmented structure, characterized by the presence of both multinational corporations and regional players. Market concentration is influenced by factors such as economies of scale in production, proprietary technological advancements, and established distribution networks. Innovation plays a crucial role, with companies actively investing in research and development to introduce novel sweetener formulations and explore new applications. Regulatory frameworks, while evolving, can present both opportunities and challenges for market entrants and established businesses alike. Product substitutes, including natural sugars and other high-intensity sweeteners, exert constant competitive pressure. End-user trends, particularly the increasing consumer demand for healthier and sugar-free options, are a significant catalyst for market growth. Merger and acquisition (M&A) activities are observed as companies seek to consolidate market share, expand their product portfolios, and gain access to new geographical regions. For instance, strategic acquisitions in the past have aimed to strengthen regional presence and secure supply chains. While specific market share data for all players is proprietary, key companies hold significant portions, driven by their innovation and market reach. M&A deal values are often substantial, reflecting the strategic importance of acquiring established brands and distribution channels within the MEA region.
Middle East & Africa Low Calorie Sweeteners Market Industry Trends & Insights
The MEA low calorie sweeteners market is experiencing robust growth, projected at a Compound Annual Growth Rate (CAGR) of XX% during the forecast period. This expansion is primarily driven by a confluence of factors including a growing health-conscious population, increasing prevalence of lifestyle diseases like diabetes and obesity, and a rising disposable income that fuels demand for premium, health-oriented products. Technological disruptions are also shaping the market, with advancements in extraction and purification processes for natural sweeteners like Stevia, leading to improved taste profiles and cost-effectiveness. Consumer preferences are rapidly shifting towards natural and naturally derived sweeteners, pushing manufacturers to invest in research and development of stevia-based and other plant-derived alternatives. The demand for sugar reduction in processed foods and beverages continues to rise, spurred by government initiatives and public health campaigns across the region. This trend is particularly pronounced in countries with high rates of diabetes and obesity. Competitive dynamics are intensifying as established global players compete with emerging regional manufacturers, leading to a focus on product differentiation, quality assurance, and competitive pricing. The market penetration of low calorie sweeteners is still at a nascent stage in many MEA countries, offering significant untapped potential for further growth. The evolving food and beverage industry, with its constant drive for product innovation and reformulation, further fuels the demand for diverse low calorie sweetener solutions.
Dominant Markets & Segments in Middle East & Africa Low Calorie Sweeteners Market
The Middle East & Africa low calorie sweeteners market is characterized by significant regional variations and segment dominance. The Artificial source type currently holds a substantial market share, driven by the cost-effectiveness and established applications of sweeteners like Sucralose and Aspartame. However, the Natural source type, particularly Stevia, is exhibiting remarkable growth, propelled by consumer demand for perceived health benefits and clean labels.
- Dominant Regions & Countries: The GCC countries, including the UAE, Saudi Arabia, and Qatar, represent the largest and fastest-growing markets within MEA. This dominance is attributed to:
- High disposable incomes and a strong consumer preference for premium and health-conscious products.
- Significant investments in the food and beverage industry, with a focus on product innovation and diversification.
- Government initiatives promoting healthy lifestyles and addressing rising rates of non-communicable diseases.
- Well-developed retail infrastructure and a strong presence of international food and beverage brands.
- Dominant Product Types:
- Sucralose: Remains a leading product type due to its versatility, stability, and widespread use across various applications, particularly in beverages and confectionery.
- Stevia: Is rapidly gaining traction, driven by its natural origin and zero-calorie profile. Its market share is projected to grow significantly in the coming years as production efficiencies improve and consumer acceptance broadens.
- Aspartame: Continues to be a significant player, especially in diet beverages, although its growth may be moderated by emerging natural alternatives.
- Dominant Applications:
- Beverage: This segment is the largest consumer of low calorie sweeteners, encompassing carbonated soft drinks, juices, and other functional beverages. The demand for sugar-free beverage options is a primary growth driver.
- Food (Dairy and Frozen Foods, Confectionery, Bakery): These sub-segments are also substantial, with increasing demand for reduced-sugar dairy products, sugar-free confectionery, and low-calorie bakery items.
Middle East & Africa Low Calorie Sweeteners Market Product Innovations
Product innovation in the MEA low calorie sweeteners market is primarily focused on enhancing taste profiles, improving solubility and stability, and developing cost-effective production methods. Companies are investing in R&D to create blends of sweeteners that mimic the taste and texture of sugar more closely, thereby addressing consumer preferences. Innovations in the extraction and purification of natural sweeteners like stevia are leading to cleaner taste profiles and reduced bitterness. Furthermore, the development of encapsulation technologies is improving the performance and application of various sweeteners in demanding food and beverage formulations. These advancements not only expand the potential applications for low calorie sweeteners but also provide competitive advantages by offering superior sensory experiences and functional benefits.
Report Segmentation & Scope
This report segments the Middle East & Africa low calorie sweeteners market by Source Type, Product Type, and Application. Source Type: The market is analyzed across Natural and Artificial sources, with a detailed examination of their respective growth trajectories and market penetration. Product Type: Key product types covered include Sucralose, Saccharin, Aspartame, Neotame, Advantame, Acesulfame Potassium, Stevia, and Others. The report provides market size estimates and growth projections for each of these distinct sweetener categories, alongside an analysis of their competitive dynamics. Application: The report delves into the applications within Food (Dairy and Frozen Foods, Confectionery, Bakery, Others), Beverage, and Pharmaceuticals. Each application segment is analyzed for its current market size, projected growth, and the specific drivers influencing sweetener demand within that sector.
Key Drivers of Middle East & Africa Low Calorie Sweeteners Market Growth
Several key factors are driving the growth of the MEA low calorie sweeteners market. Increasing consumer awareness regarding the health implications of high sugar consumption, coupled with a rising incidence of diabetes and obesity across the region, is a primary driver. Government initiatives promoting public health and encouraging sugar reduction in food and beverages further bolster demand. The expanding middle class with higher disposable incomes also contributes to the adoption of health-conscious products. Furthermore, advancements in the production and formulation of both natural and artificial sweeteners are making them more accessible and palatable for a wider range of applications, thereby fueling market expansion.
Challenges in the Middle East & Africa Low Calorie Sweeteners Market Sector
Despite the promising growth, the MEA low calorie sweeteners market faces several challenges. Regulatory hurdles, including varying approval processes and labeling requirements across different countries, can impede market entry and product launches. Supply chain complexities and the reliance on imported raw materials in some instances can lead to price volatility and availability issues. Consumer perception and education regarding the safety and benefits of certain artificial sweeteners, alongside the varying quality of natural sweetener extracts, can also pose challenges to market adoption. Furthermore, intense competition and the continuous introduction of new sweetener alternatives necessitate ongoing innovation and strategic pricing to maintain market share.
Leading Players in the Middle East & Africa Low Calorie Sweeteners Market Market
- Cargill Incorporated
- The Archer Daniels Midland Company
- Afriplex
- Tate & Lyle PLC
- Canderel
- PureCircle
- Ingredion Incorporated
Key Developments in Middle East & Africa Low Calorie Sweeteners Market Sector
- 2023: Launch of new stevia-based sweetener blends offering improved taste profiles by a leading ingredient supplier.
- 2022: Acquisition of a regional food ingredient distributor by a global sweetener manufacturer to enhance market reach in the GCC.
- 2021: Introduction of sugar-free beverage options by major beverage companies across the MEA region, driving demand for low calorie sweeteners.
- 2020: Increased investment in R&D for natural sweetener extraction technologies to improve cost-effectiveness and scalability.
- 2019: New food safety regulations implemented in several key MEA countries, impacting the approval process for certain artificial sweeteners.
Strategic Middle East & Africa Low Calorie Sweeteners Market Market Outlook
The strategic outlook for the MEA low calorie sweeteners market remains highly positive, driven by persistent health trends and evolving consumer preferences. Growth accelerators include the continued expansion of the processed food and beverage industries, particularly in convenience foods and healthier snack options. Opportunities lie in leveraging the rising demand for natural sweeteners and developing innovative solutions for the burgeoning pharmaceutical and nutraceutical sectors. Strategic partnerships and collaborations with local food manufacturers are crucial for market penetration. Companies that focus on product differentiation, sustainable sourcing, and a deep understanding of regional consumer needs are poised to capture significant market share in this dynamic and evolving landscape.
Middle East & Africa Low Calorie Sweeteners Market Segmentation
-
1. Source Type
- 1.1. Natural
- 1.2. Artificial
-
2. Product Type
- 2.1. Sucralose
- 2.2. Saccharin
- 2.3. Aspartame
- 2.4. Neotame
- 2.5. Advantame
- 2.6. Acesulfame Potassium
- 2.7. Stevia
- 2.8. Others
-
3. Application
-
3.1. Food
- 3.1.1. Dairy and Frozen Foods
- 3.1.2. Confectionery
- 3.1.3. Bakery
- 3.1.4. Others
- 3.2. Beverage
- 3.3. Pharmaceuticals
-
3.1. Food
Middle East & Africa Low Calorie Sweeteners Market Segmentation By Geography
-
1. Middle East
- 1.1. Saudi Arabia
- 1.2. United Arab Emirates
- 1.3. Israel
- 1.4. Qatar
- 1.5. Kuwait
- 1.6. Oman
- 1.7. Bahrain
- 1.8. Jordan
- 1.9. Lebanon
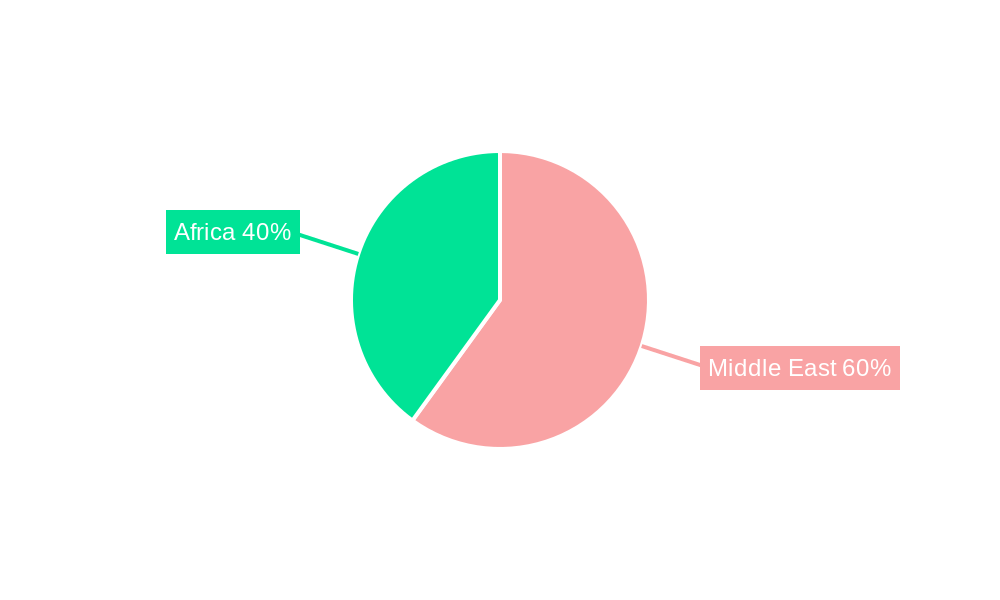
Middle East & Africa Low Calorie Sweeteners Market Regional Market Share
Geographic Coverage of Middle East & Africa Low Calorie Sweeteners Market
Middle East & Africa Low Calorie Sweeteners Market REPORT HIGHLIGHTS
| Aspects | Details |
|---|---|
| Study Period | 2020-2034 |
| Base Year | 2025 |
| Estimated Year | 2026 |
| Forecast Period | 2026-2034 |
| Historical Period | 2020-2025 |
| Growth Rate | CAGR of 4.1% from 2020-2034 |
| Segmentation |
|
Table of Contents
- 1. Introduction
- 1.1. Research Scope
- 1.2. Market Segmentation
- 1.3. Research Methodology
- 1.4. Definitions and Assumptions
- 2. Executive Summary
- 2.1. Introduction
- 3. Market Dynamics
- 3.1. Introduction
- 3.2. Market Drivers
- 3.2.1. Rising Application in Dietary Supplements
- 3.3. Market Restrains
- 3.3.1. Increasing prevalence of hydroglycemia
- 3.4. Market Trends
- 3.4.1. Government Taxes Curbing down the Consumption of Excess Sugar
- 4. Market Factor Analysis
- 4.1. Porters Five Forces
- 4.2. Supply/Value Chain
- 4.3. PESTEL analysis
- 4.4. Market Entropy
- 4.5. Patent/Trademark Analysis
- 5. Middle East & Africa Low Calorie Sweeteners Market Analysis, Insights and Forecast, 2020-2032
- 5.1. Market Analysis, Insights and Forecast - by Source Type
- 5.1.1. Natural
- 5.1.2. Artificial
- 5.2. Market Analysis, Insights and Forecast - by Product Type
- 5.2.1. Sucralose
- 5.2.2. Saccharin
- 5.2.3. Aspartame
- 5.2.4. Neotame
- 5.2.5. Advantame
- 5.2.6. Acesulfame Potassium
- 5.2.7. Stevia
- 5.2.8. Others
- 5.3. Market Analysis, Insights and Forecast - by Application
- 5.3.1. Food
- 5.3.1.1. Dairy and Frozen Foods
- 5.3.1.2. Confectionery
- 5.3.1.3. Bakery
- 5.3.1.4. Others
- 5.3.2. Beverage
- 5.3.3. Pharmaceuticals
- 5.3.1. Food
- 5.4. Market Analysis, Insights and Forecast - by Region
- 5.4.1. Middle East
- 5.1. Market Analysis, Insights and Forecast - by Source Type
- 6. Competitive Analysis
- 6.1. Market Share Analysis 2025
- 6.2. Company Profiles
- 6.2.1 Cargill Incorporated
- 6.2.1.1. Overview
- 6.2.1.2. Products
- 6.2.1.3. SWOT Analysis
- 6.2.1.4. Recent Developments
- 6.2.1.5. Financials (Based on Availability)
- 6.2.2 The Archer Daniels Midland Company
- 6.2.2.1. Overview
- 6.2.2.2. Products
- 6.2.2.3. SWOT Analysis
- 6.2.2.4. Recent Developments
- 6.2.2.5. Financials (Based on Availability)
- 6.2.3 Afriplex*List Not Exhaustive
- 6.2.3.1. Overview
- 6.2.3.2. Products
- 6.2.3.3. SWOT Analysis
- 6.2.3.4. Recent Developments
- 6.2.3.5. Financials (Based on Availability)
- 6.2.4 Tate & Lyle PLC
- 6.2.4.1. Overview
- 6.2.4.2. Products
- 6.2.4.3. SWOT Analysis
- 6.2.4.4. Recent Developments
- 6.2.4.5. Financials (Based on Availability)
- 6.2.5 Canderel
- 6.2.5.1. Overview
- 6.2.5.2. Products
- 6.2.5.3. SWOT Analysis
- 6.2.5.4. Recent Developments
- 6.2.5.5. Financials (Based on Availability)
- 6.2.6 PureCircle
- 6.2.6.1. Overview
- 6.2.6.2. Products
- 6.2.6.3. SWOT Analysis
- 6.2.6.4. Recent Developments
- 6.2.6.5. Financials (Based on Availability)
- 6.2.7 Ingredion Incorporated
- 6.2.7.1. Overview
- 6.2.7.2. Products
- 6.2.7.3. SWOT Analysis
- 6.2.7.4. Recent Developments
- 6.2.7.5. Financials (Based on Availability)
- 6.2.1 Cargill Incorporated
List of Figures
- Figure 1: Middle East & Africa Low Calorie Sweeteners Market Revenue Breakdown (undefined, %) by Product 2025 & 2033
- Figure 2: Middle East & Africa Low Calorie Sweeteners Market Share (%) by Company 2025
List of Tables
- Table 1: Middle East & Africa Low Calorie Sweeteners Market Revenue undefined Forecast, by Source Type 2020 & 2033
- Table 2: Middle East & Africa Low Calorie Sweeteners Market Revenue undefined Forecast, by Product Type 2020 & 2033
- Table 3: Middle East & Africa Low Calorie Sweeteners Market Revenue undefined Forecast, by Application 2020 & 2033
- Table 4: Middle East & Africa Low Calorie Sweeteners Market Revenue undefined Forecast, by Region 2020 & 2033
- Table 5: Middle East & Africa Low Calorie Sweeteners Market Revenue undefined Forecast, by Source Type 2020 & 2033
- Table 6: Middle East & Africa Low Calorie Sweeteners Market Revenue undefined Forecast, by Product Type 2020 & 2033
- Table 7: Middle East & Africa Low Calorie Sweeteners Market Revenue undefined Forecast, by Application 2020 & 2033
- Table 8: Middle East & Africa Low Calorie Sweeteners Market Revenue undefined Forecast, by Country 2020 & 2033
- Table 9: Saudi Arabia Middle East & Africa Low Calorie Sweeteners Market Revenue (undefined) Forecast, by Application 2020 & 2033
- Table 10: United Arab Emirates Middle East & Africa Low Calorie Sweeteners Market Revenue (undefined) Forecast, by Application 2020 & 2033
- Table 11: Israel Middle East & Africa Low Calorie Sweeteners Market Revenue (undefined) Forecast, by Application 2020 & 2033
- Table 12: Qatar Middle East & Africa Low Calorie Sweeteners Market Revenue (undefined) Forecast, by Application 2020 & 2033
- Table 13: Kuwait Middle East & Africa Low Calorie Sweeteners Market Revenue (undefined) Forecast, by Application 2020 & 2033
- Table 14: Oman Middle East & Africa Low Calorie Sweeteners Market Revenue (undefined) Forecast, by Application 2020 & 2033
- Table 15: Bahrain Middle East & Africa Low Calorie Sweeteners Market Revenue (undefined) Forecast, by Application 2020 & 2033
- Table 16: Jordan Middle East & Africa Low Calorie Sweeteners Market Revenue (undefined) Forecast, by Application 2020 & 2033
- Table 17: Lebanon Middle East & Africa Low Calorie Sweeteners Market Revenue (undefined) Forecast, by Application 2020 & 2033
Frequently Asked Questions
1. What is the projected Compound Annual Growth Rate (CAGR) of the Middle East & Africa Low Calorie Sweeteners Market?
The projected CAGR is approximately 4.1%.
2. Which companies are prominent players in the Middle East & Africa Low Calorie Sweeteners Market?
Key companies in the market include Cargill Incorporated, The Archer Daniels Midland Company, Afriplex*List Not Exhaustive, Tate & Lyle PLC, Canderel, PureCircle, Ingredion Incorporated.
3. What are the main segments of the Middle East & Africa Low Calorie Sweeteners Market?
The market segments include Source Type, Product Type, Application.
4. Can you provide details about the market size?
The market size is estimated to be USD XXX N/A as of 2022.
5. What are some drivers contributing to market growth?
Rising Application in Dietary Supplements.
6. What are the notable trends driving market growth?
Government Taxes Curbing down the Consumption of Excess Sugar.
7. Are there any restraints impacting market growth?
Increasing prevalence of hydroglycemia.
8. Can you provide examples of recent developments in the market?
N/A
9. What pricing options are available for accessing the report?
Pricing options include single-user, multi-user, and enterprise licenses priced at USD 4750, USD 5250, and USD 8750 respectively.
10. Is the market size provided in terms of value or volume?
The market size is provided in terms of value, measured in N/A.
11. Are there any specific market keywords associated with the report?
Yes, the market keyword associated with the report is "Middle East & Africa Low Calorie Sweeteners Market," which aids in identifying and referencing the specific market segment covered.
12. How do I determine which pricing option suits my needs best?
The pricing options vary based on user requirements and access needs. Individual users may opt for single-user licenses, while businesses requiring broader access may choose multi-user or enterprise licenses for cost-effective access to the report.
13. Are there any additional resources or data provided in the Middle East & Africa Low Calorie Sweeteners Market report?
While the report offers comprehensive insights, it's advisable to review the specific contents or supplementary materials provided to ascertain if additional resources or data are available.
14. How can I stay updated on further developments or reports in the Middle East & Africa Low Calorie Sweeteners Market?
To stay informed about further developments, trends, and reports in the Middle East & Africa Low Calorie Sweeteners Market, consider subscribing to industry newsletters, following relevant companies and organizations, or regularly checking reputable industry news sources and publications.
Methodology
Step 1 - Identification of Relevant Samples Size from Population Database


Step 2 - Approaches for Defining Global Market Size (Value, Volume* & Price*)

Note*: In applicable scenarios
Step 3 - Data Sources
Primary Research
- Web Analytics
- Survey Reports
- Research Institute
- Latest Research Reports
- Opinion Leaders
Secondary Research
- Annual Reports
- White Paper
- Latest Press Release
- Industry Association
- Paid Database
- Investor Presentations

Step 4 - Data Triangulation
Involves using different sources of information in order to increase the validity of a study
These sources are likely to be stakeholders in a program - participants, other researchers, program staff, other community members, and so on.
Then we put all data in single framework & apply various statistical tools to find out the dynamic on the market.
During the analysis stage, feedback from the stakeholder groups would be compared to determine areas of agreement as well as areas of divergence