

Key Insights
The global Champagne market is projected for substantial growth, anticipated to reach $6.43 billion by 2025, with a Compound Annual Growth Rate (CAGR) of 2.3% through 2033. This expansion is driven by increasing consumer preference for premium celebratory beverages, especially in emerging markets and among high-net-worth individuals. Evolving lifestyle trends position Champagne as a symbol of everyday luxury and fine dining, not solely for special occasions. Product innovation, including diverse varietals and the growth of direct-to-consumer sales via online retail, further fuels this positive market trajectory by enhancing accessibility and consumer reach.
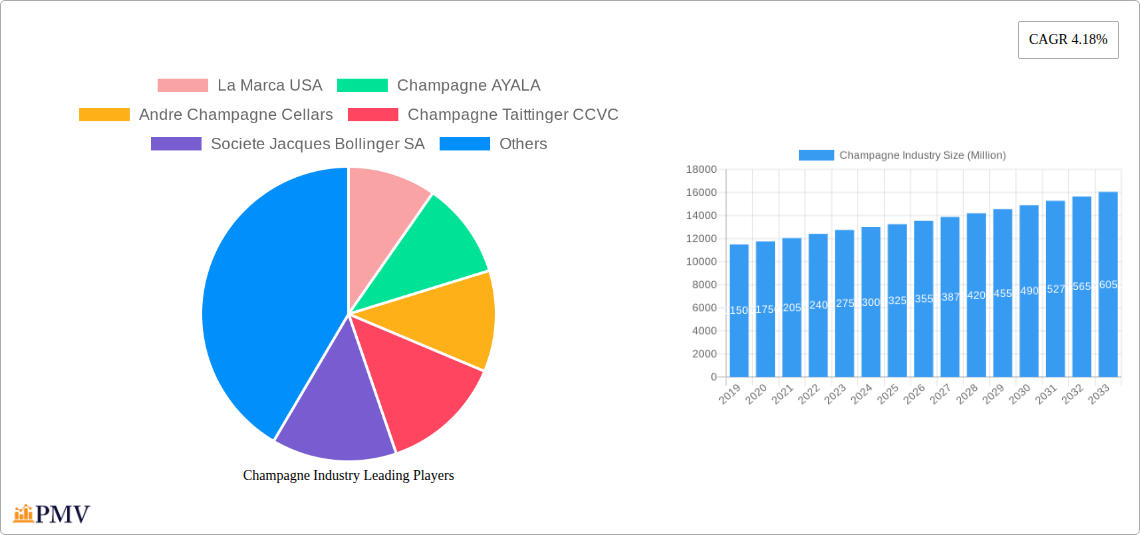
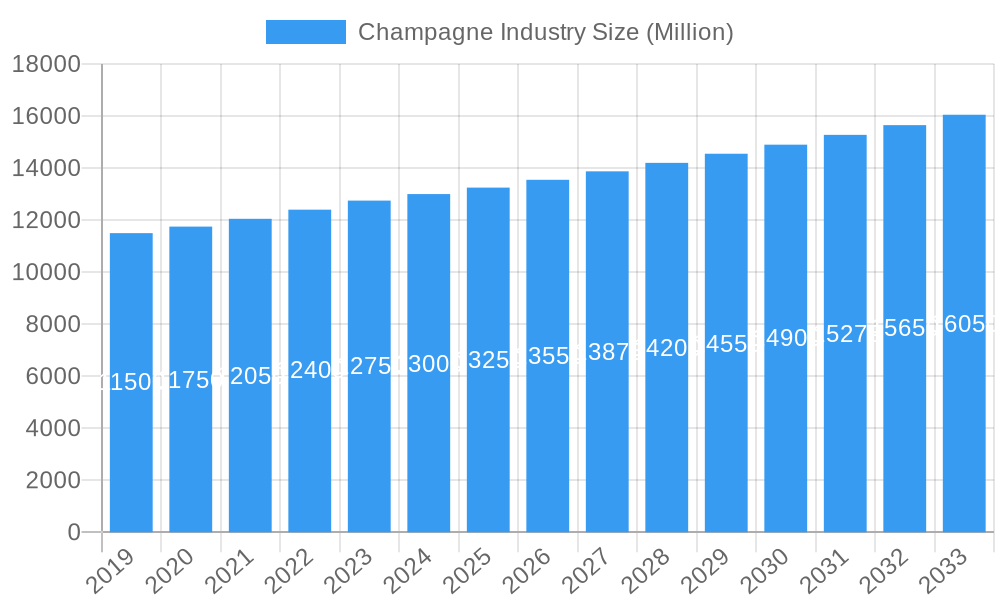
Champagne Industry Market Size (In Billion)
Key market restraints include potential fluctuations in grape costs impacting production expenses and pricing. Stringent regional regulations for production, labeling, and distribution present operational challenges. Geopolitical instability and economic downturns may reduce discretionary spending on luxury goods, affecting sales volumes. Nevertheless, Champagne's sustained allure as a marker of celebration and sophistication, supported by strategic marketing and product diversification from industry leaders like LVMH Moët Hennessy and Laurent-Perrier Group, ensures market resilience. North America and Europe will likely maintain dominance, while the Asia Pacific region offers significant growth potential.
Champagne Industry Company Market Share
This comprehensive report offers an in-depth analysis of the global Champagne industry, detailing market dynamics, growth catalysts, key segments, and competitive strategies from 2019 to 2033. With a base year of 2025 and a forecast period extending to 2033, this research is crucial for stakeholders navigating the premium sparkling wine sector. Explore key segments including Brut Champagne, Rosé Champagne, Blanc De Blancs, Blanc De Noirs, Demi-Sec, and Prestige Cuvée, alongside critical distribution channels such as On-Trade, Off-Trade, Online Retail Stores, and Offline Retail Stores.
Champagne Industry Market Structure & Competitive Dynamics
The Champagne industry is characterized by a highly concentrated market structure, dominated by a few prominent players who control a significant portion of global production and distribution. Innovation ecosystems thrive, driven by legacy houses and emerging producers focused on unique terroirs and winemaking techniques. Regulatory frameworks, primarily governed by the Appellation d'Origine Contrôlée (AOC) system, ensure the authenticity and quality of Champagne. Product substitutes, such as Prosecco and Cava, pose a competitive challenge, though Champagne maintains its premium positioning. End-user trends lean towards discerning consumers seeking exclusive experiences and high-quality products, with a growing appreciation for sustainable practices and vintage expressions. Mergers and acquisitions (M&A) activities, while less frequent than in other beverage sectors, play a role in market consolidation and brand portfolio expansion. Major M&A deals in recent years have seen significant value transactions, reflecting the strategic importance of established Champagne houses. The market share of leading players is a crucial metric, with top companies holding substantial influence.
- Market Concentration: Dominated by a few key players.
- Innovation Ecosystems: Driven by quality, tradition, and niche offerings.
- Regulatory Frameworks: Strict AOC regulations ensure authenticity.
- Product Substitutes: Prosecco and Cava offer competitive price points.
- End-User Trends: Growing demand for premium, experiential, and sustainable products.
- M&A Activities: Strategic acquisitions to expand portfolios and market reach.
Champagne Industry Industry Trends & Insights
The global Champagne industry is poised for steady growth, driven by increasing disposable incomes in emerging economies and a sustained demand for luxury goods. The CAGR for the Champagne market is projected to be a robust XX%, indicating significant expansion over the forecast period. Technological disruptions are influencing winemaking processes, from advanced vineyard management techniques to enhanced bottling and packaging innovations, ensuring quality and shelf-life. Consumer preferences are evolving, with a noticeable shift towards lighter, fruitier styles of Champagne, alongside a renewed interest in Blanc de Blancs and Blanc de Noirs for their distinct characteristics. The rise of online retail stores has dramatically impacted distribution, offering consumers greater accessibility to a wider range of Champagnes, while the traditional on-trade sector continues to be a vital channel for premium experiences. Competitive dynamics are intensifying, with producers differentiating themselves through exclusive vintage releases, limited editions, and vineyard-specific bottlings. Market penetration of premium Champagne continues to rise, particularly in key global markets where celebrations and sophisticated consumption habits are prevalent. The exploration of new terroir and innovative blending techniques are also contributing to the market's dynamism, ensuring its continued appeal to a discerning global clientele. The influence of social media and influencer marketing further shapes consumer perception and purchasing decisions, driving demand for specific brands and styles.
Dominant Markets & Segments in Champagne Industry
The dominant region for Champagne production remains the Champagne region of France, with its unique chalky soil and specific climate providing an unparalleled terroir. Within this region, Brut Champagne consistently leads the market in terms of volume and value, owing to its versatility and widespread appeal. However, Rose Champagne is experiencing significant growth, driven by increasing consumer acceptance and its suitability for a wider range of culinary pairings. Prestige Cuvee segments, representing the pinnacle of Champagne craftsmanship, also hold substantial market share, catering to a high-net-worth individual segment and special occasions.
Key Drivers for Dominance:
- Economic Policies: Favorable trade agreements and consumer spending power in developed economies.
- Infrastructure: Robust logistics and distribution networks within France and globally.
- Brand Heritage and Reputation: Decades, even centuries, of established prestige and quality perception.
- Terroir Specificity: The unique geographical indication (GI) of Champagne, France, offering an exclusive production zone.
The Off-Trade distribution channel, particularly Online Retail Stores, is rapidly gaining prominence due to convenience and accessibility, complementing the traditional Offline Retail Stores and On-Trade establishments like restaurants and hotels. The dominance of Brut Champagne is underscored by its consistent demand across all distribution channels. Blanc de Blancs, known for its elegance and crispness, is gaining traction among connoisseurs, while Blanc de Noirs, offering richness and structure, appeals to those seeking bolder flavor profiles. Demi-Sec, though a smaller segment, serves a niche market appreciative of its sweeter profile. The strategic importance of these segments within the overall Champagne market cannot be overstated, as they collectively contribute to the industry's resilience and continued growth.
Champagne Industry Product Innovations
Product innovations in the Champagne industry are centered on enhancing the sensory experience and catering to evolving consumer preferences. This includes the development of lower-dosage Champagnes for a crisper profile, experimental aging techniques, and the introduction of single-vineyard or plot-specific cuvées that highlight unique terroirs. Packaging innovations, such as bespoke gift boxes and sustainable materials, are also crucial for competitive advantage. Technological advancements in viticulture and oenology contribute to producing Champagnes with distinct characteristics, offering competitive advantages in terms of quality and uniqueness. Market fit is achieved by aligning these innovations with consumer trends towards premiumization, authenticity, and personalized experiences.
Report Segmentation & Scope
This report meticulously segments the Champagne industry based on key product types and distribution channels. The segments analyzed include Brut Champagne, Rose Champagne, Blanc De Blancs, Blanc De Noirs, Demi-Sec, and Prestige Cuvee. Each of these segments exhibits unique growth projections and market sizes, driven by distinct consumer preferences and market dynamics. Furthermore, the report examines the On-Trade and Off-Trade distribution channels, with a granular focus on Online Retail Stores and Offline Retail Stores. Growth projections for Online Retail Stores are particularly strong, reflecting the ongoing digital transformation in consumer purchasing habits. Competitive dynamics within each segment are assessed, identifying key players and their strategic positioning.
Key Drivers of Champagne Industry Growth
The Champagne industry's growth is propelled by a confluence of technological, economic, and regulatory factors. Economically, rising global disposable incomes and an increasing demand for luxury goods, particularly in emerging markets, are significant accelerators. Technologically, advancements in vineyard management and winemaking techniques ensure consistent quality and the potential for innovative product development. Regulatory frameworks, such as the strict AOC designations, maintain the exclusivity and perceived value of Champagne, differentiating it from sparkling wine alternatives. The cultural significance of Champagne in celebrations and major life events also acts as a perpetual driver of demand.
- Economic Growth: Increased disposable income fueling luxury spending.
- Consumer Trends: Growing appreciation for premium and celebratory beverages.
- Technological Advancements: Improved production efficiency and quality control.
- Brand Prestige: Enduring legacy and perception of exclusivity.
- Cultural Significance: Integral role in celebrations and special occasions.
Challenges in the Champagne Industry Sector
Despite its robust growth, the Champagne industry faces several challenges. Regulatory hurdles, while ensuring quality, can also restrict innovation and expansion into new territories. Supply chain disruptions, exacerbated by global events, can impact the availability of key resources and distribution networks. Intense competitive pressures from other sparkling wine categories, particularly those offering more accessible price points, necessitate continuous differentiation and value proposition refinement. Furthermore, changing climate patterns pose long-term risks to vineyard yields and grape quality.
- Regulatory Complexities: Strict appellation rules.
- Supply Chain Vulnerabilities: Global logistics and resource availability.
- Competitive Pressure: From Prosecco, Cava, and other sparkling wines.
- Climate Change: Potential impact on grape yields and quality.
- Economic Volatility: Fluctuations in consumer spending on luxury goods.
Leading Players in the Champagne Industry Market
- La Marca USA
- Champagne AYALA
- Andre Champagne Cellars
- Champagne Taittinger CCVC
- Societe Jacques Bollinger SA
- LVMH Moet Hennessy
- Laurent-Perrier Group
- Diageo plc
- F Korbel & Bros
- Cook's Champagne Cellars
Key Developments in Champagne Industry Sector
- October 2022: Societe Jacques Bollinger SA introduced "Special Cuvee, The Bollinger Style," a limited edition champagne celebrating its 40-year partnership with 007. The gift box featured James Bond and his Aston Martin DB5.
- April 2022: Champagne Krug (an LVMH brand) launched two new editions of its "Grande Cuvées," white and rose. Both champagnes were composed in 2014, described by Krug as an "Erratic year."
- February 2022: Champagne Louis Roederer launched its 2014 vintage "Cristal," with a dosage of 7 g/L and a retail price of approximately USD 331.98 per 75 cl bottle in the UK.
Strategic Champagne Industry Market Outlook
The strategic outlook for the Champagne industry remains exceptionally bright, fueled by sustained global demand for luxury and premium beverages. Growth accelerators include the increasing purchasing power of millennial and Gen Z consumers who associate Champagne with aspirational lifestyles and celebratory moments. The expansion of e-commerce platforms continues to open new avenues for market penetration, making premium Champagne more accessible globally. Furthermore, a growing consumer consciousness towards sustainability and ethical production practices presents an opportunity for brands to differentiate themselves through responsible winemaking. Strategic collaborations, targeted marketing campaigns, and the introduction of innovative, niche products will be crucial for sustained success. The industry's ability to maintain its exclusivity while adapting to evolving consumer expectations will define its future trajectory, promising continued value creation and market leadership.
Champagne Industry Segmentation
-
1. Type
- 1.1. Brut Champagne
- 1.2. Rose Champagne
- 1.3. Blanc De Blancs
- 1.4. Blanc De Noirs
- 1.5. Demi-Sec
- 1.6. Prestige Cuvee
-
2. Distribution Channel
- 2.1. On-Trade
-
2.2. Off-Trade
- 2.2.1. Online Retail Stores
- 2.2.2. Offline Retail Stores
Champagne Industry Segmentation By Geography
-
1. North America
- 1.1. United States
- 1.2. Canada
- 1.3. Mexico
- 1.4. Rest of North America
-
2. Europe
- 2.1. United Kingdom
- 2.2. Germany
- 2.3. Spain
- 2.4. France
- 2.5. Italy
- 2.6. Russia
- 2.7. Rest of Europe
-
3. Asia Pacific
- 3.1. China
- 3.2. Japan
- 3.3. India
- 3.4. Australia
- 3.5. Rest of Asia Pacific
-
4. South America
- 4.1. Brazil
- 4.2. Argentina
- 4.3. Rest of South America
-
5. Middle East and Africa
- 5.1. South Africa
- 5.2. Saudi Arabia
- 5.3. Rest of Middle East and Africa
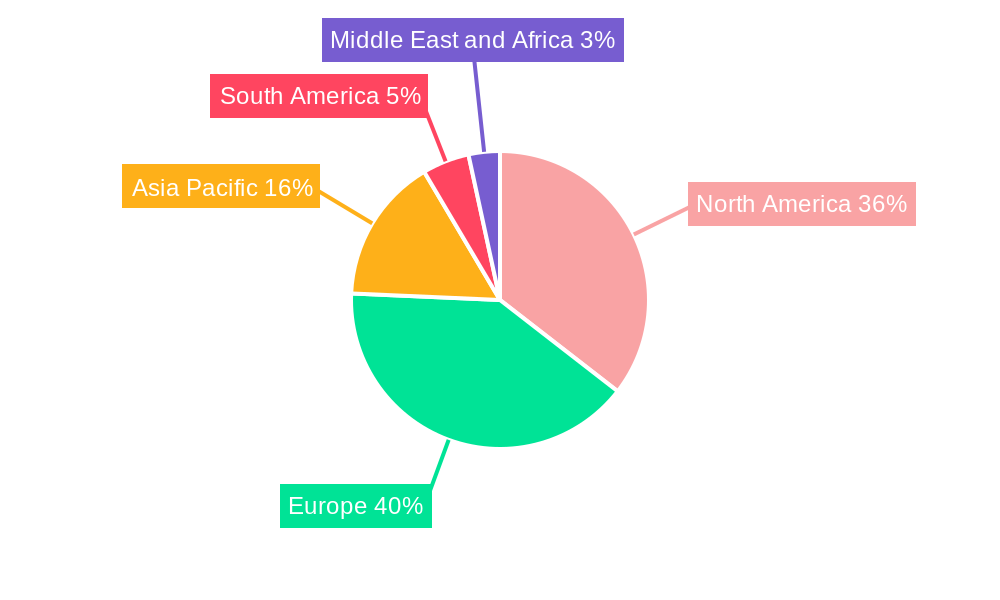
Champagne Industry Regional Market Share
Geographic Coverage of Champagne Industry
Champagne Industry REPORT HIGHLIGHTS
| Aspects | Details |
|---|---|
| Study Period | 2020-2034 |
| Base Year | 2025 |
| Estimated Year | 2026 |
| Forecast Period | 2026-2034 |
| Historical Period | 2020-2025 |
| Growth Rate | CAGR of 2.3% from 2020-2034 |
| Segmentation |
|
Table of Contents
- 1. Introduction
- 1.1. Research Scope
- 1.2. Market Segmentation
- 1.3. Research Objective
- 1.4. Definitions and Assumptions
- 2. Executive Summary
- 2.1. Market Snapshot
- 3. Market Dynamics
- 3.1. Market Drivers
- 3.2. Market Restrains
- 3.3. Market Trends
- 3.4. Market Opportunities
- 4. Market Factor Analysis
- 4.1. Porters Five Forces
- 4.1.1. Bargaining Power of Suppliers
- 4.1.2. Bargaining Power of Buyers
- 4.1.3. Threat of New Entrants
- 4.1.4. Threat of Substitutes
- 4.1.5. Competitive Rivalry
- 4.2. PESTEL analysis
- 4.3. BCG Analysis
- 4.3.1. Stars (High Growth, High Market Share)
- 4.3.2. Cash Cows (Low Growth, High Market Share)
- 4.3.3. Question Mark (High Growth, Low Market Share)
- 4.3.4. Dogs (Low Growth, Low Market Share)
- 4.4. Ansoff Matrix Analysis
- 4.5. Supply Chain Analysis
- 4.6. Regulatory Landscape
- 4.7. Current Market Potential and Opportunity Assessment (TAM–SAM–SOM Framework)
- 4.8. PMV Analyst Note
- 4.1. Porters Five Forces
- 5. Market Analysis, Insights and Forecast 2021-2033
- 5.1. Market Analysis, Insights and Forecast - by Type
- 5.1.1. Brut Champagne
- 5.1.2. Rose Champagne
- 5.1.3. Blanc De Blancs
- 5.1.4. Blanc De Noirs
- 5.1.5. Demi-Sec
- 5.1.6. Prestige Cuvee
- 5.2. Market Analysis, Insights and Forecast - by Distribution Channel
- 5.2.1. On-Trade
- 5.2.2. Off-Trade
- 5.2.2.1. Online Retail Stores
- 5.2.2.2. Offline Retail Stores
- 5.3. Market Analysis, Insights and Forecast - by Region
- 5.3.1. North America
- 5.3.2. Europe
- 5.3.3. Asia Pacific
- 5.3.4. South America
- 5.3.5. Middle East and Africa
- 5.1. Market Analysis, Insights and Forecast - by Type
- 6. Global Champagne Industry Analysis, Insights and Forecast, 2021-2033
- 6.1. Market Analysis, Insights and Forecast - by Type
- 6.1.1. Brut Champagne
- 6.1.2. Rose Champagne
- 6.1.3. Blanc De Blancs
- 6.1.4. Blanc De Noirs
- 6.1.5. Demi-Sec
- 6.1.6. Prestige Cuvee
- 6.2. Market Analysis, Insights and Forecast - by Distribution Channel
- 6.2.1. On-Trade
- 6.2.2. Off-Trade
- 6.2.2.1. Online Retail Stores
- 6.2.2.2. Offline Retail Stores
- 6.1. Market Analysis, Insights and Forecast - by Type
- 7. North America Champagne Industry Analysis, Insights and Forecast, 2020-2032
- 7.1. Market Analysis, Insights and Forecast - by Type
- 7.1.1. Brut Champagne
- 7.1.2. Rose Champagne
- 7.1.3. Blanc De Blancs
- 7.1.4. Blanc De Noirs
- 7.1.5. Demi-Sec
- 7.1.6. Prestige Cuvee
- 7.2. Market Analysis, Insights and Forecast - by Distribution Channel
- 7.2.1. On-Trade
- 7.2.2. Off-Trade
- 7.2.2.1. Online Retail Stores
- 7.2.2.2. Offline Retail Stores
- 7.1. Market Analysis, Insights and Forecast - by Type
- 8. Europe Champagne Industry Analysis, Insights and Forecast, 2020-2032
- 8.1. Market Analysis, Insights and Forecast - by Type
- 8.1.1. Brut Champagne
- 8.1.2. Rose Champagne
- 8.1.3. Blanc De Blancs
- 8.1.4. Blanc De Noirs
- 8.1.5. Demi-Sec
- 8.1.6. Prestige Cuvee
- 8.2. Market Analysis, Insights and Forecast - by Distribution Channel
- 8.2.1. On-Trade
- 8.2.2. Off-Trade
- 8.2.2.1. Online Retail Stores
- 8.2.2.2. Offline Retail Stores
- 8.1. Market Analysis, Insights and Forecast - by Type
- 9. Asia Pacific Champagne Industry Analysis, Insights and Forecast, 2020-2032
- 9.1. Market Analysis, Insights and Forecast - by Type
- 9.1.1. Brut Champagne
- 9.1.2. Rose Champagne
- 9.1.3. Blanc De Blancs
- 9.1.4. Blanc De Noirs
- 9.1.5. Demi-Sec
- 9.1.6. Prestige Cuvee
- 9.2. Market Analysis, Insights and Forecast - by Distribution Channel
- 9.2.1. On-Trade
- 9.2.2. Off-Trade
- 9.2.2.1. Online Retail Stores
- 9.2.2.2. Offline Retail Stores
- 9.1. Market Analysis, Insights and Forecast - by Type
- 10. South America Champagne Industry Analysis, Insights and Forecast, 2020-2032
- 10.1. Market Analysis, Insights and Forecast - by Type
- 10.1.1. Brut Champagne
- 10.1.2. Rose Champagne
- 10.1.3. Blanc De Blancs
- 10.1.4. Blanc De Noirs
- 10.1.5. Demi-Sec
- 10.1.6. Prestige Cuvee
- 10.2. Market Analysis, Insights and Forecast - by Distribution Channel
- 10.2.1. On-Trade
- 10.2.2. Off-Trade
- 10.2.2.1. Online Retail Stores
- 10.2.2.2. Offline Retail Stores
- 10.1. Market Analysis, Insights and Forecast - by Type
- 11. Middle East and Africa Champagne Industry Analysis, Insights and Forecast, 2020-2032
- 11.1. Market Analysis, Insights and Forecast - by Type
- 11.1.1. Brut Champagne
- 11.1.2. Rose Champagne
- 11.1.3. Blanc De Blancs
- 11.1.4. Blanc De Noirs
- 11.1.5. Demi-Sec
- 11.1.6. Prestige Cuvee
- 11.2. Market Analysis, Insights and Forecast - by Distribution Channel
- 11.2.1. On-Trade
- 11.2.2. Off-Trade
- 11.2.2.1. Online Retail Stores
- 11.2.2.2. Offline Retail Stores
- 11.1. Market Analysis, Insights and Forecast - by Type
- 12. Competitive Analysis
- 12.1. Company Profiles
- 12.1.1 La Marca USA
- 12.1.1.1. Company Overview
- 12.1.1.2. Products
- 12.1.1.3. Company Financials
- 12.1.1.4. SWOT Analysis
- 12.1.2 Champagne AYALA
- 12.1.2.1. Company Overview
- 12.1.2.2. Products
- 12.1.2.3. Company Financials
- 12.1.2.4. SWOT Analysis
- 12.1.3 Andre Champagne Cellars
- 12.1.3.1. Company Overview
- 12.1.3.2. Products
- 12.1.3.3. Company Financials
- 12.1.3.4. SWOT Analysis
- 12.1.4 Champagne Taittinger CCVC
- 12.1.4.1. Company Overview
- 12.1.4.2. Products
- 12.1.4.3. Company Financials
- 12.1.4.4. SWOT Analysis
- 12.1.5 Societe Jacques Bollinger SA
- 12.1.5.1. Company Overview
- 12.1.5.2. Products
- 12.1.5.3. Company Financials
- 12.1.5.4. SWOT Analysis
- 12.1.6 LVMH Moet Hennessy*List Not Exhaustive
- 12.1.6.1. Company Overview
- 12.1.6.2. Products
- 12.1.6.3. Company Financials
- 12.1.6.4. SWOT Analysis
- 12.1.7 Laurent-Perrier Group
- 12.1.7.1. Company Overview
- 12.1.7.2. Products
- 12.1.7.3. Company Financials
- 12.1.7.4. SWOT Analysis
- 12.1.8 Diageo plc
- 12.1.8.1. Company Overview
- 12.1.8.2. Products
- 12.1.8.3. Company Financials
- 12.1.8.4. SWOT Analysis
- 12.1.9 F Korbel & Bros
- 12.1.9.1. Company Overview
- 12.1.9.2. Products
- 12.1.9.3. Company Financials
- 12.1.9.4. SWOT Analysis
- 12.1.10 Cook's Champagne Cellars
- 12.1.10.1. Company Overview
- 12.1.10.2. Products
- 12.1.10.3. Company Financials
- 12.1.10.4. SWOT Analysis
- 12.1.1 La Marca USA
- 12.2. Market Entropy
- 12.2.1 Company's Key Areas Served
- 12.2.2 Recent Developments
- 12.3. Company Market Share Analysis 2025
- 12.3.1 Top 5 Companies Market Share Analysis
- 12.3.2 Top 3 Companies Market Share Analysis
- 12.4. List of Potential Customers
- 13. Research Methodology
List of Figures
- Figure 1: Global Champagne Industry Revenue Breakdown (billion, %) by Region 2025 & 2033
- Figure 2: Global Champagne Industry Volume Breakdown (Million, %) by Region 2025 & 2033
- Figure 3: North America Champagne Industry Revenue (billion), by Type 2025 & 2033
- Figure 4: North America Champagne Industry Volume (Million), by Type 2025 & 2033
- Figure 5: North America Champagne Industry Revenue Share (%), by Type 2025 & 2033
- Figure 6: North America Champagne Industry Volume Share (%), by Type 2025 & 2033
- Figure 7: North America Champagne Industry Revenue (billion), by Distribution Channel 2025 & 2033
- Figure 8: North America Champagne Industry Volume (Million), by Distribution Channel 2025 & 2033
- Figure 9: North America Champagne Industry Revenue Share (%), by Distribution Channel 2025 & 2033
- Figure 10: North America Champagne Industry Volume Share (%), by Distribution Channel 2025 & 2033
- Figure 11: North America Champagne Industry Revenue (billion), by Country 2025 & 2033
- Figure 12: North America Champagne Industry Volume (Million), by Country 2025 & 2033
- Figure 13: North America Champagne Industry Revenue Share (%), by Country 2025 & 2033
- Figure 14: North America Champagne Industry Volume Share (%), by Country 2025 & 2033
- Figure 15: Europe Champagne Industry Revenue (billion), by Type 2025 & 2033
- Figure 16: Europe Champagne Industry Volume (Million), by Type 2025 & 2033
- Figure 17: Europe Champagne Industry Revenue Share (%), by Type 2025 & 2033
- Figure 18: Europe Champagne Industry Volume Share (%), by Type 2025 & 2033
- Figure 19: Europe Champagne Industry Revenue (billion), by Distribution Channel 2025 & 2033
- Figure 20: Europe Champagne Industry Volume (Million), by Distribution Channel 2025 & 2033
- Figure 21: Europe Champagne Industry Revenue Share (%), by Distribution Channel 2025 & 2033
- Figure 22: Europe Champagne Industry Volume Share (%), by Distribution Channel 2025 & 2033
- Figure 23: Europe Champagne Industry Revenue (billion), by Country 2025 & 2033
- Figure 24: Europe Champagne Industry Volume (Million), by Country 2025 & 2033
- Figure 25: Europe Champagne Industry Revenue Share (%), by Country 2025 & 2033
- Figure 26: Europe Champagne Industry Volume Share (%), by Country 2025 & 2033
- Figure 27: Asia Pacific Champagne Industry Revenue (billion), by Type 2025 & 2033
- Figure 28: Asia Pacific Champagne Industry Volume (Million), by Type 2025 & 2033
- Figure 29: Asia Pacific Champagne Industry Revenue Share (%), by Type 2025 & 2033
- Figure 30: Asia Pacific Champagne Industry Volume Share (%), by Type 2025 & 2033
- Figure 31: Asia Pacific Champagne Industry Revenue (billion), by Distribution Channel 2025 & 2033
- Figure 32: Asia Pacific Champagne Industry Volume (Million), by Distribution Channel 2025 & 2033
- Figure 33: Asia Pacific Champagne Industry Revenue Share (%), by Distribution Channel 2025 & 2033
- Figure 34: Asia Pacific Champagne Industry Volume Share (%), by Distribution Channel 2025 & 2033
- Figure 35: Asia Pacific Champagne Industry Revenue (billion), by Country 2025 & 2033
- Figure 36: Asia Pacific Champagne Industry Volume (Million), by Country 2025 & 2033
- Figure 37: Asia Pacific Champagne Industry Revenue Share (%), by Country 2025 & 2033
- Figure 38: Asia Pacific Champagne Industry Volume Share (%), by Country 2025 & 2033
- Figure 39: South America Champagne Industry Revenue (billion), by Type 2025 & 2033
- Figure 40: South America Champagne Industry Volume (Million), by Type 2025 & 2033
- Figure 41: South America Champagne Industry Revenue Share (%), by Type 2025 & 2033
- Figure 42: South America Champagne Industry Volume Share (%), by Type 2025 & 2033
- Figure 43: South America Champagne Industry Revenue (billion), by Distribution Channel 2025 & 2033
- Figure 44: South America Champagne Industry Volume (Million), by Distribution Channel 2025 & 2033
- Figure 45: South America Champagne Industry Revenue Share (%), by Distribution Channel 2025 & 2033
- Figure 46: South America Champagne Industry Volume Share (%), by Distribution Channel 2025 & 2033
- Figure 47: South America Champagne Industry Revenue (billion), by Country 2025 & 2033
- Figure 48: South America Champagne Industry Volume (Million), by Country 2025 & 2033
- Figure 49: South America Champagne Industry Revenue Share (%), by Country 2025 & 2033
- Figure 50: South America Champagne Industry Volume Share (%), by Country 2025 & 2033
- Figure 51: Middle East and Africa Champagne Industry Revenue (billion), by Type 2025 & 2033
- Figure 52: Middle East and Africa Champagne Industry Volume (Million), by Type 2025 & 2033
- Figure 53: Middle East and Africa Champagne Industry Revenue Share (%), by Type 2025 & 2033
- Figure 54: Middle East and Africa Champagne Industry Volume Share (%), by Type 2025 & 2033
- Figure 55: Middle East and Africa Champagne Industry Revenue (billion), by Distribution Channel 2025 & 2033
- Figure 56: Middle East and Africa Champagne Industry Volume (Million), by Distribution Channel 2025 & 2033
- Figure 57: Middle East and Africa Champagne Industry Revenue Share (%), by Distribution Channel 2025 & 2033
- Figure 58: Middle East and Africa Champagne Industry Volume Share (%), by Distribution Channel 2025 & 2033
- Figure 59: Middle East and Africa Champagne Industry Revenue (billion), by Country 2025 & 2033
- Figure 60: Middle East and Africa Champagne Industry Volume (Million), by Country 2025 & 2033
- Figure 61: Middle East and Africa Champagne Industry Revenue Share (%), by Country 2025 & 2033
- Figure 62: Middle East and Africa Champagne Industry Volume Share (%), by Country 2025 & 2033
List of Tables
- Table 1: Global Champagne Industry Revenue billion Forecast, by Type 2020 & 2033
- Table 2: Global Champagne Industry Volume Million Forecast, by Type 2020 & 2033
- Table 3: Global Champagne Industry Revenue billion Forecast, by Distribution Channel 2020 & 2033
- Table 4: Global Champagne Industry Volume Million Forecast, by Distribution Channel 2020 & 2033
- Table 5: Global Champagne Industry Revenue billion Forecast, by Region 2020 & 2033
- Table 6: Global Champagne Industry Volume Million Forecast, by Region 2020 & 2033
- Table 7: Global Champagne Industry Revenue billion Forecast, by Type 2020 & 2033
- Table 8: Global Champagne Industry Volume Million Forecast, by Type 2020 & 2033
- Table 9: Global Champagne Industry Revenue billion Forecast, by Distribution Channel 2020 & 2033
- Table 10: Global Champagne Industry Volume Million Forecast, by Distribution Channel 2020 & 2033
- Table 11: Global Champagne Industry Revenue billion Forecast, by Country 2020 & 2033
- Table 12: Global Champagne Industry Volume Million Forecast, by Country 2020 & 2033
- Table 13: United States Champagne Industry Revenue (billion) Forecast, by Application 2020 & 2033
- Table 14: United States Champagne Industry Volume (Million) Forecast, by Application 2020 & 2033
- Table 15: Canada Champagne Industry Revenue (billion) Forecast, by Application 2020 & 2033
- Table 16: Canada Champagne Industry Volume (Million) Forecast, by Application 2020 & 2033
- Table 17: Mexico Champagne Industry Revenue (billion) Forecast, by Application 2020 & 2033
- Table 18: Mexico Champagne Industry Volume (Million) Forecast, by Application 2020 & 2033
- Table 19: Rest of North America Champagne Industry Revenue (billion) Forecast, by Application 2020 & 2033
- Table 20: Rest of North America Champagne Industry Volume (Million) Forecast, by Application 2020 & 2033
- Table 21: Global Champagne Industry Revenue billion Forecast, by Type 2020 & 2033
- Table 22: Global Champagne Industry Volume Million Forecast, by Type 2020 & 2033
- Table 23: Global Champagne Industry Revenue billion Forecast, by Distribution Channel 2020 & 2033
- Table 24: Global Champagne Industry Volume Million Forecast, by Distribution Channel 2020 & 2033
- Table 25: Global Champagne Industry Revenue billion Forecast, by Country 2020 & 2033
- Table 26: Global Champagne Industry Volume Million Forecast, by Country 2020 & 2033
- Table 27: United Kingdom Champagne Industry Revenue (billion) Forecast, by Application 2020 & 2033
- Table 28: United Kingdom Champagne Industry Volume (Million) Forecast, by Application 2020 & 2033
- Table 29: Germany Champagne Industry Revenue (billion) Forecast, by Application 2020 & 2033
- Table 30: Germany Champagne Industry Volume (Million) Forecast, by Application 2020 & 2033
- Table 31: Spain Champagne Industry Revenue (billion) Forecast, by Application 2020 & 2033
- Table 32: Spain Champagne Industry Volume (Million) Forecast, by Application 2020 & 2033
- Table 33: France Champagne Industry Revenue (billion) Forecast, by Application 2020 & 2033
- Table 34: France Champagne Industry Volume (Million) Forecast, by Application 2020 & 2033
- Table 35: Italy Champagne Industry Revenue (billion) Forecast, by Application 2020 & 2033
- Table 36: Italy Champagne Industry Volume (Million) Forecast, by Application 2020 & 2033
- Table 37: Russia Champagne Industry Revenue (billion) Forecast, by Application 2020 & 2033
- Table 38: Russia Champagne Industry Volume (Million) Forecast, by Application 2020 & 2033
- Table 39: Rest of Europe Champagne Industry Revenue (billion) Forecast, by Application 2020 & 2033
- Table 40: Rest of Europe Champagne Industry Volume (Million) Forecast, by Application 2020 & 2033
- Table 41: Global Champagne Industry Revenue billion Forecast, by Type 2020 & 2033
- Table 42: Global Champagne Industry Volume Million Forecast, by Type 2020 & 2033
- Table 43: Global Champagne Industry Revenue billion Forecast, by Distribution Channel 2020 & 2033
- Table 44: Global Champagne Industry Volume Million Forecast, by Distribution Channel 2020 & 2033
- Table 45: Global Champagne Industry Revenue billion Forecast, by Country 2020 & 2033
- Table 46: Global Champagne Industry Volume Million Forecast, by Country 2020 & 2033
- Table 47: China Champagne Industry Revenue (billion) Forecast, by Application 2020 & 2033
- Table 48: China Champagne Industry Volume (Million) Forecast, by Application 2020 & 2033
- Table 49: Japan Champagne Industry Revenue (billion) Forecast, by Application 2020 & 2033
- Table 50: Japan Champagne Industry Volume (Million) Forecast, by Application 2020 & 2033
- Table 51: India Champagne Industry Revenue (billion) Forecast, by Application 2020 & 2033
- Table 52: India Champagne Industry Volume (Million) Forecast, by Application 2020 & 2033
- Table 53: Australia Champagne Industry Revenue (billion) Forecast, by Application 2020 & 2033
- Table 54: Australia Champagne Industry Volume (Million) Forecast, by Application 2020 & 2033
- Table 55: Rest of Asia Pacific Champagne Industry Revenue (billion) Forecast, by Application 2020 & 2033
- Table 56: Rest of Asia Pacific Champagne Industry Volume (Million) Forecast, by Application 2020 & 2033
- Table 57: Global Champagne Industry Revenue billion Forecast, by Type 2020 & 2033
- Table 58: Global Champagne Industry Volume Million Forecast, by Type 2020 & 2033
- Table 59: Global Champagne Industry Revenue billion Forecast, by Distribution Channel 2020 & 2033
- Table 60: Global Champagne Industry Volume Million Forecast, by Distribution Channel 2020 & 2033
- Table 61: Global Champagne Industry Revenue billion Forecast, by Country 2020 & 2033
- Table 62: Global Champagne Industry Volume Million Forecast, by Country 2020 & 2033
- Table 63: Brazil Champagne Industry Revenue (billion) Forecast, by Application 2020 & 2033
- Table 64: Brazil Champagne Industry Volume (Million) Forecast, by Application 2020 & 2033
- Table 65: Argentina Champagne Industry Revenue (billion) Forecast, by Application 2020 & 2033
- Table 66: Argentina Champagne Industry Volume (Million) Forecast, by Application 2020 & 2033
- Table 67: Rest of South America Champagne Industry Revenue (billion) Forecast, by Application 2020 & 2033
- Table 68: Rest of South America Champagne Industry Volume (Million) Forecast, by Application 2020 & 2033
- Table 69: Global Champagne Industry Revenue billion Forecast, by Type 2020 & 2033
- Table 70: Global Champagne Industry Volume Million Forecast, by Type 2020 & 2033
- Table 71: Global Champagne Industry Revenue billion Forecast, by Distribution Channel 2020 & 2033
- Table 72: Global Champagne Industry Volume Million Forecast, by Distribution Channel 2020 & 2033
- Table 73: Global Champagne Industry Revenue billion Forecast, by Country 2020 & 2033
- Table 74: Global Champagne Industry Volume Million Forecast, by Country 2020 & 2033
- Table 75: South Africa Champagne Industry Revenue (billion) Forecast, by Application 2020 & 2033
- Table 76: South Africa Champagne Industry Volume (Million) Forecast, by Application 2020 & 2033
- Table 77: Saudi Arabia Champagne Industry Revenue (billion) Forecast, by Application 2020 & 2033
- Table 78: Saudi Arabia Champagne Industry Volume (Million) Forecast, by Application 2020 & 2033
- Table 79: Rest of Middle East and Africa Champagne Industry Revenue (billion) Forecast, by Application 2020 & 2033
- Table 80: Rest of Middle East and Africa Champagne Industry Volume (Million) Forecast, by Application 2020 & 2033
Frequently Asked Questions
1. What is the projected Compound Annual Growth Rate (CAGR) of the Champagne Industry?
The projected CAGR is approximately 2.3%.
2. Which companies are prominent players in the Champagne Industry?
Key companies in the market include La Marca USA, Champagne AYALA, Andre Champagne Cellars, Champagne Taittinger CCVC, Societe Jacques Bollinger SA, LVMH Moet Hennessy*List Not Exhaustive, Laurent-Perrier Group, Diageo plc, F Korbel & Bros, Cook's Champagne Cellars.
3. What are the main segments of the Champagne Industry?
The market segments include Type, Distribution Channel.
4. Can you provide details about the market size?
The market size is estimated to be USD 6.43 billion as of 2022.
5. What are some drivers contributing to market growth?
Demand for Premium and Super Premium Vodka; Effective Branding and Marketing by Players.
6. What are the notable trends driving market growth?
Online Platform to Increase the Market Growth.
7. Are there any restraints impacting market growth?
Stringent Regulations Pertaining to Vodka; Popularity of Non-alcoholic Beverages.
8. Can you provide examples of recent developments in the market?
October 2022: Societe Jacques Bollinger SA introduced a new limited edition champagne, "Special Cuvee, The Bollinger Style," to celebrate 40 years of partnership with 007. The limited edition gift box features the silhouette of James Bond alongside his Aston Martin DB5.
9. What pricing options are available for accessing the report?
Pricing options include single-user, multi-user, and enterprise licenses priced at USD 4750, USD 5250, and USD 8750 respectively.
10. Is the market size provided in terms of value or volume?
The market size is provided in terms of value, measured in billion and volume, measured in Million.
11. Are there any specific market keywords associated with the report?
Yes, the market keyword associated with the report is "Champagne Industry," which aids in identifying and referencing the specific market segment covered.
12. How do I determine which pricing option suits my needs best?
The pricing options vary based on user requirements and access needs. Individual users may opt for single-user licenses, while businesses requiring broader access may choose multi-user or enterprise licenses for cost-effective access to the report.
13. Are there any additional resources or data provided in the Champagne Industry report?
While the report offers comprehensive insights, it's advisable to review the specific contents or supplementary materials provided to ascertain if additional resources or data are available.
14. How can I stay updated on further developments or reports in the Champagne Industry?
To stay informed about further developments, trends, and reports in the Champagne Industry, consider subscribing to industry newsletters, following relevant companies and organizations, or regularly checking reputable industry news sources and publications.
Methodology
Step 1 - Identification of Relevant Samples Size from Population Database


Step 2 - Approaches for Defining Global Market Size (Value, Volume* & Price*)

Note*: In applicable scenarios
Step 3 - Data Sources
Primary Research
- Web Analytics
- Survey Reports
- Research Institute
- Latest Research Reports
- Opinion Leaders
Secondary Research
- Annual Reports
- White Paper
- Latest Press Release
- Industry Association
- Paid Database
- Investor Presentations

Step 4 - Data Triangulation
Involves using different sources of information in order to increase the validity of a study
These sources are likely to be stakeholders in a program - participants, other researchers, program staff, other community members, and so on.
Then we put all data in single framework & apply various statistical tools to find out the dynamic on the market.
During the analysis stage, feedback from the stakeholder groups would be compared to determine areas of agreement as well as areas of divergence