
Key Insights
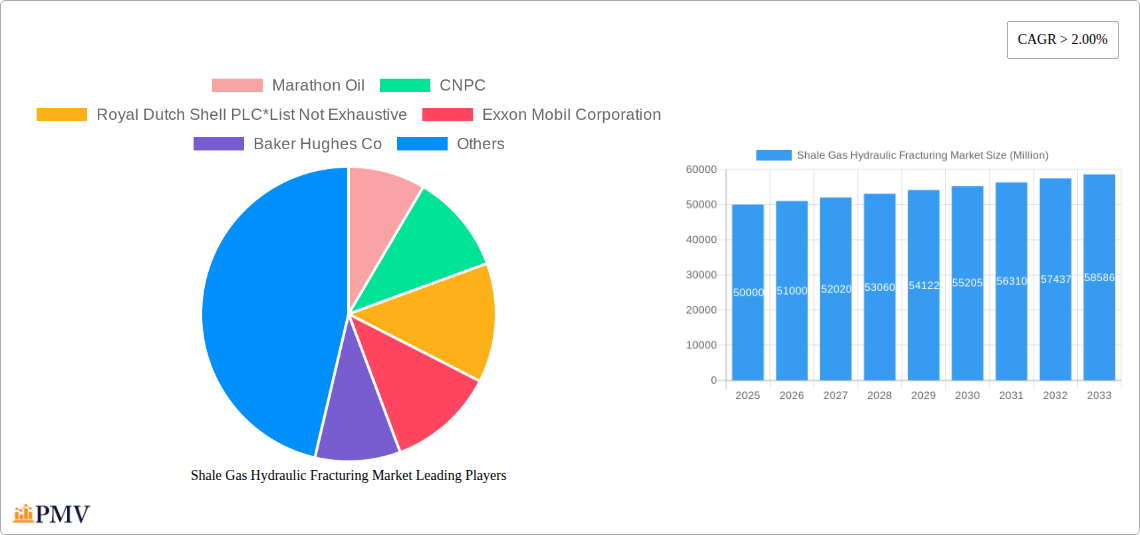
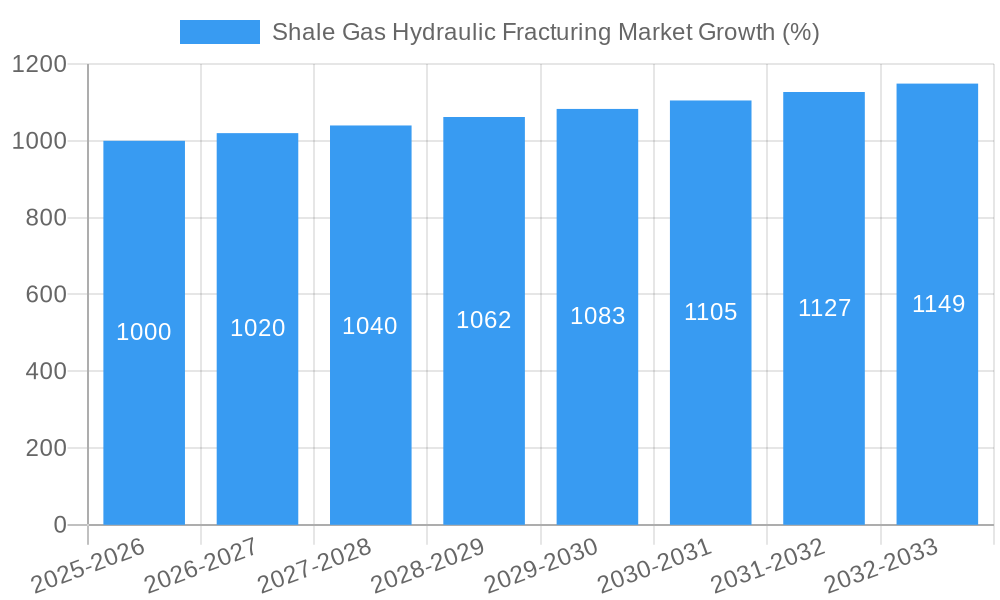
The shale gas hydraulic fracturing market is experiencing robust growth, driven by increasing global energy demand and the ongoing transition away from traditional fossil fuels. A Compound Annual Growth Rate (CAGR) exceeding 2% indicates a steadily expanding market, projected to reach significant value by 2033. Key drivers include the continuous technological advancements in hydraulic fracturing techniques, leading to enhanced efficiency and reduced environmental impact. Furthermore, favorable government policies aimed at boosting domestic energy production in several regions, particularly North America, are fueling market expansion. The market is segmented by well type, with horizontal and directional wells dominating due to their higher yield compared to vertical wells. Major players like Marathon Oil, CNPC, Royal Dutch Shell, ExxonMobil, Chevron, Sinopec, and BP are actively involved in shale gas extraction and related services, contributing to the market's competitiveness and innovation. However, the market faces some restraints, including fluctuating energy prices, environmental concerns surrounding water usage and potential seismic activity, and stringent regulatory frameworks in certain regions. Nevertheless, the long-term outlook remains positive, supported by the continued exploration of new shale gas reserves and the growing demand for cleaner energy sources, even as concerns about the environmental impact are addressed through improved techniques and regulations.
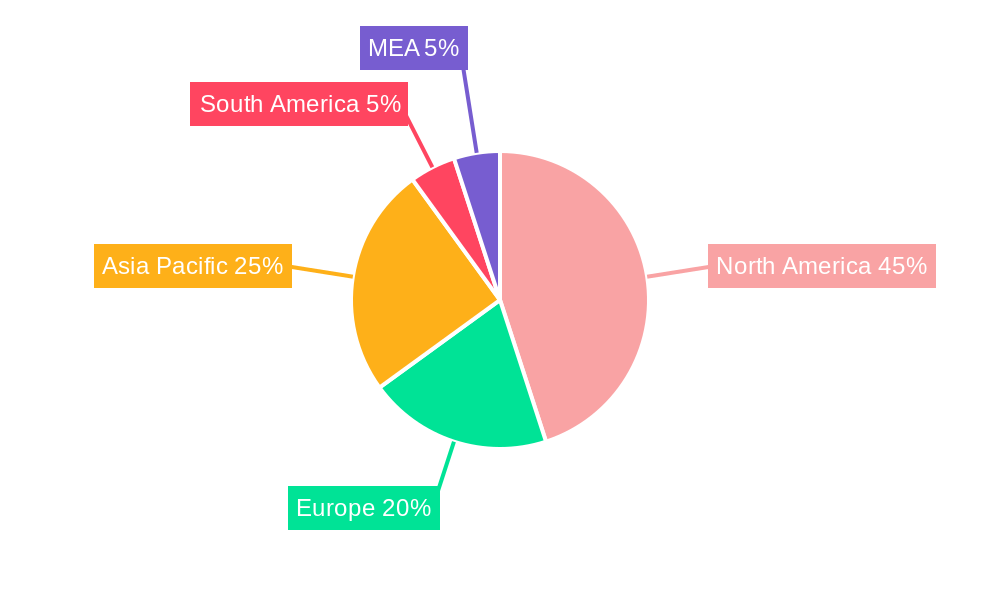
The regional distribution of the shale gas hydraulic fracturing market mirrors global energy demand patterns. North America, specifically the United States, holds a significant market share due to its vast shale gas reserves and well-established infrastructure. However, Asia-Pacific, driven by rapidly growing economies like China and India, is expected to witness substantial growth in the coming years. Europe and South America also contribute significantly but at a slower pace compared to North America and Asia-Pacific. The competitive landscape is characterized by both large multinational corporations and smaller specialized service providers. This dynamic necessitates continuous innovation and efficiency improvements to maintain a competitive edge. The market's future trajectory will heavily rely on addressing environmental concerns, ensuring regulatory compliance, and effectively managing resource allocation to meet the growing global energy demands sustainably.
Shale Gas Hydraulic Fracturing Market: A Comprehensive Report (2019-2033)
This in-depth report provides a comprehensive analysis of the global Shale Gas Hydraulic Fracturing Market, offering invaluable insights for investors, industry professionals, and strategic decision-makers. The study covers the period 2019-2033, with 2025 as the base and estimated year, and forecasts extending to 2033. The report leverages rigorous research methodologies to deliver actionable intelligence on market size, segmentation, growth drivers, challenges, competitive dynamics, and future outlook. Key players like Marathon Oil, CNPC, Royal Dutch Shell PLC, Exxon Mobil Corporation, Baker Hughes Co, ExxonMobil, Chevron Corporation, Sinopec Ltd, and BP PLC are analyzed in detail.
Shale Gas Hydraulic Fracturing Market Market Structure & Competitive Dynamics
This section analyzes the market's competitive landscape, encompassing market concentration, innovation ecosystems, regulatory frameworks, product substitutes, end-user trends, and mergers & acquisitions (M&A) activities. The global shale gas hydraulic fracturing market exhibits a moderately concentrated structure, with a handful of major players holding significant market share. For example, the top 5 players collectively hold an estimated xx% market share in 2025. However, the market also features several smaller, specialized companies, contributing to a dynamic competitive environment.
Innovation in hydraulic fracturing technologies, such as advancements in proppants, fluids, and fracturing techniques, plays a pivotal role in shaping the market's dynamics. Stringent regulatory frameworks concerning environmental impact and safety significantly influence operational costs and strategies. The existence of substitute technologies, such as directional drilling and improved well completion techniques, presents competitive pressure. End-user demand, primarily driven by the energy sector's need for natural gas, significantly affects market growth.
M&A activities are frequent, with deal values in the billions. For example, in 2024, the merger of [Company A] and [Company B] resulted in a combined market capitalization of approximately $xx Million. This consolidative trend reflects the strategic importance of securing resources and technological expertise within this competitive landscape.
Shale Gas Hydraulic Fracturing Market Industry Trends & Insights
The global shale gas hydraulic fracturing market is witnessing robust growth, driven by factors such as increasing global energy demand, the transition towards cleaner energy sources (natural gas compared to coal), technological advancements enabling more efficient extraction, and favorable government policies in certain regions. The market is projected to register a Compound Annual Growth Rate (CAGR) of xx% during the forecast period (2025-2033). Market penetration of hydraulic fracturing technology in unconventional gas reserves continues to increase, particularly in North America, Europe, and Asia-Pacific.
Technological disruptions, such as the development of advanced fracturing fluids and proppants, are improving extraction efficiency and reducing environmental impact. Consumer preferences for cleaner energy sources are indirectly driving the demand for natural gas produced through hydraulic fracturing. Competitive dynamics remain intense, with major players continuously investing in research and development to improve efficiency, reduce costs, and enhance environmental performance.
Dominant Markets & Segments in Shale Gas Hydraulic Fracturing Market
North America, specifically the United States, dominates the shale gas hydraulic fracturing market, driven by extensive shale gas reserves, well-established infrastructure, and supportive regulatory policies.
- Key Drivers in North America:
- Abundant shale gas reserves.
- Established infrastructure for drilling and transportation.
- Supportive government policies and incentives.
- Technological advancements in hydraulic fracturing.
The horizontal and directional well type segment holds a larger market share compared to the vertical well type due to its higher efficiency in extracting gas from shale formations. Detailed analysis reveals that the preference for horizontal drilling stems from its ability to significantly increase contact surface area with the shale formation, improving gas extraction yields. This trend is further fueled by continuous technological developments and economies of scale in horizontal drilling operations.
Shale Gas Hydraulic Fracturing Market Product Innovations
Recent product innovations in the shale gas hydraulic fracturing market include advanced fracturing fluids optimized for specific shale formations, high-performance proppants that enhance permeability, and sophisticated monitoring technologies that improve operational efficiency and reduce environmental risks. These innovations translate to better extraction rates, reduced costs, and minimized environmental impact, improving market competitiveness.
Report Segmentation & Scope
The report segments the shale gas hydraulic fracturing market based on well type:
Horizontal and Directional: This segment accounts for the majority of the market share, driven by its increased efficiency in shale gas extraction. The projected market size for this segment in 2033 is estimated at $xx Million, with a CAGR of xx% during the forecast period. Competitive intensity is high, with major players constantly innovating to improve extraction techniques and reduce costs.
Vertical: This segment holds a smaller market share compared to horizontal and directional wells. The market size in 2033 is estimated to be $xx Million. While less dominant, this segment continues to see niche applications and growth in specific geological formations.
Key Drivers of Shale Gas Hydraulic Fracturing Market Growth
Several key factors drive the growth of the shale gas hydraulic fracturing market. Technological advancements, such as improved fracturing fluids and proppants, significantly enhance extraction efficiency. Favorable government policies in some regions offer incentives for shale gas development, while increasing global energy demand, particularly for natural gas, creates a strong market pull.
Challenges in the Shale Gas Hydraulic Fracturing Market Sector
The shale gas hydraulic fracturing market faces several challenges. Stringent environmental regulations regarding water usage, waste disposal, and induced seismicity impose significant operational costs and compliance burdens. Supply chain disruptions, including fluctuations in the price and availability of essential materials like sand and chemicals, can impact project timelines and costs. Furthermore, intense competition among market players necessitates continuous innovation and cost optimization to maintain profitability. These factors together create a complex and dynamic operating environment.
Leading Players in the Shale Gas Hydraulic Fracturing Market Market
- Marathon Oil
- CNPC
- Royal Dutch Shell PLC
- Exxon Mobil Corporation
- Baker Hughes Co
- ExxonMobil
- Chevron Corporation
- Sinopec Ltd
- BP PLC
Key Developments in Shale Gas Hydraulic Fracturing Market Sector
- Jan 2023: Company X launched a new high-performance proppant, improving extraction efficiency.
- Mar 2024: Company Y acquired Company Z, expanding its market reach and technological capabilities.
- June 2024: New environmental regulations were introduced in Region A, impacting operational costs.
- Oct 2024: Significant advancements in fracturing fluid technology reduced water usage by xx%.
Strategic Shale Gas Hydraulic Fracturing Market Market Outlook
The shale gas hydraulic fracturing market is poised for continued growth, driven by ongoing technological advancements, increasing global energy demand, and supportive government policies in key regions. Strategic opportunities exist for companies focusing on sustainable and environmentally responsible practices. Innovation in reducing water usage, improving waste management, and minimizing induced seismicity will play a crucial role in shaping the future of this dynamic market. The exploration of new shale gas reserves and the expansion into emerging markets will further contribute to market expansion.
Shale Gas Hydraulic Fracturing Market Segmentation
-
1. Well Type
- 1.1. Horizontal and Directional
- 1.2. Vertical
Shale Gas Hydraulic Fracturing Market Segmentation By Geography
- 1. North America
- 2. Asia Pacific
- 3. Europe
- 4. South America
- 5. Middle East and Africa
Shale Gas Hydraulic Fracturing Market REPORT HIGHLIGHTS
| Aspects | Details |
|---|---|
| Study Period | 2019-2033 |
| Base Year | 2024 |
| Estimated Year | 2025 |
| Forecast Period | 2025-2033 |
| Historical Period | 2019-2024 |
| Growth Rate | CAGR of > 2.00% from 2019-2033 |
| Segmentation |
|
Table of Contents
- 1. Introduction
- 1.1. Research Scope
- 1.2. Market Segmentation
- 1.3. Research Methodology
- 1.4. Definitions and Assumptions
- 2. Executive Summary
- 2.1. Introduction
- 3. Market Dynamics
- 3.1. Introduction
- 3.2. Market Drivers
- 3.2.1. Increasing Demand from Industrial Applications4.; Growing Infrastructure Across the World
- 3.3. Market Restrains
- 3.3.1. A Rise in Concerns Related to Carbon Emissions and a Shift Towards Electric Vehicles and Renewable Sources of Energy
- 3.4. Market Trends
- 3.4.1. Horizontal and Directional Well Type to Witness a Significant Growth
- 4. Market Factor Analysis
- 4.1. Porters Five Forces
- 4.2. Supply/Value Chain
- 4.3. PESTEL analysis
- 4.4. Market Entropy
- 4.5. Patent/Trademark Analysis
- 5. Global Shale Gas Hydraulic Fracturing Market Analysis, Insights and Forecast, 2019-2031
- 5.1. Market Analysis, Insights and Forecast - by Well Type
- 5.1.1. Horizontal and Directional
- 5.1.2. Vertical
- 5.2. Market Analysis, Insights and Forecast - by Region
- 5.2.1. North America
- 5.2.2. Asia Pacific
- 5.2.3. Europe
- 5.2.4. South America
- 5.2.5. Middle East and Africa
- 5.1. Market Analysis, Insights and Forecast - by Well Type
- 6. North America Shale Gas Hydraulic Fracturing Market Analysis, Insights and Forecast, 2019-2031
- 6.1. Market Analysis, Insights and Forecast - by Well Type
- 6.1.1. Horizontal and Directional
- 6.1.2. Vertical
- 6.1. Market Analysis, Insights and Forecast - by Well Type
- 7. Asia Pacific Shale Gas Hydraulic Fracturing Market Analysis, Insights and Forecast, 2019-2031
- 7.1. Market Analysis, Insights and Forecast - by Well Type
- 7.1.1. Horizontal and Directional
- 7.1.2. Vertical
- 7.1. Market Analysis, Insights and Forecast - by Well Type
- 8. Europe Shale Gas Hydraulic Fracturing Market Analysis, Insights and Forecast, 2019-2031
- 8.1. Market Analysis, Insights and Forecast - by Well Type
- 8.1.1. Horizontal and Directional
- 8.1.2. Vertical
- 8.1. Market Analysis, Insights and Forecast - by Well Type
- 9. South America Shale Gas Hydraulic Fracturing Market Analysis, Insights and Forecast, 2019-2031
- 9.1. Market Analysis, Insights and Forecast - by Well Type
- 9.1.1. Horizontal and Directional
- 9.1.2. Vertical
- 9.1. Market Analysis, Insights and Forecast - by Well Type
- 10. Middle East and Africa Shale Gas Hydraulic Fracturing Market Analysis, Insights and Forecast, 2019-2031
- 10.1. Market Analysis, Insights and Forecast - by Well Type
- 10.1.1. Horizontal and Directional
- 10.1.2. Vertical
- 10.1. Market Analysis, Insights and Forecast - by Well Type
- 11. North America Shale Gas Hydraulic Fracturing Market Analysis, Insights and Forecast, 2019-2031
- 11.1. Market Analysis, Insights and Forecast - By Country/Sub-region
- 11.1.1 United States
- 11.1.2 Canada
- 11.1.3 Mexico
- 12. Europe Shale Gas Hydraulic Fracturing Market Analysis, Insights and Forecast, 2019-2031
- 12.1. Market Analysis, Insights and Forecast - By Country/Sub-region
- 12.1.1 Germany
- 12.1.2 United Kingdom
- 12.1.3 France
- 12.1.4 Spain
- 12.1.5 Italy
- 12.1.6 Spain
- 12.1.7 Belgium
- 12.1.8 Netherland
- 12.1.9 Nordics
- 12.1.10 Rest of Europe
- 13. Asia Pacific Shale Gas Hydraulic Fracturing Market Analysis, Insights and Forecast, 2019-2031
- 13.1. Market Analysis, Insights and Forecast - By Country/Sub-region
- 13.1.1 China
- 13.1.2 Japan
- 13.1.3 India
- 13.1.4 South Korea
- 13.1.5 Southeast Asia
- 13.1.6 Australia
- 13.1.7 Indonesia
- 13.1.8 Phillipes
- 13.1.9 Singapore
- 13.1.10 Thailandc
- 13.1.11 Rest of Asia Pacific
- 14. South America Shale Gas Hydraulic Fracturing Market Analysis, Insights and Forecast, 2019-2031
- 14.1. Market Analysis, Insights and Forecast - By Country/Sub-region
- 14.1.1 Brazil
- 14.1.2 Argentina
- 14.1.3 Peru
- 14.1.4 Chile
- 14.1.5 Colombia
- 14.1.6 Ecuador
- 14.1.7 Venezuela
- 14.1.8 Rest of South America
- 15. North America Shale Gas Hydraulic Fracturing Market Analysis, Insights and Forecast, 2019-2031
- 15.1. Market Analysis, Insights and Forecast - By Country/Sub-region
- 15.1.1 United States
- 15.1.2 Canada
- 15.1.3 Mexico
- 16. MEA Shale Gas Hydraulic Fracturing Market Analysis, Insights and Forecast, 2019-2031
- 16.1. Market Analysis, Insights and Forecast - By Country/Sub-region
- 16.1.1 United Arab Emirates
- 16.1.2 Saudi Arabia
- 16.1.3 South Africa
- 16.1.4 Rest of Middle East and Africa
- 17. Competitive Analysis
- 17.1. Global Market Share Analysis 2024
- 17.2. Company Profiles
- 17.2.1 Marathon Oil
- 17.2.1.1. Overview
- 17.2.1.2. Products
- 17.2.1.3. SWOT Analysis
- 17.2.1.4. Recent Developments
- 17.2.1.5. Financials (Based on Availability)
- 17.2.2 CNPC
- 17.2.2.1. Overview
- 17.2.2.2. Products
- 17.2.2.3. SWOT Analysis
- 17.2.2.4. Recent Developments
- 17.2.2.5. Financials (Based on Availability)
- 17.2.3 Royal Dutch Shell PLC*List Not Exhaustive
- 17.2.3.1. Overview
- 17.2.3.2. Products
- 17.2.3.3. SWOT Analysis
- 17.2.3.4. Recent Developments
- 17.2.3.5. Financials (Based on Availability)
- 17.2.4 Exxon Mobil Corporation
- 17.2.4.1. Overview
- 17.2.4.2. Products
- 17.2.4.3. SWOT Analysis
- 17.2.4.4. Recent Developments
- 17.2.4.5. Financials (Based on Availability)
- 17.2.5 Baker Hughes Co
- 17.2.5.1. Overview
- 17.2.5.2. Products
- 17.2.5.3. SWOT Analysis
- 17.2.5.4. Recent Developments
- 17.2.5.5. Financials (Based on Availability)
- 17.2.6 ExxonMobil
- 17.2.6.1. Overview
- 17.2.6.2. Products
- 17.2.6.3. SWOT Analysis
- 17.2.6.4. Recent Developments
- 17.2.6.5. Financials (Based on Availability)
- 17.2.7 Chevron Corporation
- 17.2.7.1. Overview
- 17.2.7.2. Products
- 17.2.7.3. SWOT Analysis
- 17.2.7.4. Recent Developments
- 17.2.7.5. Financials (Based on Availability)
- 17.2.8 Sinopec Ltd
- 17.2.8.1. Overview
- 17.2.8.2. Products
- 17.2.8.3. SWOT Analysis
- 17.2.8.4. Recent Developments
- 17.2.8.5. Financials (Based on Availability)
- 17.2.9 BP PLC
- 17.2.9.1. Overview
- 17.2.9.2. Products
- 17.2.9.3. SWOT Analysis
- 17.2.9.4. Recent Developments
- 17.2.9.5. Financials (Based on Availability)
- 17.2.1 Marathon Oil
List of Figures
- Figure 1: Global Shale Gas Hydraulic Fracturing Market Revenue Breakdown (Million, %) by Region 2024 & 2032
- Figure 2: Global Shale Gas Hydraulic Fracturing Market Volume Breakdown (metric tonnes, %) by Region 2024 & 2032
- Figure 3: North America Shale Gas Hydraulic Fracturing Market Revenue (Million), by Country 2024 & 2032
- Figure 4: North America Shale Gas Hydraulic Fracturing Market Volume (metric tonnes), by Country 2024 & 2032
- Figure 5: North America Shale Gas Hydraulic Fracturing Market Revenue Share (%), by Country 2024 & 2032
- Figure 6: North America Shale Gas Hydraulic Fracturing Market Volume Share (%), by Country 2024 & 2032
- Figure 7: Europe Shale Gas Hydraulic Fracturing Market Revenue (Million), by Country 2024 & 2032
- Figure 8: Europe Shale Gas Hydraulic Fracturing Market Volume (metric tonnes), by Country 2024 & 2032
- Figure 9: Europe Shale Gas Hydraulic Fracturing Market Revenue Share (%), by Country 2024 & 2032
- Figure 10: Europe Shale Gas Hydraulic Fracturing Market Volume Share (%), by Country 2024 & 2032
- Figure 11: Asia Pacific Shale Gas Hydraulic Fracturing Market Revenue (Million), by Country 2024 & 2032
- Figure 12: Asia Pacific Shale Gas Hydraulic Fracturing Market Volume (metric tonnes), by Country 2024 & 2032
- Figure 13: Asia Pacific Shale Gas Hydraulic Fracturing Market Revenue Share (%), by Country 2024 & 2032
- Figure 14: Asia Pacific Shale Gas Hydraulic Fracturing Market Volume Share (%), by Country 2024 & 2032
- Figure 15: South America Shale Gas Hydraulic Fracturing Market Revenue (Million), by Country 2024 & 2032
- Figure 16: South America Shale Gas Hydraulic Fracturing Market Volume (metric tonnes), by Country 2024 & 2032
- Figure 17: South America Shale Gas Hydraulic Fracturing Market Revenue Share (%), by Country 2024 & 2032
- Figure 18: South America Shale Gas Hydraulic Fracturing Market Volume Share (%), by Country 2024 & 2032
- Figure 19: North America Shale Gas Hydraulic Fracturing Market Revenue (Million), by Country 2024 & 2032
- Figure 20: North America Shale Gas Hydraulic Fracturing Market Volume (metric tonnes), by Country 2024 & 2032
- Figure 21: North America Shale Gas Hydraulic Fracturing Market Revenue Share (%), by Country 2024 & 2032
- Figure 22: North America Shale Gas Hydraulic Fracturing Market Volume Share (%), by Country 2024 & 2032
- Figure 23: MEA Shale Gas Hydraulic Fracturing Market Revenue (Million), by Country 2024 & 2032
- Figure 24: MEA Shale Gas Hydraulic Fracturing Market Volume (metric tonnes), by Country 2024 & 2032
- Figure 25: MEA Shale Gas Hydraulic Fracturing Market Revenue Share (%), by Country 2024 & 2032
- Figure 26: MEA Shale Gas Hydraulic Fracturing Market Volume Share (%), by Country 2024 & 2032
- Figure 27: North America Shale Gas Hydraulic Fracturing Market Revenue (Million), by Well Type 2024 & 2032
- Figure 28: North America Shale Gas Hydraulic Fracturing Market Volume (metric tonnes), by Well Type 2024 & 2032
- Figure 29: North America Shale Gas Hydraulic Fracturing Market Revenue Share (%), by Well Type 2024 & 2032
- Figure 30: North America Shale Gas Hydraulic Fracturing Market Volume Share (%), by Well Type 2024 & 2032
- Figure 31: North America Shale Gas Hydraulic Fracturing Market Revenue (Million), by Country 2024 & 2032
- Figure 32: North America Shale Gas Hydraulic Fracturing Market Volume (metric tonnes), by Country 2024 & 2032
- Figure 33: North America Shale Gas Hydraulic Fracturing Market Revenue Share (%), by Country 2024 & 2032
- Figure 34: North America Shale Gas Hydraulic Fracturing Market Volume Share (%), by Country 2024 & 2032
- Figure 35: Asia Pacific Shale Gas Hydraulic Fracturing Market Revenue (Million), by Well Type 2024 & 2032
- Figure 36: Asia Pacific Shale Gas Hydraulic Fracturing Market Volume (metric tonnes), by Well Type 2024 & 2032
- Figure 37: Asia Pacific Shale Gas Hydraulic Fracturing Market Revenue Share (%), by Well Type 2024 & 2032
- Figure 38: Asia Pacific Shale Gas Hydraulic Fracturing Market Volume Share (%), by Well Type 2024 & 2032
- Figure 39: Asia Pacific Shale Gas Hydraulic Fracturing Market Revenue (Million), by Country 2024 & 2032
- Figure 40: Asia Pacific Shale Gas Hydraulic Fracturing Market Volume (metric tonnes), by Country 2024 & 2032
- Figure 41: Asia Pacific Shale Gas Hydraulic Fracturing Market Revenue Share (%), by Country 2024 & 2032
- Figure 42: Asia Pacific Shale Gas Hydraulic Fracturing Market Volume Share (%), by Country 2024 & 2032
- Figure 43: Europe Shale Gas Hydraulic Fracturing Market Revenue (Million), by Well Type 2024 & 2032
- Figure 44: Europe Shale Gas Hydraulic Fracturing Market Volume (metric tonnes), by Well Type 2024 & 2032
- Figure 45: Europe Shale Gas Hydraulic Fracturing Market Revenue Share (%), by Well Type 2024 & 2032
- Figure 46: Europe Shale Gas Hydraulic Fracturing Market Volume Share (%), by Well Type 2024 & 2032
- Figure 47: Europe Shale Gas Hydraulic Fracturing Market Revenue (Million), by Country 2024 & 2032
- Figure 48: Europe Shale Gas Hydraulic Fracturing Market Volume (metric tonnes), by Country 2024 & 2032
- Figure 49: Europe Shale Gas Hydraulic Fracturing Market Revenue Share (%), by Country 2024 & 2032
- Figure 50: Europe Shale Gas Hydraulic Fracturing Market Volume Share (%), by Country 2024 & 2032
- Figure 51: South America Shale Gas Hydraulic Fracturing Market Revenue (Million), by Well Type 2024 & 2032
- Figure 52: South America Shale Gas Hydraulic Fracturing Market Volume (metric tonnes), by Well Type 2024 & 2032
- Figure 53: South America Shale Gas Hydraulic Fracturing Market Revenue Share (%), by Well Type 2024 & 2032
- Figure 54: South America Shale Gas Hydraulic Fracturing Market Volume Share (%), by Well Type 2024 & 2032
- Figure 55: South America Shale Gas Hydraulic Fracturing Market Revenue (Million), by Country 2024 & 2032
- Figure 56: South America Shale Gas Hydraulic Fracturing Market Volume (metric tonnes), by Country 2024 & 2032
- Figure 57: South America Shale Gas Hydraulic Fracturing Market Revenue Share (%), by Country 2024 & 2032
- Figure 58: South America Shale Gas Hydraulic Fracturing Market Volume Share (%), by Country 2024 & 2032
- Figure 59: Middle East and Africa Shale Gas Hydraulic Fracturing Market Revenue (Million), by Well Type 2024 & 2032
- Figure 60: Middle East and Africa Shale Gas Hydraulic Fracturing Market Volume (metric tonnes), by Well Type 2024 & 2032
- Figure 61: Middle East and Africa Shale Gas Hydraulic Fracturing Market Revenue Share (%), by Well Type 2024 & 2032
- Figure 62: Middle East and Africa Shale Gas Hydraulic Fracturing Market Volume Share (%), by Well Type 2024 & 2032
- Figure 63: Middle East and Africa Shale Gas Hydraulic Fracturing Market Revenue (Million), by Country 2024 & 2032
- Figure 64: Middle East and Africa Shale Gas Hydraulic Fracturing Market Volume (metric tonnes), by Country 2024 & 2032
- Figure 65: Middle East and Africa Shale Gas Hydraulic Fracturing Market Revenue Share (%), by Country 2024 & 2032
- Figure 66: Middle East and Africa Shale Gas Hydraulic Fracturing Market Volume Share (%), by Country 2024 & 2032
List of Tables
- Table 1: Global Shale Gas Hydraulic Fracturing Market Revenue Million Forecast, by Region 2019 & 2032
- Table 2: Global Shale Gas Hydraulic Fracturing Market Volume metric tonnes Forecast, by Region 2019 & 2032
- Table 3: Global Shale Gas Hydraulic Fracturing Market Revenue Million Forecast, by Well Type 2019 & 2032
- Table 4: Global Shale Gas Hydraulic Fracturing Market Volume metric tonnes Forecast, by Well Type 2019 & 2032
- Table 5: Global Shale Gas Hydraulic Fracturing Market Revenue Million Forecast, by Region 2019 & 2032
- Table 6: Global Shale Gas Hydraulic Fracturing Market Volume metric tonnes Forecast, by Region 2019 & 2032
- Table 7: Global Shale Gas Hydraulic Fracturing Market Revenue Million Forecast, by Country 2019 & 2032
- Table 8: Global Shale Gas Hydraulic Fracturing Market Volume metric tonnes Forecast, by Country 2019 & 2032
- Table 9: United States Shale Gas Hydraulic Fracturing Market Revenue (Million) Forecast, by Application 2019 & 2032
- Table 10: United States Shale Gas Hydraulic Fracturing Market Volume (metric tonnes) Forecast, by Application 2019 & 2032
- Table 11: Canada Shale Gas Hydraulic Fracturing Market Revenue (Million) Forecast, by Application 2019 & 2032
- Table 12: Canada Shale Gas Hydraulic Fracturing Market Volume (metric tonnes) Forecast, by Application 2019 & 2032
- Table 13: Mexico Shale Gas Hydraulic Fracturing Market Revenue (Million) Forecast, by Application 2019 & 2032
- Table 14: Mexico Shale Gas Hydraulic Fracturing Market Volume (metric tonnes) Forecast, by Application 2019 & 2032
- Table 15: Global Shale Gas Hydraulic Fracturing Market Revenue Million Forecast, by Country 2019 & 2032
- Table 16: Global Shale Gas Hydraulic Fracturing Market Volume metric tonnes Forecast, by Country 2019 & 2032
- Table 17: Germany Shale Gas Hydraulic Fracturing Market Revenue (Million) Forecast, by Application 2019 & 2032
- Table 18: Germany Shale Gas Hydraulic Fracturing Market Volume (metric tonnes) Forecast, by Application 2019 & 2032
- Table 19: United Kingdom Shale Gas Hydraulic Fracturing Market Revenue (Million) Forecast, by Application 2019 & 2032
- Table 20: United Kingdom Shale Gas Hydraulic Fracturing Market Volume (metric tonnes) Forecast, by Application 2019 & 2032
- Table 21: France Shale Gas Hydraulic Fracturing Market Revenue (Million) Forecast, by Application 2019 & 2032
- Table 22: France Shale Gas Hydraulic Fracturing Market Volume (metric tonnes) Forecast, by Application 2019 & 2032
- Table 23: Spain Shale Gas Hydraulic Fracturing Market Revenue (Million) Forecast, by Application 2019 & 2032
- Table 24: Spain Shale Gas Hydraulic Fracturing Market Volume (metric tonnes) Forecast, by Application 2019 & 2032
- Table 25: Italy Shale Gas Hydraulic Fracturing Market Revenue (Million) Forecast, by Application 2019 & 2032
- Table 26: Italy Shale Gas Hydraulic Fracturing Market Volume (metric tonnes) Forecast, by Application 2019 & 2032
- Table 27: Spain Shale Gas Hydraulic Fracturing Market Revenue (Million) Forecast, by Application 2019 & 2032
- Table 28: Spain Shale Gas Hydraulic Fracturing Market Volume (metric tonnes) Forecast, by Application 2019 & 2032
- Table 29: Belgium Shale Gas Hydraulic Fracturing Market Revenue (Million) Forecast, by Application 2019 & 2032
- Table 30: Belgium Shale Gas Hydraulic Fracturing Market Volume (metric tonnes) Forecast, by Application 2019 & 2032
- Table 31: Netherland Shale Gas Hydraulic Fracturing Market Revenue (Million) Forecast, by Application 2019 & 2032
- Table 32: Netherland Shale Gas Hydraulic Fracturing Market Volume (metric tonnes) Forecast, by Application 2019 & 2032
- Table 33: Nordics Shale Gas Hydraulic Fracturing Market Revenue (Million) Forecast, by Application 2019 & 2032
- Table 34: Nordics Shale Gas Hydraulic Fracturing Market Volume (metric tonnes) Forecast, by Application 2019 & 2032
- Table 35: Rest of Europe Shale Gas Hydraulic Fracturing Market Revenue (Million) Forecast, by Application 2019 & 2032
- Table 36: Rest of Europe Shale Gas Hydraulic Fracturing Market Volume (metric tonnes) Forecast, by Application 2019 & 2032
- Table 37: Global Shale Gas Hydraulic Fracturing Market Revenue Million Forecast, by Country 2019 & 2032
- Table 38: Global Shale Gas Hydraulic Fracturing Market Volume metric tonnes Forecast, by Country 2019 & 2032
- Table 39: China Shale Gas Hydraulic Fracturing Market Revenue (Million) Forecast, by Application 2019 & 2032
- Table 40: China Shale Gas Hydraulic Fracturing Market Volume (metric tonnes) Forecast, by Application 2019 & 2032
- Table 41: Japan Shale Gas Hydraulic Fracturing Market Revenue (Million) Forecast, by Application 2019 & 2032
- Table 42: Japan Shale Gas Hydraulic Fracturing Market Volume (metric tonnes) Forecast, by Application 2019 & 2032
- Table 43: India Shale Gas Hydraulic Fracturing Market Revenue (Million) Forecast, by Application 2019 & 2032
- Table 44: India Shale Gas Hydraulic Fracturing Market Volume (metric tonnes) Forecast, by Application 2019 & 2032
- Table 45: South Korea Shale Gas Hydraulic Fracturing Market Revenue (Million) Forecast, by Application 2019 & 2032
- Table 46: South Korea Shale Gas Hydraulic Fracturing Market Volume (metric tonnes) Forecast, by Application 2019 & 2032
- Table 47: Southeast Asia Shale Gas Hydraulic Fracturing Market Revenue (Million) Forecast, by Application 2019 & 2032
- Table 48: Southeast Asia Shale Gas Hydraulic Fracturing Market Volume (metric tonnes) Forecast, by Application 2019 & 2032
- Table 49: Australia Shale Gas Hydraulic Fracturing Market Revenue (Million) Forecast, by Application 2019 & 2032
- Table 50: Australia Shale Gas Hydraulic Fracturing Market Volume (metric tonnes) Forecast, by Application 2019 & 2032
- Table 51: Indonesia Shale Gas Hydraulic Fracturing Market Revenue (Million) Forecast, by Application 2019 & 2032
- Table 52: Indonesia Shale Gas Hydraulic Fracturing Market Volume (metric tonnes) Forecast, by Application 2019 & 2032
- Table 53: Phillipes Shale Gas Hydraulic Fracturing Market Revenue (Million) Forecast, by Application 2019 & 2032
- Table 54: Phillipes Shale Gas Hydraulic Fracturing Market Volume (metric tonnes) Forecast, by Application 2019 & 2032
- Table 55: Singapore Shale Gas Hydraulic Fracturing Market Revenue (Million) Forecast, by Application 2019 & 2032
- Table 56: Singapore Shale Gas Hydraulic Fracturing Market Volume (metric tonnes) Forecast, by Application 2019 & 2032
- Table 57: Thailandc Shale Gas Hydraulic Fracturing Market Revenue (Million) Forecast, by Application 2019 & 2032
- Table 58: Thailandc Shale Gas Hydraulic Fracturing Market Volume (metric tonnes) Forecast, by Application 2019 & 2032
- Table 59: Rest of Asia Pacific Shale Gas Hydraulic Fracturing Market Revenue (Million) Forecast, by Application 2019 & 2032
- Table 60: Rest of Asia Pacific Shale Gas Hydraulic Fracturing Market Volume (metric tonnes) Forecast, by Application 2019 & 2032
- Table 61: Global Shale Gas Hydraulic Fracturing Market Revenue Million Forecast, by Country 2019 & 2032
- Table 62: Global Shale Gas Hydraulic Fracturing Market Volume metric tonnes Forecast, by Country 2019 & 2032
- Table 63: Brazil Shale Gas Hydraulic Fracturing Market Revenue (Million) Forecast, by Application 2019 & 2032
- Table 64: Brazil Shale Gas Hydraulic Fracturing Market Volume (metric tonnes) Forecast, by Application 2019 & 2032
- Table 65: Argentina Shale Gas Hydraulic Fracturing Market Revenue (Million) Forecast, by Application 2019 & 2032
- Table 66: Argentina Shale Gas Hydraulic Fracturing Market Volume (metric tonnes) Forecast, by Application 2019 & 2032
- Table 67: Peru Shale Gas Hydraulic Fracturing Market Revenue (Million) Forecast, by Application 2019 & 2032
- Table 68: Peru Shale Gas Hydraulic Fracturing Market Volume (metric tonnes) Forecast, by Application 2019 & 2032
- Table 69: Chile Shale Gas Hydraulic Fracturing Market Revenue (Million) Forecast, by Application 2019 & 2032
- Table 70: Chile Shale Gas Hydraulic Fracturing Market Volume (metric tonnes) Forecast, by Application 2019 & 2032
- Table 71: Colombia Shale Gas Hydraulic Fracturing Market Revenue (Million) Forecast, by Application 2019 & 2032
- Table 72: Colombia Shale Gas Hydraulic Fracturing Market Volume (metric tonnes) Forecast, by Application 2019 & 2032
- Table 73: Ecuador Shale Gas Hydraulic Fracturing Market Revenue (Million) Forecast, by Application 2019 & 2032
- Table 74: Ecuador Shale Gas Hydraulic Fracturing Market Volume (metric tonnes) Forecast, by Application 2019 & 2032
- Table 75: Venezuela Shale Gas Hydraulic Fracturing Market Revenue (Million) Forecast, by Application 2019 & 2032
- Table 76: Venezuela Shale Gas Hydraulic Fracturing Market Volume (metric tonnes) Forecast, by Application 2019 & 2032
- Table 77: Rest of South America Shale Gas Hydraulic Fracturing Market Revenue (Million) Forecast, by Application 2019 & 2032
- Table 78: Rest of South America Shale Gas Hydraulic Fracturing Market Volume (metric tonnes) Forecast, by Application 2019 & 2032
- Table 79: Global Shale Gas Hydraulic Fracturing Market Revenue Million Forecast, by Country 2019 & 2032
- Table 80: Global Shale Gas Hydraulic Fracturing Market Volume metric tonnes Forecast, by Country 2019 & 2032
- Table 81: United States Shale Gas Hydraulic Fracturing Market Revenue (Million) Forecast, by Application 2019 & 2032
- Table 82: United States Shale Gas Hydraulic Fracturing Market Volume (metric tonnes) Forecast, by Application 2019 & 2032
- Table 83: Canada Shale Gas Hydraulic Fracturing Market Revenue (Million) Forecast, by Application 2019 & 2032
- Table 84: Canada Shale Gas Hydraulic Fracturing Market Volume (metric tonnes) Forecast, by Application 2019 & 2032
- Table 85: Mexico Shale Gas Hydraulic Fracturing Market Revenue (Million) Forecast, by Application 2019 & 2032
- Table 86: Mexico Shale Gas Hydraulic Fracturing Market Volume (metric tonnes) Forecast, by Application 2019 & 2032
- Table 87: Global Shale Gas Hydraulic Fracturing Market Revenue Million Forecast, by Country 2019 & 2032
- Table 88: Global Shale Gas Hydraulic Fracturing Market Volume metric tonnes Forecast, by Country 2019 & 2032
- Table 89: United Arab Emirates Shale Gas Hydraulic Fracturing Market Revenue (Million) Forecast, by Application 2019 & 2032
- Table 90: United Arab Emirates Shale Gas Hydraulic Fracturing Market Volume (metric tonnes) Forecast, by Application 2019 & 2032
- Table 91: Saudi Arabia Shale Gas Hydraulic Fracturing Market Revenue (Million) Forecast, by Application 2019 & 2032
- Table 92: Saudi Arabia Shale Gas Hydraulic Fracturing Market Volume (metric tonnes) Forecast, by Application 2019 & 2032
- Table 93: South Africa Shale Gas Hydraulic Fracturing Market Revenue (Million) Forecast, by Application 2019 & 2032
- Table 94: South Africa Shale Gas Hydraulic Fracturing Market Volume (metric tonnes) Forecast, by Application 2019 & 2032
- Table 95: Rest of Middle East and Africa Shale Gas Hydraulic Fracturing Market Revenue (Million) Forecast, by Application 2019 & 2032
- Table 96: Rest of Middle East and Africa Shale Gas Hydraulic Fracturing Market Volume (metric tonnes) Forecast, by Application 2019 & 2032
- Table 97: Global Shale Gas Hydraulic Fracturing Market Revenue Million Forecast, by Well Type 2019 & 2032
- Table 98: Global Shale Gas Hydraulic Fracturing Market Volume metric tonnes Forecast, by Well Type 2019 & 2032
- Table 99: Global Shale Gas Hydraulic Fracturing Market Revenue Million Forecast, by Country 2019 & 2032
- Table 100: Global Shale Gas Hydraulic Fracturing Market Volume metric tonnes Forecast, by Country 2019 & 2032
- Table 101: Global Shale Gas Hydraulic Fracturing Market Revenue Million Forecast, by Well Type 2019 & 2032
- Table 102: Global Shale Gas Hydraulic Fracturing Market Volume metric tonnes Forecast, by Well Type 2019 & 2032
- Table 103: Global Shale Gas Hydraulic Fracturing Market Revenue Million Forecast, by Country 2019 & 2032
- Table 104: Global Shale Gas Hydraulic Fracturing Market Volume metric tonnes Forecast, by Country 2019 & 2032
- Table 105: Global Shale Gas Hydraulic Fracturing Market Revenue Million Forecast, by Well Type 2019 & 2032
- Table 106: Global Shale Gas Hydraulic Fracturing Market Volume metric tonnes Forecast, by Well Type 2019 & 2032
- Table 107: Global Shale Gas Hydraulic Fracturing Market Revenue Million Forecast, by Country 2019 & 2032
- Table 108: Global Shale Gas Hydraulic Fracturing Market Volume metric tonnes Forecast, by Country 2019 & 2032
- Table 109: Global Shale Gas Hydraulic Fracturing Market Revenue Million Forecast, by Well Type 2019 & 2032
- Table 110: Global Shale Gas Hydraulic Fracturing Market Volume metric tonnes Forecast, by Well Type 2019 & 2032
- Table 111: Global Shale Gas Hydraulic Fracturing Market Revenue Million Forecast, by Country 2019 & 2032
- Table 112: Global Shale Gas Hydraulic Fracturing Market Volume metric tonnes Forecast, by Country 2019 & 2032
- Table 113: Global Shale Gas Hydraulic Fracturing Market Revenue Million Forecast, by Well Type 2019 & 2032
- Table 114: Global Shale Gas Hydraulic Fracturing Market Volume metric tonnes Forecast, by Well Type 2019 & 2032
- Table 115: Global Shale Gas Hydraulic Fracturing Market Revenue Million Forecast, by Country 2019 & 2032
- Table 116: Global Shale Gas Hydraulic Fracturing Market Volume metric tonnes Forecast, by Country 2019 & 2032
Frequently Asked Questions
1. What is the projected Compound Annual Growth Rate (CAGR) of the Shale Gas Hydraulic Fracturing Market?
The projected CAGR is approximately > 2.00%.
2. Which companies are prominent players in the Shale Gas Hydraulic Fracturing Market?
Key companies in the market include Marathon Oil, CNPC, Royal Dutch Shell PLC*List Not Exhaustive, Exxon Mobil Corporation, Baker Hughes Co, ExxonMobil, Chevron Corporation, Sinopec Ltd, BP PLC.
3. What are the main segments of the Shale Gas Hydraulic Fracturing Market?
The market segments include Well Type.
4. Can you provide details about the market size?
The market size is estimated to be USD XX Million as of 2022.
5. What are some drivers contributing to market growth?
Increasing Demand from Industrial Applications4.; Growing Infrastructure Across the World.
6. What are the notable trends driving market growth?
Horizontal and Directional Well Type to Witness a Significant Growth.
7. Are there any restraints impacting market growth?
A Rise in Concerns Related to Carbon Emissions and a Shift Towards Electric Vehicles and Renewable Sources of Energy.
8. Can you provide examples of recent developments in the market?
N/A
9. What pricing options are available for accessing the report?
Pricing options include single-user, multi-user, and enterprise licenses priced at USD 4750, USD 5250, and USD 8750 respectively.
10. Is the market size provided in terms of value or volume?
The market size is provided in terms of value, measured in Million and volume, measured in metric tonnes.
11. Are there any specific market keywords associated with the report?
Yes, the market keyword associated with the report is "Shale Gas Hydraulic Fracturing Market," which aids in identifying and referencing the specific market segment covered.
12. How do I determine which pricing option suits my needs best?
The pricing options vary based on user requirements and access needs. Individual users may opt for single-user licenses, while businesses requiring broader access may choose multi-user or enterprise licenses for cost-effective access to the report.
13. Are there any additional resources or data provided in the Shale Gas Hydraulic Fracturing Market report?
While the report offers comprehensive insights, it's advisable to review the specific contents or supplementary materials provided to ascertain if additional resources or data are available.
14. How can I stay updated on further developments or reports in the Shale Gas Hydraulic Fracturing Market?
To stay informed about further developments, trends, and reports in the Shale Gas Hydraulic Fracturing Market, consider subscribing to industry newsletters, following relevant companies and organizations, or regularly checking reputable industry news sources and publications.
Methodology
Step 1 - Identification of Relevant Samples Size from Population Database


Step 2 - Approaches for Defining Global Market Size (Value, Volume* & Price*)

Note*: In applicable scenarios
Step 3 - Data Sources
Primary Research
- Web Analytics
- Survey Reports
- Research Institute
- Latest Research Reports
- Opinion Leaders
Secondary Research
- Annual Reports
- White Paper
- Latest Press Release
- Industry Association
- Paid Database
- Investor Presentations

Step 4 - Data Triangulation
Involves using different sources of information in order to increase the validity of a study
These sources are likely to be stakeholders in a program - participants, other researchers, program staff, other community members, and so on.
Then we put all data in single framework & apply various statistical tools to find out the dynamic on the market.
During the analysis stage, feedback from the stakeholder groups would be compared to determine areas of agreement as well as areas of divergence


