Key Insights
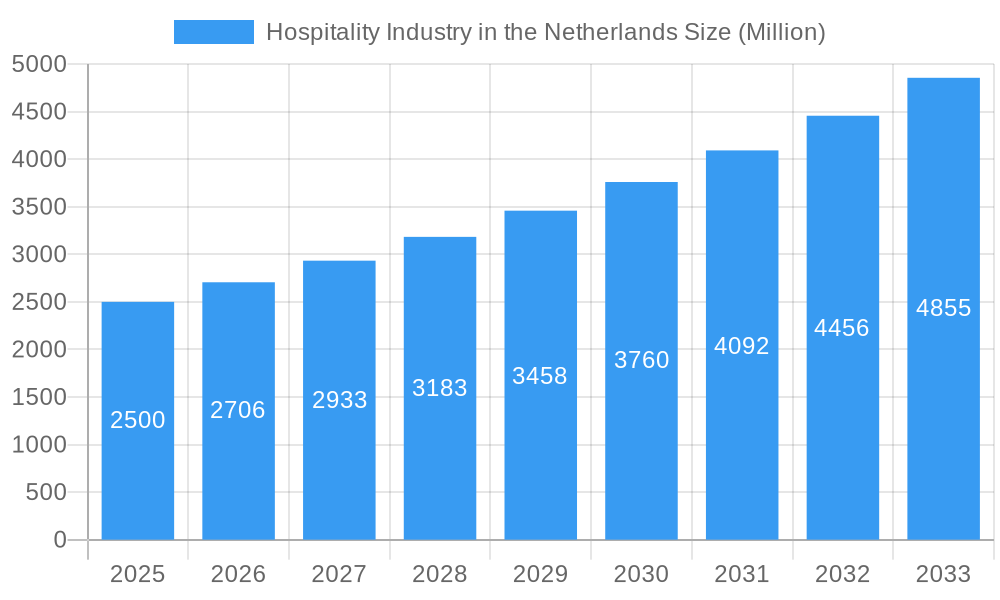
The Netherlands hospitality sector is poised for substantial expansion, with a projected CAGR of 3.5%. The market was valued at €3.95 billion in the base year 2025 and is expected to witness sustained growth driven by robust international tourism, increasing business travel, and a rising demand for unique, experiential accommodations. Key growth drivers include the Netherlands' rich cultural heritage, strategic European location, and a dynamic economy. The market is segmented by hotel type (chain vs. independent) and class (budget, mid-scale, luxury). The competitive landscape features prominent international brands such as Hilton, Accor, and Marriott, alongside strong domestic players like Bastion Hotel Group and Van der Valk. Customer loyalty programs are a critical component of market strategy for both acquisition and retention.
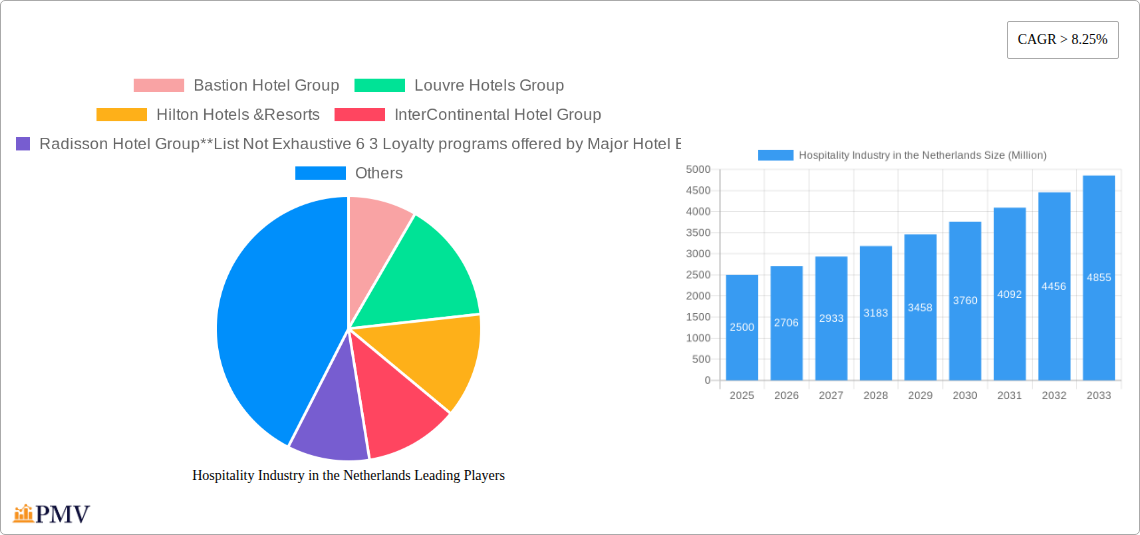
Hospitality Industry in the Netherlands Market Size (In Billion)
Despite a positive growth trajectory, the industry faces challenges including rising operational costs, potential global economic instability impacting tourism, and the imperative to embrace sustainability and technological advancements. The forecast period (2025-2033) anticipates continued market expansion, albeit at a potentially moderated pace as the sector matures. Strategic cost management and adaptability to evolving consumer preferences will be paramount for sustained success in this competitive environment.
Hospitality Industry in the Netherlands Company Market Share
Netherlands Hospitality Market Analysis: Size, Growth, and Forecast (2025-2033)
This comprehensive report analyzes the Netherlands hospitality market, detailing its structure, competitive landscape, key trends, and future growth prospects. The base year for analysis is 2025, with the forecast period extending to 2033. The market, valued at an estimated €3.95 billion in 2025, presents significant opportunities for stakeholders. This report provides critical insights for industry professionals, investors, and decision-makers navigating this dynamic market.
Hospitality Industry in the Netherlands Market Structure & Competitive Dynamics
The Netherlands hospitality market exhibits a moderately concentrated structure, with a handful of major players dominating alongside numerous smaller, independent hotels. Market share data for 2024 suggests that the top five players (including AccorHotels, Marriott International, Hilton Hotels & Resorts, InterContinental Hotel Group, and Radisson Hotel Group) collectively hold approximately 45% of the market. This leaves significant room for smaller chains and independent hotels, particularly in niche segments.
- Market Concentration: High concentration in the luxury and chain hotel segments; fragmented market in the budget and independent hotel segments.
- Innovation Ecosystems: Active participation in sustainable tourism initiatives and technological adoption.
- Regulatory Frameworks: Stringent regulations on environmental sustainability and accessibility are shaping industry practices.
- Product Substitutes: The rise of Airbnb and other short-term rental platforms presents a competitive challenge.
- End-User Trends: Increasing demand for sustainable and experiential travel experiences is driving innovation.
- M&A Activities: The past five years have witnessed moderate M&A activity, with deal values averaging €xx Million per transaction. Examples include [Insert specific M&A examples if available, otherwise replace with "xx"].
Hospitality Industry in the Netherlands Industry Trends & Insights
The Netherlands' hospitality sector is experiencing robust growth, fueled by increasing tourism, a strong domestic economy, and the adoption of innovative technologies. The Compound Annual Growth Rate (CAGR) for the period 2019-2024 was approximately xx%, while the projected CAGR for 2025-2033 is xx%. Market penetration of online booking platforms is consistently high, exceeding xx% in 2024. Key growth drivers include:
- The rising popularity of sustainable tourism practices.
- Increasing adoption of technology-driven solutions for enhanced customer experience.
- A thriving events and conference industry.
Technological disruptions, such as the increasing use of AI-powered customer service tools and the integration of smart room technologies, are reshaping the customer experience. Changing consumer preferences, characterized by a growing demand for personalized experiences and a focus on wellness and sustainability, necessitate continuous adaptation. Competitive dynamics are marked by both intense rivalry among established players and the emergence of disruptive new entrants.
Dominant Markets & Segments in Hospitality Industry in the Netherlands
The Netherlands hospitality market is geographically diverse, with Amsterdam, Rotterdam, and The Hague leading as major hubs due to their strong tourism appeal and business activity. By segment analysis reveals:
- By Type: Chain hotels hold a larger market share than independent hotels due to their brand recognition, loyalty programs, and economies of scale. However, independent hotels are often preferred for their unique character and local experiences.
- By Segment: The mid- and upper-midscale hotel segment currently dominates, driven by a balance of affordability and quality. The luxury segment is also experiencing steady growth due to rising disposable incomes and increased tourism. The budget and economy segments face competitive pressure from short-term rentals. The service apartment segment shows promising growth potential, catering to extended-stay travelers.
Key drivers for market dominance include:
- Economic policies: Government incentives for tourism development and infrastructure improvements contribute to growth.
- Infrastructure: Excellent transport links and well-developed tourist infrastructure enhance accessibility.
Hospitality Industry in the Netherlands Product Innovations
Recent innovations include the integration of augmented reality (AR) and virtual reality (VR) technologies to enhance guest experiences, as exemplified by the AR hotel art tour launched by InterContinental Hotel Group and Fletcher Hotel’s interactive virtual treasure hunt. These initiatives underscore the sector’s embrace of technology to differentiate offerings and cater to evolving customer expectations. The focus is on enhancing personalization, providing contactless services, and improving operational efficiency.
Report Segmentation & Scope
This report segments the Netherlands hospitality market by hotel type (chain and independent) and by hotel segment (budget and economy, mid- and upper-midscale, luxury, and service apartments). Each segment's growth projections, market size estimates, and competitive dynamics are thoroughly analyzed. The report also provides insights into the performance of key players within each segment, highlighting their strengths, weaknesses, and strategic initiatives.
Key Drivers of Hospitality Industry in the Netherlands Growth
Several factors contribute to the growth of the Netherlands' hospitality sector: a robust economy stimulating both business and leisure travel; government initiatives supporting tourism; increasing foreign investment; and advancements in technology enhancing operational efficiency and customer experience. The rise of sustainable tourism further fuels this expansion.
Challenges in the Hospitality Industry in the Netherlands Sector
The industry faces challenges such as seasonal fluctuations impacting occupancy rates; rising operating costs, including labor and energy; and increasing competition from alternative accommodation providers like Airbnb. Maintaining a skilled workforce amidst labor shortages and navigating fluctuating energy prices present significant hurdles. The sector also needs to continuously adapt to evolving consumer demands and maintain a sustainable future.
Leading Players in the Hospitality Industry in the Netherlands Market
- Bastion Hotel Group
- Louvre Hotels Group
- Hilton Hotels & Resorts
- InterContinental Hotel Group
- Radisson Hotel Group
- Van der Valk
- Marriott International
- AccorHotels
- NH Hotels
- Fletcher Hotel
Loyalty Programs: Major hotel brands offer various loyalty programs, including points-based systems, elite status tiers, and exclusive benefits. Specific details on each program are analyzed within the full report.
Key Developments in Hospitality Industry in the Netherlands Sector
- May 2022: Fletcher Hotel launched an immersive virtual treasure hunt, combining virtual and physical gameplay, significantly enhancing the guest experience and potentially attracting a tech-savvy customer base.
- January 2023: InterContinental Hotel Group implemented an Augmented Reality (AR) hotel art tour, providing a unique and interactive experience for guests and showcasing the hotel's art collection, demonstrating a commitment to providing unique experiences and leveraging technology.
Strategic Hospitality Industry in the Netherlands Market Outlook
The Netherlands hospitality market offers significant potential for growth, driven by a healthy tourism sector, expanding business travel, and continuous innovation. Strategic opportunities exist in sustainable tourism, technological integration, and personalized services. Players that successfully adapt to evolving consumer preferences and embrace technological advancements will be best positioned to capture market share and drive long-term growth.
Hospitality Industry in the Netherlands Segmentation
-
1. Type
- 1.1. Chain Hotels
- 1.2. Independent Hotels
-
2. Segment
- 2.1. Service Apartments
- 2.2. Budget and Economy Hotels
- 2.3. Mid and Upper mid scale Hotels
- 2.4. Luxury Hotels
Hospitality Industry in the Netherlands Segmentation By Geography
-
1. North America
- 1.1. United States
- 1.2. Canada
- 1.3. Mexico
-
2. South America
- 2.1. Brazil
- 2.2. Argentina
- 2.3. Rest of South America
-
3. Europe
- 3.1. United Kingdom
- 3.2. Germany
- 3.3. France
- 3.4. Italy
- 3.5. Spain
- 3.6. Russia
- 3.7. Benelux
- 3.8. Nordics
- 3.9. Rest of Europe
-
4. Middle East & Africa
- 4.1. Turkey
- 4.2. Israel
- 4.3. GCC
- 4.4. North Africa
- 4.5. South Africa
- 4.6. Rest of Middle East & Africa
-
5. Asia Pacific
- 5.1. China
- 5.2. India
- 5.3. Japan
- 5.4. South Korea
- 5.5. ASEAN
- 5.6. Oceania
- 5.7. Rest of Asia Pacific
Hospitality Industry in the Netherlands Regional Market Share
Geographic Coverage of Hospitality Industry in the Netherlands
Hospitality Industry in the Netherlands REPORT HIGHLIGHTS
| Aspects | Details |
|---|---|
| Study Period | 2020-2034 |
| Base Year | 2025 |
| Estimated Year | 2026 |
| Forecast Period | 2026-2034 |
| Historical Period | 2020-2025 |
| Growth Rate | CAGR of 3.5% from 2020-2034 |
| Segmentation |
|
Table of Contents
- 1. Introduction
- 1.1. Research Scope
- 1.2. Market Segmentation
- 1.3. Research Objective
- 1.4. Definitions and Assumptions
- 2. Executive Summary
- 2.1. Market Snapshot
- 3. Market Dynamics
- 3.1. Market Drivers
- 3.2. Market Restrains
- 3.3. Market Trends
- 3.4. Market Opportunities
- 4. Market Factor Analysis
- 4.1. Porters Five Forces
- 4.1.1. Bargaining Power of Suppliers
- 4.1.2. Bargaining Power of Buyers
- 4.1.3. Threat of New Entrants
- 4.1.4. Threat of Substitutes
- 4.1.5. Competitive Rivalry
- 4.2. PESTEL analysis
- 4.3. BCG Analysis
- 4.3.1. Stars (High Growth, High Market Share)
- 4.3.2. Cash Cows (Low Growth, High Market Share)
- 4.3.3. Question Mark (High Growth, Low Market Share)
- 4.3.4. Dogs (Low Growth, Low Market Share)
- 4.4. Ansoff Matrix Analysis
- 4.5. Supply Chain Analysis
- 4.6. Regulatory Landscape
- 4.7. Current Market Potential and Opportunity Assessment (TAM–SAM–SOM Framework)
- 4.8. PMV Analyst Note
- 4.1. Porters Five Forces
- 5. Market Analysis, Insights and Forecast 2021-2033
- 5.1. Market Analysis, Insights and Forecast - by Type
- 5.1.1. Chain Hotels
- 5.1.2. Independent Hotels
- 5.2. Market Analysis, Insights and Forecast - by Segment
- 5.2.1. Service Apartments
- 5.2.2. Budget and Economy Hotels
- 5.2.3. Mid and Upper mid scale Hotels
- 5.2.4. Luxury Hotels
- 5.3. Market Analysis, Insights and Forecast - by Region
- 5.3.1. North America
- 5.3.2. South America
- 5.3.3. Europe
- 5.3.4. Middle East & Africa
- 5.3.5. Asia Pacific
- 5.1. Market Analysis, Insights and Forecast - by Type
- 6. Global Hospitality Industry in the Netherlands Analysis, Insights and Forecast, 2021-2033
- 6.1. Market Analysis, Insights and Forecast - by Type
- 6.1.1. Chain Hotels
- 6.1.2. Independent Hotels
- 6.2. Market Analysis, Insights and Forecast - by Segment
- 6.2.1. Service Apartments
- 6.2.2. Budget and Economy Hotels
- 6.2.3. Mid and Upper mid scale Hotels
- 6.2.4. Luxury Hotels
- 6.1. Market Analysis, Insights and Forecast - by Type
- 7. North America Hospitality Industry in the Netherlands Analysis, Insights and Forecast, 2020-2032
- 7.1. Market Analysis, Insights and Forecast - by Type
- 7.1.1. Chain Hotels
- 7.1.2. Independent Hotels
- 7.2. Market Analysis, Insights and Forecast - by Segment
- 7.2.1. Service Apartments
- 7.2.2. Budget and Economy Hotels
- 7.2.3. Mid and Upper mid scale Hotels
- 7.2.4. Luxury Hotels
- 7.1. Market Analysis, Insights and Forecast - by Type
- 8. South America Hospitality Industry in the Netherlands Analysis, Insights and Forecast, 2020-2032
- 8.1. Market Analysis, Insights and Forecast - by Type
- 8.1.1. Chain Hotels
- 8.1.2. Independent Hotels
- 8.2. Market Analysis, Insights and Forecast - by Segment
- 8.2.1. Service Apartments
- 8.2.2. Budget and Economy Hotels
- 8.2.3. Mid and Upper mid scale Hotels
- 8.2.4. Luxury Hotels
- 8.1. Market Analysis, Insights and Forecast - by Type
- 9. Europe Hospitality Industry in the Netherlands Analysis, Insights and Forecast, 2020-2032
- 9.1. Market Analysis, Insights and Forecast - by Type
- 9.1.1. Chain Hotels
- 9.1.2. Independent Hotels
- 9.2. Market Analysis, Insights and Forecast - by Segment
- 9.2.1. Service Apartments
- 9.2.2. Budget and Economy Hotels
- 9.2.3. Mid and Upper mid scale Hotels
- 9.2.4. Luxury Hotels
- 9.1. Market Analysis, Insights and Forecast - by Type
- 10. Middle East & Africa Hospitality Industry in the Netherlands Analysis, Insights and Forecast, 2020-2032
- 10.1. Market Analysis, Insights and Forecast - by Type
- 10.1.1. Chain Hotels
- 10.1.2. Independent Hotels
- 10.2. Market Analysis, Insights and Forecast - by Segment
- 10.2.1. Service Apartments
- 10.2.2. Budget and Economy Hotels
- 10.2.3. Mid and Upper mid scale Hotels
- 10.2.4. Luxury Hotels
- 10.1. Market Analysis, Insights and Forecast - by Type
- 11. Asia Pacific Hospitality Industry in the Netherlands Analysis, Insights and Forecast, 2020-2032
- 11.1. Market Analysis, Insights and Forecast - by Type
- 11.1.1. Chain Hotels
- 11.1.2. Independent Hotels
- 11.2. Market Analysis, Insights and Forecast - by Segment
- 11.2.1. Service Apartments
- 11.2.2. Budget and Economy Hotels
- 11.2.3. Mid and Upper mid scale Hotels
- 11.2.4. Luxury Hotels
- 11.1. Market Analysis, Insights and Forecast - by Type
- 12. Competitive Analysis
- 12.1. Company Profiles
- 12.1.1 Bastion Hotel Group
- 12.1.1.1. Company Overview
- 12.1.1.2. Products
- 12.1.1.3. Company Financials
- 12.1.1.4. SWOT Analysis
- 12.1.2 Louvre Hotels Group
- 12.1.2.1. Company Overview
- 12.1.2.2. Products
- 12.1.2.3. Company Financials
- 12.1.2.4. SWOT Analysis
- 12.1.3 Hilton Hotels &Resorts
- 12.1.3.1. Company Overview
- 12.1.3.2. Products
- 12.1.3.3. Company Financials
- 12.1.3.4. SWOT Analysis
- 12.1.4 InterContinental Hotel Group
- 12.1.4.1. Company Overview
- 12.1.4.2. Products
- 12.1.4.3. Company Financials
- 12.1.4.4. SWOT Analysis
- 12.1.5 Radisson Hotel Group**List Not Exhaustive 6 3 Loyalty programs offered by Major Hotel Brand
- 12.1.5.1. Company Overview
- 12.1.5.2. Products
- 12.1.5.3. Company Financials
- 12.1.5.4. SWOT Analysis
- 12.1.6 6 COMPETITVE INTELLIGENCE6 1 Market Concentration6 2 Company profiles
- 12.1.6.1. Company Overview
- 12.1.6.2. Products
- 12.1.6.3. Company Financials
- 12.1.6.4. SWOT Analysis
- 12.1.7 Van der Valk
- 12.1.7.1. Company Overview
- 12.1.7.2. Products
- 12.1.7.3. Company Financials
- 12.1.7.4. SWOT Analysis
- 12.1.8 Marriott International
- 12.1.8.1. Company Overview
- 12.1.8.2. Products
- 12.1.8.3. Company Financials
- 12.1.8.4. SWOT Analysis
- 12.1.9 AccorHotels
- 12.1.9.1. Company Overview
- 12.1.9.2. Products
- 12.1.9.3. Company Financials
- 12.1.9.4. SWOT Analysis
- 12.1.10 NH Hotels
- 12.1.10.1. Company Overview
- 12.1.10.2. Products
- 12.1.10.3. Company Financials
- 12.1.10.4. SWOT Analysis
- 12.1.11 Fletcher Hotel
- 12.1.11.1. Company Overview
- 12.1.11.2. Products
- 12.1.11.3. Company Financials
- 12.1.11.4. SWOT Analysis
- 12.1.1 Bastion Hotel Group
- 12.2. Market Entropy
- 12.2.1 Company's Key Areas Served
- 12.2.2 Recent Developments
- 12.3. Company Market Share Analysis 2025
- 12.3.1 Top 5 Companies Market Share Analysis
- 12.3.2 Top 3 Companies Market Share Analysis
- 12.4. List of Potential Customers
- 13. Research Methodology
List of Figures
- Figure 1: Global Hospitality Industry in the Netherlands Revenue Breakdown (billion, %) by Region 2025 & 2033
- Figure 2: North America Hospitality Industry in the Netherlands Revenue (billion), by Type 2025 & 2033
- Figure 3: North America Hospitality Industry in the Netherlands Revenue Share (%), by Type 2025 & 2033
- Figure 4: North America Hospitality Industry in the Netherlands Revenue (billion), by Segment 2025 & 2033
- Figure 5: North America Hospitality Industry in the Netherlands Revenue Share (%), by Segment 2025 & 2033
- Figure 6: North America Hospitality Industry in the Netherlands Revenue (billion), by Country 2025 & 2033
- Figure 7: North America Hospitality Industry in the Netherlands Revenue Share (%), by Country 2025 & 2033
- Figure 8: South America Hospitality Industry in the Netherlands Revenue (billion), by Type 2025 & 2033
- Figure 9: South America Hospitality Industry in the Netherlands Revenue Share (%), by Type 2025 & 2033
- Figure 10: South America Hospitality Industry in the Netherlands Revenue (billion), by Segment 2025 & 2033
- Figure 11: South America Hospitality Industry in the Netherlands Revenue Share (%), by Segment 2025 & 2033
- Figure 12: South America Hospitality Industry in the Netherlands Revenue (billion), by Country 2025 & 2033
- Figure 13: South America Hospitality Industry in the Netherlands Revenue Share (%), by Country 2025 & 2033
- Figure 14: Europe Hospitality Industry in the Netherlands Revenue (billion), by Type 2025 & 2033
- Figure 15: Europe Hospitality Industry in the Netherlands Revenue Share (%), by Type 2025 & 2033
- Figure 16: Europe Hospitality Industry in the Netherlands Revenue (billion), by Segment 2025 & 2033
- Figure 17: Europe Hospitality Industry in the Netherlands Revenue Share (%), by Segment 2025 & 2033
- Figure 18: Europe Hospitality Industry in the Netherlands Revenue (billion), by Country 2025 & 2033
- Figure 19: Europe Hospitality Industry in the Netherlands Revenue Share (%), by Country 2025 & 2033
- Figure 20: Middle East & Africa Hospitality Industry in the Netherlands Revenue (billion), by Type 2025 & 2033
- Figure 21: Middle East & Africa Hospitality Industry in the Netherlands Revenue Share (%), by Type 2025 & 2033
- Figure 22: Middle East & Africa Hospitality Industry in the Netherlands Revenue (billion), by Segment 2025 & 2033
- Figure 23: Middle East & Africa Hospitality Industry in the Netherlands Revenue Share (%), by Segment 2025 & 2033
- Figure 24: Middle East & Africa Hospitality Industry in the Netherlands Revenue (billion), by Country 2025 & 2033
- Figure 25: Middle East & Africa Hospitality Industry in the Netherlands Revenue Share (%), by Country 2025 & 2033
- Figure 26: Asia Pacific Hospitality Industry in the Netherlands Revenue (billion), by Type 2025 & 2033
- Figure 27: Asia Pacific Hospitality Industry in the Netherlands Revenue Share (%), by Type 2025 & 2033
- Figure 28: Asia Pacific Hospitality Industry in the Netherlands Revenue (billion), by Segment 2025 & 2033
- Figure 29: Asia Pacific Hospitality Industry in the Netherlands Revenue Share (%), by Segment 2025 & 2033
- Figure 30: Asia Pacific Hospitality Industry in the Netherlands Revenue (billion), by Country 2025 & 2033
- Figure 31: Asia Pacific Hospitality Industry in the Netherlands Revenue Share (%), by Country 2025 & 2033
List of Tables
- Table 1: Global Hospitality Industry in the Netherlands Revenue billion Forecast, by Type 2020 & 2033
- Table 2: Global Hospitality Industry in the Netherlands Revenue billion Forecast, by Segment 2020 & 2033
- Table 3: Global Hospitality Industry in the Netherlands Revenue billion Forecast, by Region 2020 & 2033
- Table 4: Global Hospitality Industry in the Netherlands Revenue billion Forecast, by Type 2020 & 2033
- Table 5: Global Hospitality Industry in the Netherlands Revenue billion Forecast, by Segment 2020 & 2033
- Table 6: Global Hospitality Industry in the Netherlands Revenue billion Forecast, by Country 2020 & 2033
- Table 7: United States Hospitality Industry in the Netherlands Revenue (billion) Forecast, by Application 2020 & 2033
- Table 8: Canada Hospitality Industry in the Netherlands Revenue (billion) Forecast, by Application 2020 & 2033
- Table 9: Mexico Hospitality Industry in the Netherlands Revenue (billion) Forecast, by Application 2020 & 2033
- Table 10: Global Hospitality Industry in the Netherlands Revenue billion Forecast, by Type 2020 & 2033
- Table 11: Global Hospitality Industry in the Netherlands Revenue billion Forecast, by Segment 2020 & 2033
- Table 12: Global Hospitality Industry in the Netherlands Revenue billion Forecast, by Country 2020 & 2033
- Table 13: Brazil Hospitality Industry in the Netherlands Revenue (billion) Forecast, by Application 2020 & 2033
- Table 14: Argentina Hospitality Industry in the Netherlands Revenue (billion) Forecast, by Application 2020 & 2033
- Table 15: Rest of South America Hospitality Industry in the Netherlands Revenue (billion) Forecast, by Application 2020 & 2033
- Table 16: Global Hospitality Industry in the Netherlands Revenue billion Forecast, by Type 2020 & 2033
- Table 17: Global Hospitality Industry in the Netherlands Revenue billion Forecast, by Segment 2020 & 2033
- Table 18: Global Hospitality Industry in the Netherlands Revenue billion Forecast, by Country 2020 & 2033
- Table 19: United Kingdom Hospitality Industry in the Netherlands Revenue (billion) Forecast, by Application 2020 & 2033
- Table 20: Germany Hospitality Industry in the Netherlands Revenue (billion) Forecast, by Application 2020 & 2033
- Table 21: France Hospitality Industry in the Netherlands Revenue (billion) Forecast, by Application 2020 & 2033
- Table 22: Italy Hospitality Industry in the Netherlands Revenue (billion) Forecast, by Application 2020 & 2033
- Table 23: Spain Hospitality Industry in the Netherlands Revenue (billion) Forecast, by Application 2020 & 2033
- Table 24: Russia Hospitality Industry in the Netherlands Revenue (billion) Forecast, by Application 2020 & 2033
- Table 25: Benelux Hospitality Industry in the Netherlands Revenue (billion) Forecast, by Application 2020 & 2033
- Table 26: Nordics Hospitality Industry in the Netherlands Revenue (billion) Forecast, by Application 2020 & 2033
- Table 27: Rest of Europe Hospitality Industry in the Netherlands Revenue (billion) Forecast, by Application 2020 & 2033
- Table 28: Global Hospitality Industry in the Netherlands Revenue billion Forecast, by Type 2020 & 2033
- Table 29: Global Hospitality Industry in the Netherlands Revenue billion Forecast, by Segment 2020 & 2033
- Table 30: Global Hospitality Industry in the Netherlands Revenue billion Forecast, by Country 2020 & 2033
- Table 31: Turkey Hospitality Industry in the Netherlands Revenue (billion) Forecast, by Application 2020 & 2033
- Table 32: Israel Hospitality Industry in the Netherlands Revenue (billion) Forecast, by Application 2020 & 2033
- Table 33: GCC Hospitality Industry in the Netherlands Revenue (billion) Forecast, by Application 2020 & 2033
- Table 34: North Africa Hospitality Industry in the Netherlands Revenue (billion) Forecast, by Application 2020 & 2033
- Table 35: South Africa Hospitality Industry in the Netherlands Revenue (billion) Forecast, by Application 2020 & 2033
- Table 36: Rest of Middle East & Africa Hospitality Industry in the Netherlands Revenue (billion) Forecast, by Application 2020 & 2033
- Table 37: Global Hospitality Industry in the Netherlands Revenue billion Forecast, by Type 2020 & 2033
- Table 38: Global Hospitality Industry in the Netherlands Revenue billion Forecast, by Segment 2020 & 2033
- Table 39: Global Hospitality Industry in the Netherlands Revenue billion Forecast, by Country 2020 & 2033
- Table 40: China Hospitality Industry in the Netherlands Revenue (billion) Forecast, by Application 2020 & 2033
- Table 41: India Hospitality Industry in the Netherlands Revenue (billion) Forecast, by Application 2020 & 2033
- Table 42: Japan Hospitality Industry in the Netherlands Revenue (billion) Forecast, by Application 2020 & 2033
- Table 43: South Korea Hospitality Industry in the Netherlands Revenue (billion) Forecast, by Application 2020 & 2033
- Table 44: ASEAN Hospitality Industry in the Netherlands Revenue (billion) Forecast, by Application 2020 & 2033
- Table 45: Oceania Hospitality Industry in the Netherlands Revenue (billion) Forecast, by Application 2020 & 2033
- Table 46: Rest of Asia Pacific Hospitality Industry in the Netherlands Revenue (billion) Forecast, by Application 2020 & 2033
Frequently Asked Questions
1. What is the projected Compound Annual Growth Rate (CAGR) of the Hospitality Industry in the Netherlands?
The projected CAGR is approximately 3.5%.
2. Which companies are prominent players in the Hospitality Industry in the Netherlands?
Key companies in the market include Bastion Hotel Group, Louvre Hotels Group, Hilton Hotels &Resorts, InterContinental Hotel Group, Radisson Hotel Group**List Not Exhaustive 6 3 Loyalty programs offered by Major Hotel Brand, 6 COMPETITVE INTELLIGENCE6 1 Market Concentration6 2 Company profiles, Van der Valk, Marriott International, AccorHotels, NH Hotels, Fletcher Hotel.
3. What are the main segments of the Hospitality Industry in the Netherlands?
The market segments include Type, Segment.
4. Can you provide details about the market size?
The market size is estimated to be USD 3.95 billion as of 2022.
5. What are some drivers contributing to market growth?
4.; Contribution to the Economy to Generate Income for the Nation.
6. What are the notable trends driving market growth?
Tier-II Cities Are Going to Attract More Investors Thus Driving The Industry.
7. Are there any restraints impacting market growth?
4.; Long Hours of Working Pattern.
8. Can you provide examples of recent developments in the market?
January 2023: InterContinental Hotel Group, Netherlands, took the initiative on an Augmented Reality (AR) hotel art tour where visitors can interact virtually with 10 artworks in the hotel's collection, supplemented by computer-generated graphics and sound as well as written or audio narratives about the piece and artist.
9. What pricing options are available for accessing the report?
Pricing options include single-user, multi-user, and enterprise licenses priced at USD 3800, USD 4500, and USD 5800 respectively.
10. Is the market size provided in terms of value or volume?
The market size is provided in terms of value, measured in billion.
11. Are there any specific market keywords associated with the report?
Yes, the market keyword associated with the report is "Hospitality Industry in the Netherlands," which aids in identifying and referencing the specific market segment covered.
12. How do I determine which pricing option suits my needs best?
The pricing options vary based on user requirements and access needs. Individual users may opt for single-user licenses, while businesses requiring broader access may choose multi-user or enterprise licenses for cost-effective access to the report.
13. Are there any additional resources or data provided in the Hospitality Industry in the Netherlands report?
While the report offers comprehensive insights, it's advisable to review the specific contents or supplementary materials provided to ascertain if additional resources or data are available.
14. How can I stay updated on further developments or reports in the Hospitality Industry in the Netherlands?
To stay informed about further developments, trends, and reports in the Hospitality Industry in the Netherlands, consider subscribing to industry newsletters, following relevant companies and organizations, or regularly checking reputable industry news sources and publications.
Methodology
Step 1 - Identification of Relevant Samples Size from Population Database


Step 2 - Approaches for Defining Global Market Size (Value, Volume* & Price*)

Note*: In applicable scenarios
Step 3 - Data Sources
Primary Research
- Web Analytics
- Survey Reports
- Research Institute
- Latest Research Reports
- Opinion Leaders
Secondary Research
- Annual Reports
- White Paper
- Latest Press Release
- Industry Association
- Paid Database
- Investor Presentations

Step 4 - Data Triangulation
Involves using different sources of information in order to increase the validity of a study
These sources are likely to be stakeholders in a program - participants, other researchers, program staff, other community members, and so on.
Then we put all data in single framework & apply various statistical tools to find out the dynamic on the market.
During the analysis stage, feedback from the stakeholder groups would be compared to determine areas of agreement as well as areas of divergence

