

Key Insights
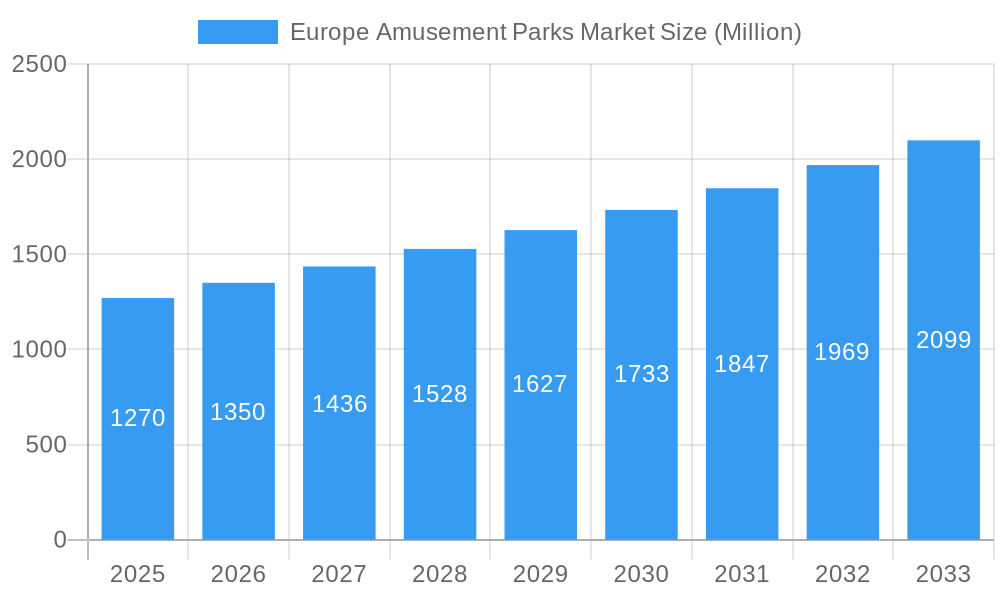
The European amusement park market, valued at €1.27 billion in 2025, is projected to experience robust growth, driven by a Compound Annual Growth Rate (CAGR) of 6.10% from 2025 to 2033. This expansion is fueled by several key factors. Firstly, increasing disposable incomes across Europe, particularly amongst younger demographics, are leading to greater spending on leisure and entertainment. Secondly, the continuous innovation in ride technology and park experiences, including the integration of virtual reality and augmented reality elements, enhances the appeal of amusement parks and attracts a wider range of visitors. Furthermore, strategic partnerships between parks and hotels, resorts, and food & beverage providers offer bundled experiences and enhance revenue streams, contributing to market growth. The segment analysis reveals that mechanical rides currently dominate, but water rides and other innovative offerings are gaining traction. Germany, France, and the United Kingdom represent the largest national markets, reflecting high tourist traffic and established park infrastructure. While the "Up to 18 years" age group is a significant contributor to revenue, the 19-35 year-old demographic is also a key target, demonstrating the market's appeal across multiple age brackets. However, potential constraints include seasonality, economic downturns which can impact discretionary spending, and increasing operational costs related to maintenance and safety regulations.
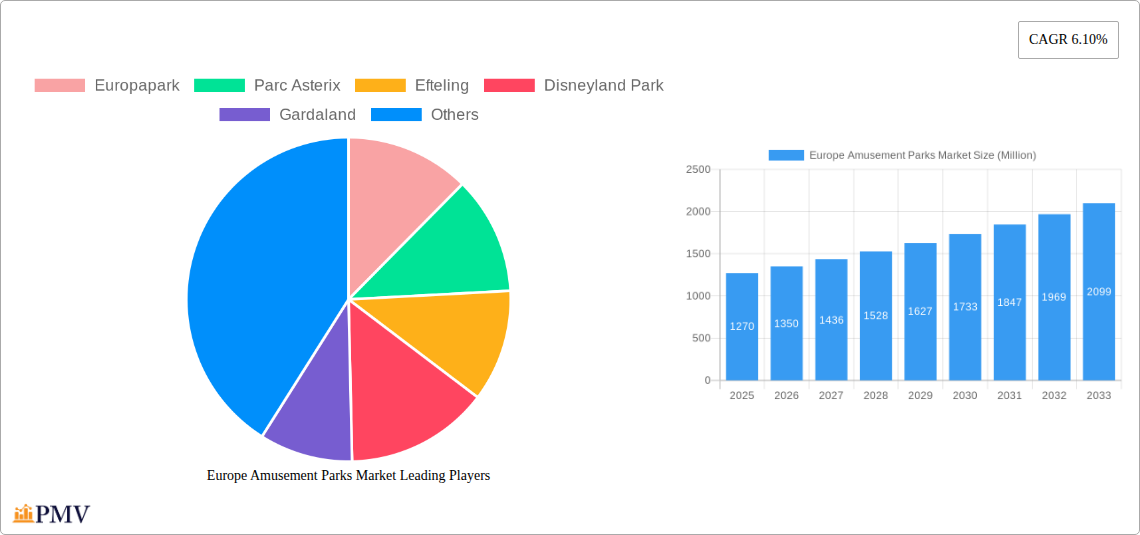
Europe Amusement Parks Market Market Size (In Billion)
Despite these challenges, the market exhibits strong resilience. The presence of established major players like Europa-Park, Disneyland Paris, and others demonstrates market maturity and competitive intensity. However, the consistent introduction of new attractions and themed experiences indicates an ongoing effort to maintain visitor interest and attract new customers. The ongoing evolution of park offerings, coupled with strategic location advantages, points towards a positive outlook for this sector. Further growth is likely to be supported by targeted marketing campaigns emphasizing family-friendly experiences and immersive technologies. Continued investment in infrastructure upgrades and employee training will ensure the long-term sustainability and profitability of this vibrant industry.
Europe Amusement Parks Market Company Market Share
Europe Amusement Parks Market: A Comprehensive Report (2019-2033)
This comprehensive report provides a detailed analysis of the Europe Amusement Parks Market, offering invaluable insights for industry stakeholders, investors, and strategic decision-makers. Covering the period from 2019 to 2033, with a base year of 2025 and a forecast period of 2025-2033, this report offers a granular view of market dynamics, competitive landscape, and future growth potential. The market is segmented by country (United Kingdom, Germany, France, Rest of Europe), ride type (Mechanical Rides, Water Rides, Other Rides), age group (Up to 18 Years, 19 to 35 Years, 36 to 50 Years, 51 to 65 Years, More than 65 Years), and revenue source (Tickets, Food and Beverage, Merchandise, Hotels and Resorts, Others). Key players analyzed include Europapark, Parc Asterix, Efteling, Disneyland Park, Gardaland, Tivoli Gardens, Grona Lund, PortAventura, Futuroscope, and Walibi (list not exhaustive). The report’s projected market value for 2025 is xx Million, with a forecasted CAGR of xx% during 2025-2033.
Europe Amusement Parks Market Structure & Competitive Dynamics
The European amusement park market exhibits a moderately concentrated structure, with a few major players commanding significant market share. Europapark, Disneyland Paris, and Efteling are among the leading players, although market share fluctuates annually based on seasonal demand, new attractions, and marketing initiatives. The market is characterized by a dynamic innovation ecosystem, with continuous efforts to introduce new rides, immersive experiences, and themed areas. Regulatory frameworks, varying across different European countries, influence safety standards, operating permits, and environmental regulations. Substitute entertainment options, such as online gaming, cinemas, and other leisure activities, exert competitive pressure. End-user trends increasingly favor immersive and technologically advanced experiences, driving innovation in ride technology and thematic development. M&A activities have been relatively moderate in recent years, with deal values averaging xx Million per transaction in the historical period (2019-2024). However, strategic partnerships and collaborations are increasingly prevalent, allowing for resource sharing and expansion into new markets.
Europe Amusement Parks Market Industry Trends & Insights
The European amusement park market is experiencing steady growth, driven by several key factors. Rising disposable incomes, particularly in developing European economies, fuel increased spending on leisure activities. Technological advancements, including virtual reality (VR) and augmented reality (AR) integration into rides and attractions, enhance the visitor experience and attract a wider demographic. Changing consumer preferences, a move towards immersive and interactive experiences, are shaping the design and development of new attractions. However, factors such as economic downturns, seasonal variations in visitor numbers, and increasing competition from alternative leisure options pose challenges. The CAGR for the historical period (2019-2024) is estimated to be xx%, with market penetration expected to increase by xx% by 2033. The competitive dynamics are intense, with established players investing heavily in modernization and expansion while smaller parks focus on niche offerings and targeted marketing strategies. The introduction of new technologies such as AI-driven personalized experiences and smart ticketing systems are poised to increase market efficiency and customer satisfaction.
Dominant Markets & Segments in Europe Amusement Parks Market
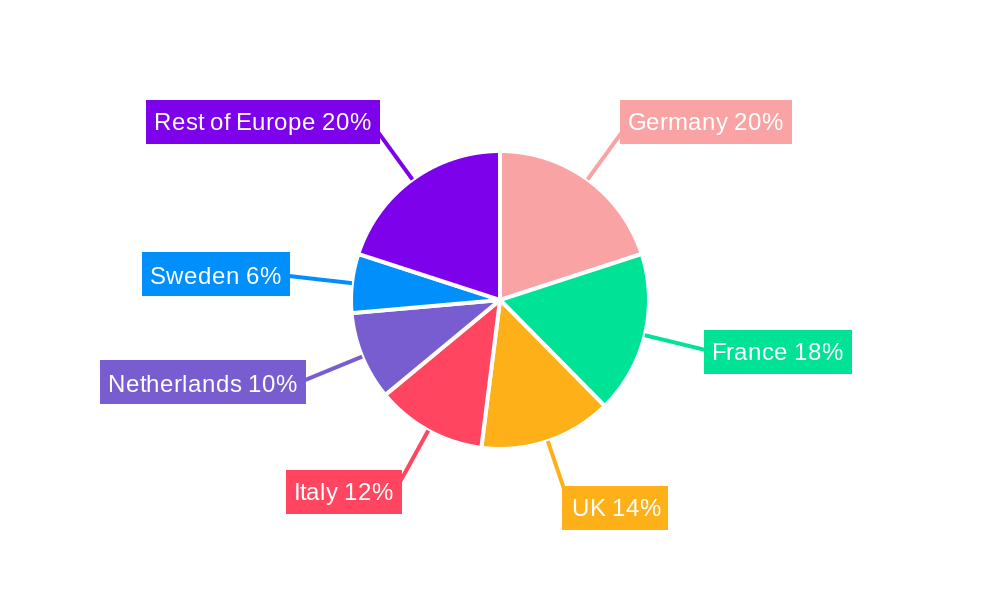
Leading Region/Country: France and Germany, followed by the UK, currently dominate the European amusement park market due to high tourist footfall, robust infrastructure, and existing established players. The Rest of Europe segment shows steady but slower growth compared to the aforementioned markets.
Dominant Ride Segment: Mechanical rides and thrilling attractions, particularly rollercoasters, continue to be the most popular and revenue-generating segment, appealing to a broad age range. However, the water rides segment is also experiencing strong growth, especially in Southern European countries.
Dominant Age Segment: The 19-35 age group is the most significant revenue contributor, representing a sizeable proportion of frequent visitors. The up-to-18 years and the 36-50 years segments are also substantial contributors.
Dominant Revenue Stream: Ticket sales remain the primary revenue source, accounting for xx% of total revenue in 2024. However, the food and beverage segment, along with merchandise sales and hotel revenue, are experiencing significant growth as parks diversify their offerings and enhance the overall visitor experience.
Key Drivers: Strong tourism infrastructure, favorable government policies promoting tourism, and substantial private investments in new attractions and park improvements.
Europe Amusement Parks Market Product Innovations
Recent innovations focus on enhancing visitor experiences through technological integrations. VR and AR technologies are increasingly incorporated into rides, offering immersive and interactive experiences. The development of sustainable and eco-friendly attractions is also gaining momentum. New ride systems prioritizing safety and maximizing thrill levels remain a focal point. These innovations offer enhanced engagement, differentiation, and competitive advantages in an increasingly saturated market.
Report Segmentation & Scope
This report segments the market by:
Country: United Kingdom, Germany, France, Rest of Europe. Each country's market size, growth projections, and competitive dynamics are analyzed individually.
Ride Type: Mechanical Rides, Water Rides, Other Rides. The report analyzes the market share, growth trajectory, and technological advancements within each ride category.
Age Group: Up to 18 Years, 19 to 35 Years, 36 to 50 Years, 51 to 65 Years, More than 65 Years. The report analyzes the preferences, spending patterns, and contribution of each age group to overall market revenue.
Revenue Source: Tickets, Food and Beverage, Merchandise, Hotels and Resorts, Others. This analysis demonstrates the relative importance and growth potential of each revenue stream for amusement park operators.
Key Drivers of Europe Amusement Parks Market Growth
Technological advancements in ride design and immersive experiences are significantly driving market growth. The rising disposable incomes in several European countries fuel increased spending on leisure and entertainment. Furthermore, government initiatives promoting tourism and infrastructure development support the expansion of the amusement park sector. Finally, strategic partnerships and investments by major players are constantly shaping the market landscape and driving further innovation.
Challenges in the Europe Amusement Parks Market Sector
The amusement park sector faces challenges such as seasonal fluctuations in visitor numbers, which directly impacts revenue streams. Increasing competition from alternative entertainment options puts pressure on pricing and necessitates continuous innovation. Strict safety regulations and environmental concerns require significant investments in compliance measures. Economic downturns and unpredictable global events can significantly impact visitor numbers and overall market performance, potentially leading to revenue loss.
Leading Players in the Europe Amusement Parks Market Market
Key Developments in Europe Amusement Parks Market Sector
October 2023: Disneyland Paris announced a Euro 1.4 billion investment in its movie-themed park expansion over the past five years, signifying a commitment to enhancing visitor experiences and attracting a broader audience.
December 2023: Efteling announced the development of its new Danse Macabre attraction, opening in Fall 2024. This demonstrates a continued focus on innovation and themed attractions, alongside sustainability initiatives.
Strategic Europe Amusement Parks Market Outlook
The European amusement park market presents significant growth potential, driven by ongoing technological advancements, increasing disposable incomes, and a rising preference for immersive entertainment experiences. Strategic opportunities lie in further technological integration, sustainability initiatives, and the development of unique and themed attractions catering to diverse age groups and interests. Expansion into new markets and strategic partnerships can also drive market growth and enhance competitiveness in this dynamic sector.
Europe Amusement Parks Market Segmentation
-
1. Rides
- 1.1. Mechanical Rides
- 1.2. Water Rides
- 1.3. Other Rides
-
2. Age
- 2.1. Up To 18 Years
- 2.2. 19 To 35 Years
- 2.3. 36 To 50 Years
- 2.4. 51 To 65 Years
- 2.5. More Than 65 Years
-
3. Revenue Source
- 3.1. Tickets
- 3.2. Food and Beverage
- 3.3. Merchandise
- 3.4. Hotels and Resorts
- 3.5. Others
Europe Amusement Parks Market Segmentation By Geography
-
1. Europe
- 1.1. United Kingdom
- 1.2. Germany
- 1.3. France
- 1.4. Italy
- 1.5. Spain
- 1.6. Netherlands
- 1.7. Belgium
- 1.8. Sweden
- 1.9. Norway
- 1.10. Poland
- 1.11. Denmark
Europe Amusement Parks Market Regional Market Share
Geographic Coverage of Europe Amusement Parks Market
Europe Amusement Parks Market REPORT HIGHLIGHTS
| Aspects | Details |
|---|---|
| Study Period | 2020-2034 |
| Base Year | 2025 |
| Estimated Year | 2026 |
| Forecast Period | 2026-2034 |
| Historical Period | 2020-2025 |
| Growth Rate | CAGR of 6.10% from 2020-2034 |
| Segmentation |
|
Table of Contents
- 1. Introduction
- 1.1. Research Scope
- 1.2. Market Segmentation
- 1.3. Research Objective
- 1.4. Definitions and Assumptions
- 2. Executive Summary
- 2.1. Market Snapshot
- 3. Market Dynamics
- 3.1. Market Drivers
- 3.2. Market Restrains
- 3.3. Market Trends
- 3.4. Market Opportunities
- 4. Market Factor Analysis
- 4.1. Porters Five Forces
- 4.1.1. Bargaining Power of Suppliers
- 4.1.2. Bargaining Power of Buyers
- 4.1.3. Threat of New Entrants
- 4.1.4. Threat of Substitutes
- 4.1.5. Competitive Rivalry
- 4.2. PESTEL analysis
- 4.3. BCG Analysis
- 4.3.1. Stars (High Growth, High Market Share)
- 4.3.2. Cash Cows (Low Growth, High Market Share)
- 4.3.3. Question Mark (High Growth, Low Market Share)
- 4.3.4. Dogs (Low Growth, Low Market Share)
- 4.4. Ansoff Matrix Analysis
- 4.5. Supply Chain Analysis
- 4.6. Regulatory Landscape
- 4.7. Current Market Potential and Opportunity Assessment (TAM–SAM–SOM Framework)
- 4.8. PMV Analyst Note
- 4.1. Porters Five Forces
- 5. Market Analysis, Insights and Forecast 2021-2033
- 5.1. Market Analysis, Insights and Forecast - by Rides
- 5.1.1. Mechanical Rides
- 5.1.2. Water Rides
- 5.1.3. Other Rides
- 5.2. Market Analysis, Insights and Forecast - by Age
- 5.2.1. Up To 18 Years
- 5.2.2. 19 To 35 Years
- 5.2.3. 36 To 50 Years
- 5.2.4. 51 To 65 Years
- 5.2.5. More Than 65 Years
- 5.3. Market Analysis, Insights and Forecast - by Revenue Source
- 5.3.1. Tickets
- 5.3.2. Food and Beverage
- 5.3.3. Merchandise
- 5.3.4. Hotels and Resorts
- 5.3.5. Others
- 5.4. Market Analysis, Insights and Forecast - by Region
- 5.4.1. Europe
- 5.1. Market Analysis, Insights and Forecast - by Rides
- 6. Europe Amusement Parks Market Analysis, Insights and Forecast, 2021-2033
- 6.1. Market Analysis, Insights and Forecast - by Rides
- 6.1.1. Mechanical Rides
- 6.1.2. Water Rides
- 6.1.3. Other Rides
- 6.2. Market Analysis, Insights and Forecast - by Age
- 6.2.1. Up To 18 Years
- 6.2.2. 19 To 35 Years
- 6.2.3. 36 To 50 Years
- 6.2.4. 51 To 65 Years
- 6.2.5. More Than 65 Years
- 6.3. Market Analysis, Insights and Forecast - by Revenue Source
- 6.3.1. Tickets
- 6.3.2. Food and Beverage
- 6.3.3. Merchandise
- 6.3.4. Hotels and Resorts
- 6.3.5. Others
- 6.1. Market Analysis, Insights and Forecast - by Rides
- 7. Competitive Analysis
- 7.1. Company Profiles
- 7.1.1 Europapark
- 7.1.1.1. Company Overview
- 7.1.1.2. Products
- 7.1.1.3. Company Financials
- 7.1.1.4. SWOT Analysis
- 7.1.2 Parc Asterix
- 7.1.2.1. Company Overview
- 7.1.2.2. Products
- 7.1.2.3. Company Financials
- 7.1.2.4. SWOT Analysis
- 7.1.3 Efteling
- 7.1.3.1. Company Overview
- 7.1.3.2. Products
- 7.1.3.3. Company Financials
- 7.1.3.4. SWOT Analysis
- 7.1.4 Disneyland Park
- 7.1.4.1. Company Overview
- 7.1.4.2. Products
- 7.1.4.3. Company Financials
- 7.1.4.4. SWOT Analysis
- 7.1.5 Gardaland
- 7.1.5.1. Company Overview
- 7.1.5.2. Products
- 7.1.5.3. Company Financials
- 7.1.5.4. SWOT Analysis
- 7.1.6 Tivoli Gardens
- 7.1.6.1. Company Overview
- 7.1.6.2. Products
- 7.1.6.3. Company Financials
- 7.1.6.4. SWOT Analysis
- 7.1.7 Grona Lund
- 7.1.7.1. Company Overview
- 7.1.7.2. Products
- 7.1.7.3. Company Financials
- 7.1.7.4. SWOT Analysis
- 7.1.8 PortAventura
- 7.1.8.1. Company Overview
- 7.1.8.2. Products
- 7.1.8.3. Company Financials
- 7.1.8.4. SWOT Analysis
- 7.1.9 Futuroscope
- 7.1.9.1. Company Overview
- 7.1.9.2. Products
- 7.1.9.3. Company Financials
- 7.1.9.4. SWOT Analysis
- 7.1.10 Walibi**List Not Exhaustive
- 7.1.10.1. Company Overview
- 7.1.10.2. Products
- 7.1.10.3. Company Financials
- 7.1.10.4. SWOT Analysis
- 7.1.1 Europapark
- 7.2. Market Entropy
- 7.2.1 Company's Key Areas Served
- 7.2.2 Recent Developments
- 7.3. Company Market Share Analysis 2025
- 7.3.1 Top 5 Companies Market Share Analysis
- 7.3.2 Top 3 Companies Market Share Analysis
- 7.4. List of Potential Customers
- 8. Research Methodology
List of Figures
- Figure 1: Europe Amusement Parks Market Revenue Breakdown (Million, %) by Product 2025 & 2033
- Figure 2: Europe Amusement Parks Market Share (%) by Company 2025
List of Tables
- Table 1: Europe Amusement Parks Market Revenue Million Forecast, by Rides 2020 & 2033
- Table 2: Europe Amusement Parks Market Revenue Million Forecast, by Age 2020 & 2033
- Table 3: Europe Amusement Parks Market Revenue Million Forecast, by Revenue Source 2020 & 2033
- Table 4: Europe Amusement Parks Market Revenue Million Forecast, by Region 2020 & 2033
- Table 5: Europe Amusement Parks Market Revenue Million Forecast, by Rides 2020 & 2033
- Table 6: Europe Amusement Parks Market Revenue Million Forecast, by Age 2020 & 2033
- Table 7: Europe Amusement Parks Market Revenue Million Forecast, by Revenue Source 2020 & 2033
- Table 8: Europe Amusement Parks Market Revenue Million Forecast, by Country 2020 & 2033
- Table 9: United Kingdom Europe Amusement Parks Market Revenue (Million) Forecast, by Application 2020 & 2033
- Table 10: Germany Europe Amusement Parks Market Revenue (Million) Forecast, by Application 2020 & 2033
- Table 11: France Europe Amusement Parks Market Revenue (Million) Forecast, by Application 2020 & 2033
- Table 12: Italy Europe Amusement Parks Market Revenue (Million) Forecast, by Application 2020 & 2033
- Table 13: Spain Europe Amusement Parks Market Revenue (Million) Forecast, by Application 2020 & 2033
- Table 14: Netherlands Europe Amusement Parks Market Revenue (Million) Forecast, by Application 2020 & 2033
- Table 15: Belgium Europe Amusement Parks Market Revenue (Million) Forecast, by Application 2020 & 2033
- Table 16: Sweden Europe Amusement Parks Market Revenue (Million) Forecast, by Application 2020 & 2033
- Table 17: Norway Europe Amusement Parks Market Revenue (Million) Forecast, by Application 2020 & 2033
- Table 18: Poland Europe Amusement Parks Market Revenue (Million) Forecast, by Application 2020 & 2033
- Table 19: Denmark Europe Amusement Parks Market Revenue (Million) Forecast, by Application 2020 & 2033
Frequently Asked Questions
1. What is the projected Compound Annual Growth Rate (CAGR) of the Europe Amusement Parks Market?
The projected CAGR is approximately 6.10%.
2. Which companies are prominent players in the Europe Amusement Parks Market?
Key companies in the market include Europapark, Parc Asterix, Efteling, Disneyland Park, Gardaland, Tivoli Gardens, Grona Lund, PortAventura, Futuroscope, Walibi**List Not Exhaustive.
3. What are the main segments of the Europe Amusement Parks Market?
The market segments include Rides, Age, Revenue Source.
4. Can you provide details about the market size?
The market size is estimated to be USD 1.27 Million as of 2022.
5. What are some drivers contributing to market growth?
Increase in the online travel agencies in Russia; Due to factors including digital trends and technical improvements. the online booking industry is undergoing significant transformation.
6. What are the notable trends driving market growth?
Rising Attention Toward the Theme-Based Amusement Parks.
7. Are there any restraints impacting market growth?
Booking Cancellation.
8. Can you provide examples of recent developments in the market?
In October 2023, Disneyland Paris announced an investment exceeding USD 1.5 billion (Euro 1.4 billion) in its movie-themed park over the preceding five years.
9. What pricing options are available for accessing the report?
Pricing options include single-user, multi-user, and enterprise licenses priced at USD 4750, USD 4950, and USD 6800 respectively.
10. Is the market size provided in terms of value or volume?
The market size is provided in terms of value, measured in Million.
11. Are there any specific market keywords associated with the report?
Yes, the market keyword associated with the report is "Europe Amusement Parks Market," which aids in identifying and referencing the specific market segment covered.
12. How do I determine which pricing option suits my needs best?
The pricing options vary based on user requirements and access needs. Individual users may opt for single-user licenses, while businesses requiring broader access may choose multi-user or enterprise licenses for cost-effective access to the report.
13. Are there any additional resources or data provided in the Europe Amusement Parks Market report?
While the report offers comprehensive insights, it's advisable to review the specific contents or supplementary materials provided to ascertain if additional resources or data are available.
14. How can I stay updated on further developments or reports in the Europe Amusement Parks Market?
To stay informed about further developments, trends, and reports in the Europe Amusement Parks Market, consider subscribing to industry newsletters, following relevant companies and organizations, or regularly checking reputable industry news sources and publications.
Methodology
Step 1 - Identification of Relevant Samples Size from Population Database


Step 2 - Approaches for Defining Global Market Size (Value, Volume* & Price*)

Note*: In applicable scenarios
Step 3 - Data Sources
Primary Research
- Web Analytics
- Survey Reports
- Research Institute
- Latest Research Reports
- Opinion Leaders
Secondary Research
- Annual Reports
- White Paper
- Latest Press Release
- Industry Association
- Paid Database
- Investor Presentations

Step 4 - Data Triangulation
Involves using different sources of information in order to increase the validity of a study
These sources are likely to be stakeholders in a program - participants, other researchers, program staff, other community members, and so on.
Then we put all data in single framework & apply various statistical tools to find out the dynamic on the market.
During the analysis stage, feedback from the stakeholder groups would be compared to determine areas of agreement as well as areas of divergence