
Key Insights
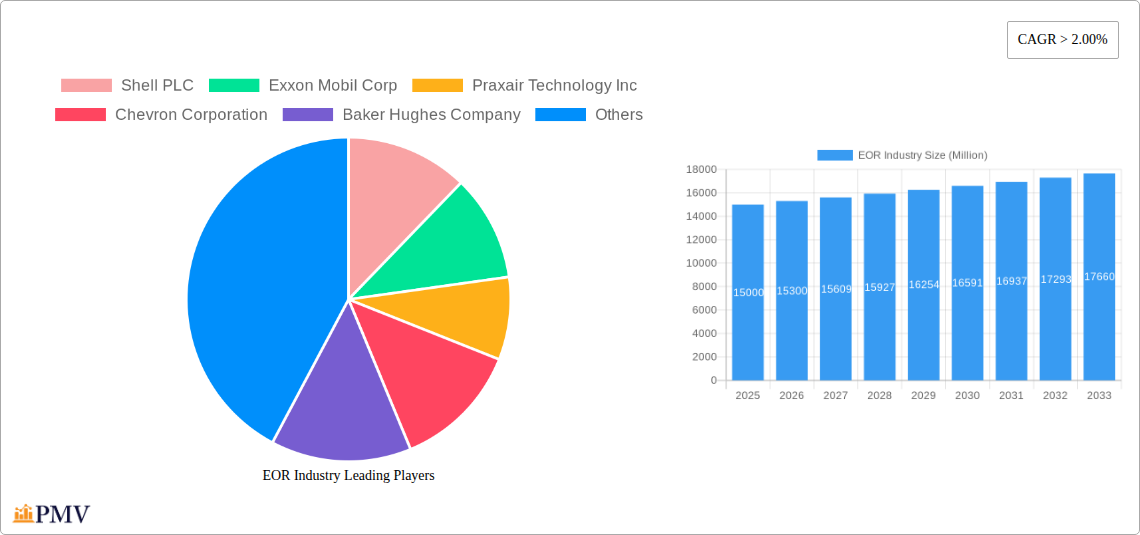
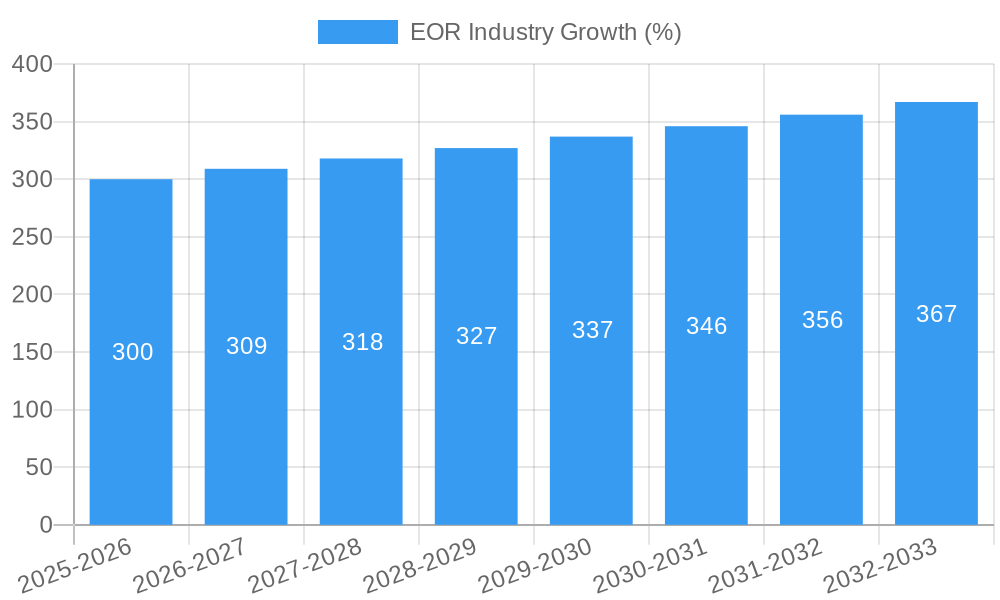
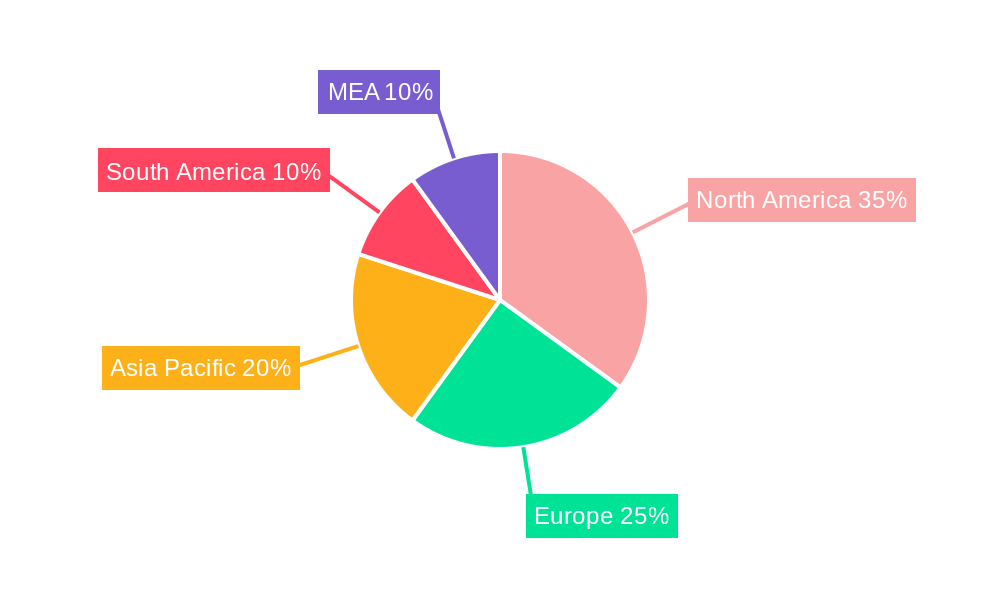
The Enhanced Oil Recovery (EOR) market is experiencing robust growth, driven by the increasing global demand for oil and gas, coupled with the depletion of easily accessible reserves. The market's Compound Annual Growth Rate (CAGR) exceeding 2.00% indicates a steady expansion projected to continue through 2033. Key technological drivers include advancements in gas injection, thermal injection, and chemical injection techniques, offering improved efficiency and recovery rates from mature oil fields. The shift towards sustainable practices is also influencing the market, with growing interest in microbial EOR methods, although these currently represent a smaller segment. Geographic deployment is largely concentrated in regions with established oil and gas infrastructure, such as North America (especially the United States), Europe, and the Asia-Pacific region. However, significant growth potential exists in other regions with substantial reserves, including the Middle East and Africa, South America, and parts of Asia, as these areas invest in modern EOR techniques. While regulatory hurdles and high initial investment costs pose some challenges, technological innovation and the escalating price of oil are expected to mitigate these restraints in the long term. The dominance of major oil companies like Shell, ExxonMobil, and Chevron, alongside significant contributions from service providers like Schlumberger and Halliburton, underscores the industry's consolidation and the expertise required for successful EOR projects.
The segmentation of the EOR market by technology and location underscores the diverse strategies employed across the globe. Gas injection, thermal injection, and chemical injection currently dominate, reflecting established practices and readily available infrastructure. However, the increasing focus on environmental sustainability is pushing the market toward greater adoption of microbial injection techniques, which offer a potentially greener alternative. Onshore deployments currently comprise a larger portion of the market due to established infrastructure and lower initial investment costs compared to offshore operations. Nevertheless, offshore EOR is poised for expansion as technological advancements address the associated challenges and the exploration of offshore reserves intensifies. Regional variations in market size and growth rate reflect factors such as the presence of mature oil fields, governmental regulations, and investment in EOR technologies. The continuous development of new technologies, coupled with rising oil prices and dwindling easily accessible reserves, suggests a positive outlook for the EOR market’s sustained growth over the forecast period.
Enhanced Oil Recovery (EOR) Industry Market Report: 2019-2033
This comprehensive report provides an in-depth analysis of the global Enhanced Oil Recovery (EOR) industry, offering valuable insights for businesses, investors, and policymakers. With a study period spanning 2019-2033, a base year of 2025, and a forecast period of 2025-2033, this report presents a detailed overview of market size, segmentation, trends, and future projections, all valued in millions.
EOR Industry Market Structure & Competitive Dynamics
The EOR industry exhibits a moderately concentrated market structure, with a handful of major players controlling a significant market share. Key players, including Shell PLC, Exxon Mobil Corp, Chevron Corporation, BP PLC, and Schlumberger Limited, dominate through technological advancements, extensive operational capabilities, and strategic partnerships. However, smaller specialized companies are also present, focusing on niche technologies or geographical areas. The industry’s innovation ecosystem is characterized by collaborations between oil majors, technology providers, and research institutions, driving continuous technological improvements. Regulatory frameworks significantly impact the EOR industry, varying across regions and focusing on environmental protection and resource management. Substitute technologies, such as renewable energy sources, exert indirect competitive pressure, although EOR remains crucial for maximizing existing oil reserves. End-user trends favor sustainable and cost-effective EOR solutions. The industry has witnessed significant M&A activity in recent years, with deal values reaching xx Million, driven by the need for technological expansion and market consolidation.
- Market Concentration: High, with top 5 players holding approximately xx% market share.
- M&A Activity: Significant activity, with total deal value estimated at xx Million between 2019-2024.
- Regulatory Landscape: Complex and varies by region, impacting investment decisions and operational practices.
- Innovation Ecosystem: Robust collaboration between oil majors and technology providers.
EOR Industry Industry Trends & Insights
The EOR industry is experiencing robust growth, driven by several factors. The increasing demand for oil and gas, coupled with dwindling reserves of easily accessible oil, necessitates efficient extraction techniques. Technological advancements in EOR techniques, such as improved chemical injection and gas injection methods, are enhancing recovery rates and reducing operational costs. Rising global energy prices and government incentives for oil and gas production further stimulate market expansion. The industry is witnessing a shift towards sustainable and environmentally friendly EOR methods. This includes a focus on carbon capture, utilization, and storage (CCUS) technologies to mitigate environmental impact. The projected Compound Annual Growth Rate (CAGR) for the EOR market during the forecast period (2025-2033) is estimated at xx%. Market penetration of advanced EOR technologies is expected to reach approximately xx% by 2033. The competitive landscape is dynamic, with companies continuously investing in R&D to improve existing technologies and develop novel approaches.
Dominant Markets & Segments in EOR Industry
The Middle East and North America currently dominate the global EOR market, driven by large reserves and significant investments in oil and gas production. Onshore EOR deployments are more prevalent than offshore deployments due to lower costs and operational complexities. Within EOR technologies, Chemical Injection currently holds the largest market share due to its maturity and effectiveness in diverse reservoir types.
- Leading Region: Middle East and North America.
- Dominant Segment (Technology): Chemical Injection.
- Dominant Segment (Location): Onshore.
Key Drivers:
- Middle East & North America: Extensive oil reserves, robust infrastructure, and government support.
- Chemical Injection: Mature technology, cost-effectiveness, and adaptability to various reservoir characteristics.
- Onshore: Lower deployment costs and operational complexities compared to offshore.
EOR Industry Product Innovations
Recent advancements in EOR technology focus on improving efficiency, reducing environmental impact, and increasing recovery rates. This includes the development of advanced chemical formulations for enhanced oil displacement, innovative gas injection techniques, and the integration of digital technologies for enhanced reservoir management. These innovations are designed to meet the growing demand for oil and gas while addressing environmental concerns and improving operational efficiency. The market is witnessing increased adoption of sophisticated simulation tools and data analytics for optimizing EOR operations.
Report Segmentation & Scope
This report segments the EOR market based on technology (Gas Injection, Thermal Injection, Chemical Injection, Microbial Injection, Other Technologies) and location of deployment (Onshore, Offshore). Each segment is analyzed in terms of market size, growth projections, and competitive dynamics. Growth projections vary significantly across segments, with Chemical Injection and Onshore deployments projected to witness faster growth rates compared to other segments. Competitive dynamics are influenced by technological advancements, market share, and strategic alliances among key players.
Key Drivers of EOR Industry Growth
Several key factors drive the growth of the EOR industry, including increasing global energy demand, dwindling conventional oil reserves, advancements in EOR technologies, government support for oil and gas production, and rising crude oil prices. Technological advancements in areas such as nanotechnology, big data analytics, and improved chemical formulations are leading to higher oil recovery rates and improved efficiency. Government incentives and policies supporting oil and gas production play a significant role in fostering market expansion.
Challenges in the EOR Industry Sector
The EOR industry faces several challenges, including high upfront investment costs, technological complexities, environmental concerns associated with certain EOR methods, volatile oil prices, and regulatory uncertainties in different regions. These factors can impact project profitability and hamper the industry's growth trajectory. Stringent environmental regulations mandate the adoption of sustainable EOR practices, presenting both challenges and opportunities. Supply chain disruptions can also impact the availability of essential equipment and chemicals.
Leading Players in the EOR Industry Market
- Shell PLC
- Exxon Mobil Corp
- Praxair Technology Inc
- Chevron Corporation
- Baker Hughes Company
- TotalEnergies SE
- Halliburton Company
- Weatherford International PLC
- BP PLC
- Schlumberger Limited
Key Developments in EOR Industry Sector
- July 2021: Sinopec launched China's largest CCUS project, showcasing the growing interest in sustainable EOR methods.
- August 2021: J-Power and Schlumberger's collaboration on CO2-free hydrogen production highlights the potential for integrating EOR with renewable energy sources.
- October 2021: Gazprom Neft and Tatarstan's agreement focuses on enhanced oil recovery technology development.
- October 2021: LUKOIL and Gazprom Neft's cooperation aims at improving chemical EOR methods. These developments reflect the industry's focus on technological innovation and collaboration.
Strategic EOR Industry Market Outlook
The future of the EOR industry looks promising, driven by continued technological advancements, increasing energy demand, and a growing focus on sustainable practices. Strategic opportunities lie in developing innovative EOR solutions that address environmental concerns, improving operational efficiency, and expanding into new geographical markets. The integration of digital technologies, such as artificial intelligence and machine learning, will play a crucial role in optimizing EOR operations and enhancing recovery rates. The focus on CCUS technologies will further drive industry growth and sustainability.
EOR Industry Segmentation
-
1. Technology
- 1.1. Gas Injection
- 1.2. Thermal Injection
- 1.3. Chemical Injection
- 1.4. Microbial Injection
- 1.5. Other Technologies
-
2. Location of Deployment
- 2.1. Onshore
- 2.2. Offshore
EOR Industry Segmentation By Geography
- 1. North America
- 2. Europe
- 3. Asia Pacific
- 4. South America
- 5. Middle East
EOR Industry REPORT HIGHLIGHTS
| Aspects | Details |
|---|---|
| Study Period | 2019-2033 |
| Base Year | 2024 |
| Estimated Year | 2025 |
| Forecast Period | 2025-2033 |
| Historical Period | 2019-2024 |
| Growth Rate | CAGR of > 2.00% from 2019-2033 |
| Segmentation |
|
Table of Contents
- 1. Introduction
- 1.1. Research Scope
- 1.2. Market Segmentation
- 1.3. Research Methodology
- 1.4. Definitions and Assumptions
- 2. Executive Summary
- 2.1. Introduction
- 3. Market Dynamics
- 3.1. Introduction
- 3.2. Market Drivers
- 3.2.1. 4.; Rapid Recovery in the Oil and Gas and Mining Industries4.; Surge in the Construction Industry
- 3.3. Market Restrains
- 3.3.1. 4.; High Maintenance and Operation Costs of Submersible Pump Restrain the Market
- 3.4. Market Trends
- 3.4.1. Gas Injection Technique to Dominate the Market
- 4. Market Factor Analysis
- 4.1. Porters Five Forces
- 4.2. Supply/Value Chain
- 4.3. PESTEL analysis
- 4.4. Market Entropy
- 4.5. Patent/Trademark Analysis
- 5. Global EOR Industry Analysis, Insights and Forecast, 2019-2031
- 5.1. Market Analysis, Insights and Forecast - by Technology
- 5.1.1. Gas Injection
- 5.1.2. Thermal Injection
- 5.1.3. Chemical Injection
- 5.1.4. Microbial Injection
- 5.1.5. Other Technologies
- 5.2. Market Analysis, Insights and Forecast - by Location of Deployment
- 5.2.1. Onshore
- 5.2.2. Offshore
- 5.3. Market Analysis, Insights and Forecast - by Region
- 5.3.1. North America
- 5.3.2. Europe
- 5.3.3. Asia Pacific
- 5.3.4. South America
- 5.3.5. Middle East
- 5.1. Market Analysis, Insights and Forecast - by Technology
- 6. North America EOR Industry Analysis, Insights and Forecast, 2019-2031
- 6.1. Market Analysis, Insights and Forecast - by Technology
- 6.1.1. Gas Injection
- 6.1.2. Thermal Injection
- 6.1.3. Chemical Injection
- 6.1.4. Microbial Injection
- 6.1.5. Other Technologies
- 6.2. Market Analysis, Insights and Forecast - by Location of Deployment
- 6.2.1. Onshore
- 6.2.2. Offshore
- 6.1. Market Analysis, Insights and Forecast - by Technology
- 7. Europe EOR Industry Analysis, Insights and Forecast, 2019-2031
- 7.1. Market Analysis, Insights and Forecast - by Technology
- 7.1.1. Gas Injection
- 7.1.2. Thermal Injection
- 7.1.3. Chemical Injection
- 7.1.4. Microbial Injection
- 7.1.5. Other Technologies
- 7.2. Market Analysis, Insights and Forecast - by Location of Deployment
- 7.2.1. Onshore
- 7.2.2. Offshore
- 7.1. Market Analysis, Insights and Forecast - by Technology
- 8. Asia Pacific EOR Industry Analysis, Insights and Forecast, 2019-2031
- 8.1. Market Analysis, Insights and Forecast - by Technology
- 8.1.1. Gas Injection
- 8.1.2. Thermal Injection
- 8.1.3. Chemical Injection
- 8.1.4. Microbial Injection
- 8.1.5. Other Technologies
- 8.2. Market Analysis, Insights and Forecast - by Location of Deployment
- 8.2.1. Onshore
- 8.2.2. Offshore
- 8.1. Market Analysis, Insights and Forecast - by Technology
- 9. South America EOR Industry Analysis, Insights and Forecast, 2019-2031
- 9.1. Market Analysis, Insights and Forecast - by Technology
- 9.1.1. Gas Injection
- 9.1.2. Thermal Injection
- 9.1.3. Chemical Injection
- 9.1.4. Microbial Injection
- 9.1.5. Other Technologies
- 9.2. Market Analysis, Insights and Forecast - by Location of Deployment
- 9.2.1. Onshore
- 9.2.2. Offshore
- 9.1. Market Analysis, Insights and Forecast - by Technology
- 10. Middle East EOR Industry Analysis, Insights and Forecast, 2019-2031
- 10.1. Market Analysis, Insights and Forecast - by Technology
- 10.1.1. Gas Injection
- 10.1.2. Thermal Injection
- 10.1.3. Chemical Injection
- 10.1.4. Microbial Injection
- 10.1.5. Other Technologies
- 10.2. Market Analysis, Insights and Forecast - by Location of Deployment
- 10.2.1. Onshore
- 10.2.2. Offshore
- 10.1. Market Analysis, Insights and Forecast - by Technology
- 11. North America EOR Industry Analysis, Insights and Forecast, 2019-2031
- 11.1. Market Analysis, Insights and Forecast - By Country/Sub-region
- 11.1.1 United States
- 11.1.2 Canada
- 11.1.3 Mexico
- 12. Europe EOR Industry Analysis, Insights and Forecast, 2019-2031
- 12.1. Market Analysis, Insights and Forecast - By Country/Sub-region
- 12.1.1 Germany
- 12.1.2 United Kingdom
- 12.1.3 France
- 12.1.4 Spain
- 12.1.5 Italy
- 12.1.6 Spain
- 12.1.7 Belgium
- 12.1.8 Netherland
- 12.1.9 Nordics
- 12.1.10 Rest of Europe
- 13. Asia Pacific EOR Industry Analysis, Insights and Forecast, 2019-2031
- 13.1. Market Analysis, Insights and Forecast - By Country/Sub-region
- 13.1.1 China
- 13.1.2 Japan
- 13.1.3 India
- 13.1.4 South Korea
- 13.1.5 Southeast Asia
- 13.1.6 Australia
- 13.1.7 Indonesia
- 13.1.8 Phillipes
- 13.1.9 Singapore
- 13.1.10 Thailandc
- 13.1.11 Rest of Asia Pacific
- 14. South America EOR Industry Analysis, Insights and Forecast, 2019-2031
- 14.1. Market Analysis, Insights and Forecast - By Country/Sub-region
- 14.1.1 Brazil
- 14.1.2 Argentina
- 14.1.3 Peru
- 14.1.4 Chile
- 14.1.5 Colombia
- 14.1.6 Ecuador
- 14.1.7 Venezuela
- 14.1.8 Rest of South America
- 15. North America EOR Industry Analysis, Insights and Forecast, 2019-2031
- 15.1. Market Analysis, Insights and Forecast - By Country/Sub-region
- 15.1.1 United States
- 15.1.2 Canada
- 15.1.3 Mexico
- 16. MEA EOR Industry Analysis, Insights and Forecast, 2019-2031
- 16.1. Market Analysis, Insights and Forecast - By Country/Sub-region
- 16.1.1 United Arab Emirates
- 16.1.2 Saudi Arabia
- 16.1.3 South Africa
- 16.1.4 Rest of Middle East and Africa
- 17. Competitive Analysis
- 17.1. Global Market Share Analysis 2024
- 17.2. Company Profiles
- 17.2.1 Shell PLC
- 17.2.1.1. Overview
- 17.2.1.2. Products
- 17.2.1.3. SWOT Analysis
- 17.2.1.4. Recent Developments
- 17.2.1.5. Financials (Based on Availability)
- 17.2.2 Exxon Mobil Corp
- 17.2.2.1. Overview
- 17.2.2.2. Products
- 17.2.2.3. SWOT Analysis
- 17.2.2.4. Recent Developments
- 17.2.2.5. Financials (Based on Availability)
- 17.2.3 Praxair Technology Inc
- 17.2.3.1. Overview
- 17.2.3.2. Products
- 17.2.3.3. SWOT Analysis
- 17.2.3.4. Recent Developments
- 17.2.3.5. Financials (Based on Availability)
- 17.2.4 Chevron Corporation
- 17.2.4.1. Overview
- 17.2.4.2. Products
- 17.2.4.3. SWOT Analysis
- 17.2.4.4. Recent Developments
- 17.2.4.5. Financials (Based on Availability)
- 17.2.5 Baker Hughes Company
- 17.2.5.1. Overview
- 17.2.5.2. Products
- 17.2.5.3. SWOT Analysis
- 17.2.5.4. Recent Developments
- 17.2.5.5. Financials (Based on Availability)
- 17.2.6 TotalEnergies SE
- 17.2.6.1. Overview
- 17.2.6.2. Products
- 17.2.6.3. SWOT Analysis
- 17.2.6.4. Recent Developments
- 17.2.6.5. Financials (Based on Availability)
- 17.2.7 Halliburton Company
- 17.2.7.1. Overview
- 17.2.7.2. Products
- 17.2.7.3. SWOT Analysis
- 17.2.7.4. Recent Developments
- 17.2.7.5. Financials (Based on Availability)
- 17.2.8 Weatherford International PLC*List Not Exhaustive
- 17.2.8.1. Overview
- 17.2.8.2. Products
- 17.2.8.3. SWOT Analysis
- 17.2.8.4. Recent Developments
- 17.2.8.5. Financials (Based on Availability)
- 17.2.9 BP PLC
- 17.2.9.1. Overview
- 17.2.9.2. Products
- 17.2.9.3. SWOT Analysis
- 17.2.9.4. Recent Developments
- 17.2.9.5. Financials (Based on Availability)
- 17.2.10 Schlumberger Limited
- 17.2.10.1. Overview
- 17.2.10.2. Products
- 17.2.10.3. SWOT Analysis
- 17.2.10.4. Recent Developments
- 17.2.10.5. Financials (Based on Availability)
- 17.2.1 Shell PLC
List of Figures
- Figure 1: Global EOR Industry Revenue Breakdown (Million, %) by Region 2024 & 2032
- Figure 2: North America EOR Industry Revenue (Million), by Country 2024 & 2032
- Figure 3: North America EOR Industry Revenue Share (%), by Country 2024 & 2032
- Figure 4: Europe EOR Industry Revenue (Million), by Country 2024 & 2032
- Figure 5: Europe EOR Industry Revenue Share (%), by Country 2024 & 2032
- Figure 6: Asia Pacific EOR Industry Revenue (Million), by Country 2024 & 2032
- Figure 7: Asia Pacific EOR Industry Revenue Share (%), by Country 2024 & 2032
- Figure 8: South America EOR Industry Revenue (Million), by Country 2024 & 2032
- Figure 9: South America EOR Industry Revenue Share (%), by Country 2024 & 2032
- Figure 10: North America EOR Industry Revenue (Million), by Country 2024 & 2032
- Figure 11: North America EOR Industry Revenue Share (%), by Country 2024 & 2032
- Figure 12: MEA EOR Industry Revenue (Million), by Country 2024 & 2032
- Figure 13: MEA EOR Industry Revenue Share (%), by Country 2024 & 2032
- Figure 14: North America EOR Industry Revenue (Million), by Technology 2024 & 2032
- Figure 15: North America EOR Industry Revenue Share (%), by Technology 2024 & 2032
- Figure 16: North America EOR Industry Revenue (Million), by Location of Deployment 2024 & 2032
- Figure 17: North America EOR Industry Revenue Share (%), by Location of Deployment 2024 & 2032
- Figure 18: North America EOR Industry Revenue (Million), by Country 2024 & 2032
- Figure 19: North America EOR Industry Revenue Share (%), by Country 2024 & 2032
- Figure 20: Europe EOR Industry Revenue (Million), by Technology 2024 & 2032
- Figure 21: Europe EOR Industry Revenue Share (%), by Technology 2024 & 2032
- Figure 22: Europe EOR Industry Revenue (Million), by Location of Deployment 2024 & 2032
- Figure 23: Europe EOR Industry Revenue Share (%), by Location of Deployment 2024 & 2032
- Figure 24: Europe EOR Industry Revenue (Million), by Country 2024 & 2032
- Figure 25: Europe EOR Industry Revenue Share (%), by Country 2024 & 2032
- Figure 26: Asia Pacific EOR Industry Revenue (Million), by Technology 2024 & 2032
- Figure 27: Asia Pacific EOR Industry Revenue Share (%), by Technology 2024 & 2032
- Figure 28: Asia Pacific EOR Industry Revenue (Million), by Location of Deployment 2024 & 2032
- Figure 29: Asia Pacific EOR Industry Revenue Share (%), by Location of Deployment 2024 & 2032
- Figure 30: Asia Pacific EOR Industry Revenue (Million), by Country 2024 & 2032
- Figure 31: Asia Pacific EOR Industry Revenue Share (%), by Country 2024 & 2032
- Figure 32: South America EOR Industry Revenue (Million), by Technology 2024 & 2032
- Figure 33: South America EOR Industry Revenue Share (%), by Technology 2024 & 2032
- Figure 34: South America EOR Industry Revenue (Million), by Location of Deployment 2024 & 2032
- Figure 35: South America EOR Industry Revenue Share (%), by Location of Deployment 2024 & 2032
- Figure 36: South America EOR Industry Revenue (Million), by Country 2024 & 2032
- Figure 37: South America EOR Industry Revenue Share (%), by Country 2024 & 2032
- Figure 38: Middle East EOR Industry Revenue (Million), by Technology 2024 & 2032
- Figure 39: Middle East EOR Industry Revenue Share (%), by Technology 2024 & 2032
- Figure 40: Middle East EOR Industry Revenue (Million), by Location of Deployment 2024 & 2032
- Figure 41: Middle East EOR Industry Revenue Share (%), by Location of Deployment 2024 & 2032
- Figure 42: Middle East EOR Industry Revenue (Million), by Country 2024 & 2032
- Figure 43: Middle East EOR Industry Revenue Share (%), by Country 2024 & 2032
List of Tables
- Table 1: Global EOR Industry Revenue Million Forecast, by Region 2019 & 2032
- Table 2: Global EOR Industry Revenue Million Forecast, by Technology 2019 & 2032
- Table 3: Global EOR Industry Revenue Million Forecast, by Location of Deployment 2019 & 2032
- Table 4: Global EOR Industry Revenue Million Forecast, by Region 2019 & 2032
- Table 5: Global EOR Industry Revenue Million Forecast, by Country 2019 & 2032
- Table 6: United States EOR Industry Revenue (Million) Forecast, by Application 2019 & 2032
- Table 7: Canada EOR Industry Revenue (Million) Forecast, by Application 2019 & 2032
- Table 8: Mexico EOR Industry Revenue (Million) Forecast, by Application 2019 & 2032
- Table 9: Global EOR Industry Revenue Million Forecast, by Country 2019 & 2032
- Table 10: Germany EOR Industry Revenue (Million) Forecast, by Application 2019 & 2032
- Table 11: United Kingdom EOR Industry Revenue (Million) Forecast, by Application 2019 & 2032
- Table 12: France EOR Industry Revenue (Million) Forecast, by Application 2019 & 2032
- Table 13: Spain EOR Industry Revenue (Million) Forecast, by Application 2019 & 2032
- Table 14: Italy EOR Industry Revenue (Million) Forecast, by Application 2019 & 2032
- Table 15: Spain EOR Industry Revenue (Million) Forecast, by Application 2019 & 2032
- Table 16: Belgium EOR Industry Revenue (Million) Forecast, by Application 2019 & 2032
- Table 17: Netherland EOR Industry Revenue (Million) Forecast, by Application 2019 & 2032
- Table 18: Nordics EOR Industry Revenue (Million) Forecast, by Application 2019 & 2032
- Table 19: Rest of Europe EOR Industry Revenue (Million) Forecast, by Application 2019 & 2032
- Table 20: Global EOR Industry Revenue Million Forecast, by Country 2019 & 2032
- Table 21: China EOR Industry Revenue (Million) Forecast, by Application 2019 & 2032
- Table 22: Japan EOR Industry Revenue (Million) Forecast, by Application 2019 & 2032
- Table 23: India EOR Industry Revenue (Million) Forecast, by Application 2019 & 2032
- Table 24: South Korea EOR Industry Revenue (Million) Forecast, by Application 2019 & 2032
- Table 25: Southeast Asia EOR Industry Revenue (Million) Forecast, by Application 2019 & 2032
- Table 26: Australia EOR Industry Revenue (Million) Forecast, by Application 2019 & 2032
- Table 27: Indonesia EOR Industry Revenue (Million) Forecast, by Application 2019 & 2032
- Table 28: Phillipes EOR Industry Revenue (Million) Forecast, by Application 2019 & 2032
- Table 29: Singapore EOR Industry Revenue (Million) Forecast, by Application 2019 & 2032
- Table 30: Thailandc EOR Industry Revenue (Million) Forecast, by Application 2019 & 2032
- Table 31: Rest of Asia Pacific EOR Industry Revenue (Million) Forecast, by Application 2019 & 2032
- Table 32: Global EOR Industry Revenue Million Forecast, by Country 2019 & 2032
- Table 33: Brazil EOR Industry Revenue (Million) Forecast, by Application 2019 & 2032
- Table 34: Argentina EOR Industry Revenue (Million) Forecast, by Application 2019 & 2032
- Table 35: Peru EOR Industry Revenue (Million) Forecast, by Application 2019 & 2032
- Table 36: Chile EOR Industry Revenue (Million) Forecast, by Application 2019 & 2032
- Table 37: Colombia EOR Industry Revenue (Million) Forecast, by Application 2019 & 2032
- Table 38: Ecuador EOR Industry Revenue (Million) Forecast, by Application 2019 & 2032
- Table 39: Venezuela EOR Industry Revenue (Million) Forecast, by Application 2019 & 2032
- Table 40: Rest of South America EOR Industry Revenue (Million) Forecast, by Application 2019 & 2032
- Table 41: Global EOR Industry Revenue Million Forecast, by Country 2019 & 2032
- Table 42: United States EOR Industry Revenue (Million) Forecast, by Application 2019 & 2032
- Table 43: Canada EOR Industry Revenue (Million) Forecast, by Application 2019 & 2032
- Table 44: Mexico EOR Industry Revenue (Million) Forecast, by Application 2019 & 2032
- Table 45: Global EOR Industry Revenue Million Forecast, by Country 2019 & 2032
- Table 46: United Arab Emirates EOR Industry Revenue (Million) Forecast, by Application 2019 & 2032
- Table 47: Saudi Arabia EOR Industry Revenue (Million) Forecast, by Application 2019 & 2032
- Table 48: South Africa EOR Industry Revenue (Million) Forecast, by Application 2019 & 2032
- Table 49: Rest of Middle East and Africa EOR Industry Revenue (Million) Forecast, by Application 2019 & 2032
- Table 50: Global EOR Industry Revenue Million Forecast, by Technology 2019 & 2032
- Table 51: Global EOR Industry Revenue Million Forecast, by Location of Deployment 2019 & 2032
- Table 52: Global EOR Industry Revenue Million Forecast, by Country 2019 & 2032
- Table 53: Global EOR Industry Revenue Million Forecast, by Technology 2019 & 2032
- Table 54: Global EOR Industry Revenue Million Forecast, by Location of Deployment 2019 & 2032
- Table 55: Global EOR Industry Revenue Million Forecast, by Country 2019 & 2032
- Table 56: Global EOR Industry Revenue Million Forecast, by Technology 2019 & 2032
- Table 57: Global EOR Industry Revenue Million Forecast, by Location of Deployment 2019 & 2032
- Table 58: Global EOR Industry Revenue Million Forecast, by Country 2019 & 2032
- Table 59: Global EOR Industry Revenue Million Forecast, by Technology 2019 & 2032
- Table 60: Global EOR Industry Revenue Million Forecast, by Location of Deployment 2019 & 2032
- Table 61: Global EOR Industry Revenue Million Forecast, by Country 2019 & 2032
- Table 62: Global EOR Industry Revenue Million Forecast, by Technology 2019 & 2032
- Table 63: Global EOR Industry Revenue Million Forecast, by Location of Deployment 2019 & 2032
- Table 64: Global EOR Industry Revenue Million Forecast, by Country 2019 & 2032
Frequently Asked Questions
1. What is the projected Compound Annual Growth Rate (CAGR) of the EOR Industry?
The projected CAGR is approximately > 2.00%.
2. Which companies are prominent players in the EOR Industry?
Key companies in the market include Shell PLC, Exxon Mobil Corp, Praxair Technology Inc, Chevron Corporation, Baker Hughes Company, TotalEnergies SE, Halliburton Company, Weatherford International PLC*List Not Exhaustive, BP PLC, Schlumberger Limited.
3. What are the main segments of the EOR Industry?
The market segments include Technology, Location of Deployment.
4. Can you provide details about the market size?
The market size is estimated to be USD XX Million as of 2022.
5. What are some drivers contributing to market growth?
4.; Rapid Recovery in the Oil and Gas and Mining Industries4.; Surge in the Construction Industry.
6. What are the notable trends driving market growth?
Gas Injection Technique to Dominate the Market.
7. Are there any restraints impacting market growth?
4.; High Maintenance and Operation Costs of Submersible Pump Restrain the Market.
8. Can you provide examples of recent developments in the market?
In July 2021, Sinopec launched China's largest carbon capture, storage, and utilization (CCUS) project. The scheme involves sending carbon dioxide captured at a petrochemical refinery to the Shengli oilfield, where it will be reinjected as part of the field's enhanced oil recovery program.
9. What pricing options are available for accessing the report?
Pricing options include single-user, multi-user, and enterprise licenses priced at USD 4750, USD 5250, and USD 8750 respectively.
10. Is the market size provided in terms of value or volume?
The market size is provided in terms of value, measured in Million.
11. Are there any specific market keywords associated with the report?
Yes, the market keyword associated with the report is "EOR Industry," which aids in identifying and referencing the specific market segment covered.
12. How do I determine which pricing option suits my needs best?
The pricing options vary based on user requirements and access needs. Individual users may opt for single-user licenses, while businesses requiring broader access may choose multi-user or enterprise licenses for cost-effective access to the report.
13. Are there any additional resources or data provided in the EOR Industry report?
While the report offers comprehensive insights, it's advisable to review the specific contents or supplementary materials provided to ascertain if additional resources or data are available.
14. How can I stay updated on further developments or reports in the EOR Industry?
To stay informed about further developments, trends, and reports in the EOR Industry, consider subscribing to industry newsletters, following relevant companies and organizations, or regularly checking reputable industry news sources and publications.
Methodology
Step 1 - Identification of Relevant Samples Size from Population Database


Step 2 - Approaches for Defining Global Market Size (Value, Volume* & Price*)

Note*: In applicable scenarios
Step 3 - Data Sources
Primary Research
- Web Analytics
- Survey Reports
- Research Institute
- Latest Research Reports
- Opinion Leaders
Secondary Research
- Annual Reports
- White Paper
- Latest Press Release
- Industry Association
- Paid Database
- Investor Presentations

Step 4 - Data Triangulation
Involves using different sources of information in order to increase the validity of a study
These sources are likely to be stakeholders in a program - participants, other researchers, program staff, other community members, and so on.
Then we put all data in single framework & apply various statistical tools to find out the dynamic on the market.
During the analysis stage, feedback from the stakeholder groups would be compared to determine areas of agreement as well as areas of divergence


