
Key Insights
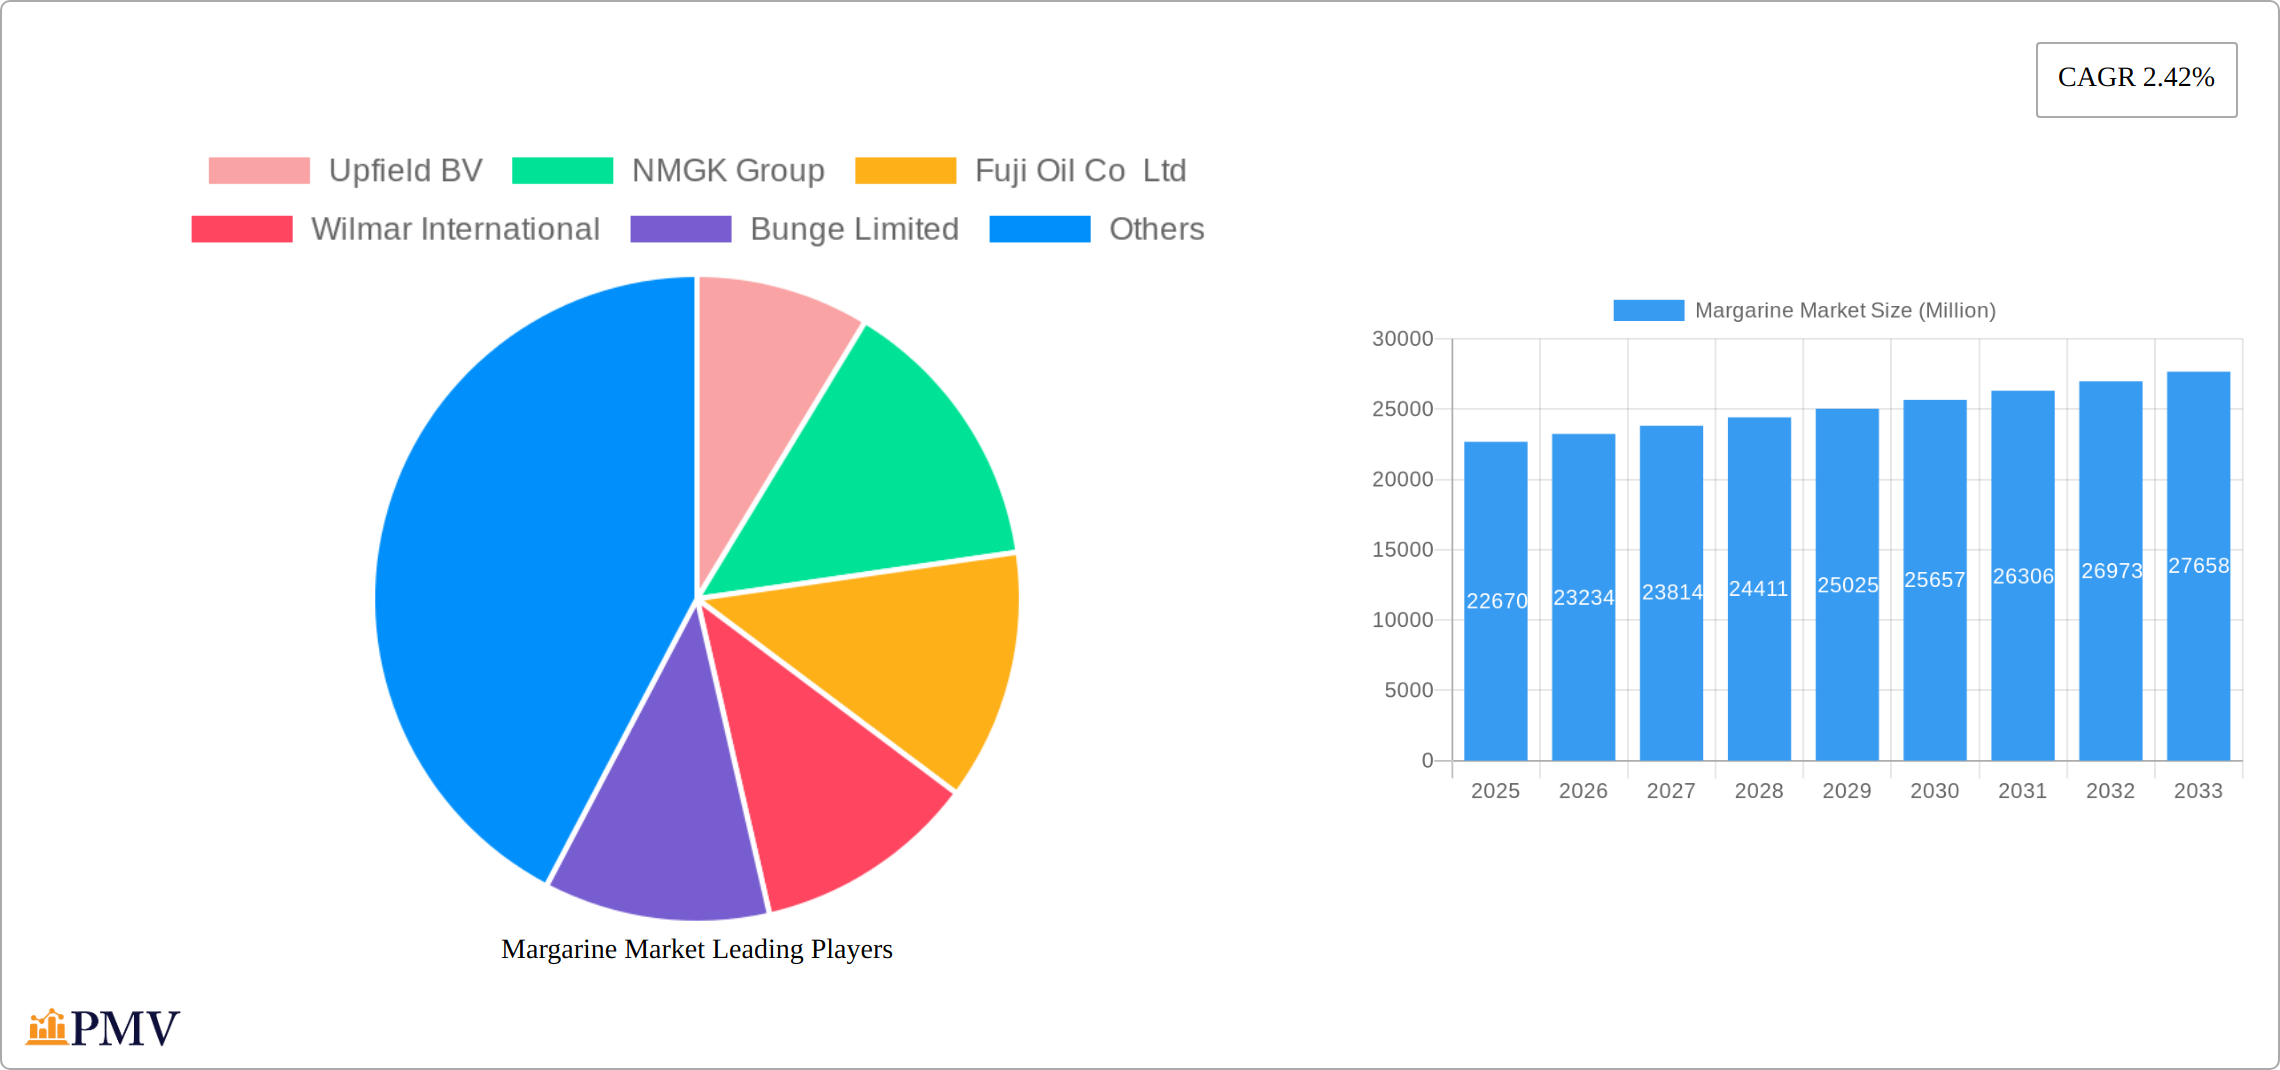
The global margarine market, valued at $22.67 billion in 2025, is projected to experience steady growth, driven by several key factors. Increasing health consciousness is fueling demand for healthier margarine alternatives with reduced saturated and trans fats, while the rising popularity of plant-based diets is further boosting consumption. The food service industry (HoReCa) and industrial baking sectors represent significant market segments, relying heavily on margarine for its functional properties in various food applications. Geographic distribution reveals a strong presence in developed regions like North America and Europe, with Asia-Pacific showing considerable potential for future growth due to increasing urbanization and changing dietary habits. However, fluctuating raw material prices, particularly vegetable oils, pose a significant challenge to market stability. Competition among major players like Upfield BV, NMGK Group, and Wilmar International is intense, leading to innovative product development and strategic partnerships to maintain market share. The market segmentation, encompassing hard, soft, and liquid margarines, allows manufacturers to cater to diverse consumer preferences and culinary uses. While the forecast period (2025-2033) projects a moderate CAGR of 2.42%, specific growth rates will vary by region and product type, influenced by economic conditions and evolving consumer trends. Over the forecast period, we expect the demand for healthier options and innovative product formulations to stimulate further market expansion.
The projected growth trajectory considers factors including increasing disposable incomes, particularly in developing economies, contributing to higher spending on processed and convenience foods. The market's evolution is also shaped by the ongoing efforts of manufacturers to enhance product quality and expand distribution channels to reach a broader consumer base. While challenges like fluctuating raw material costs and increasing competition will persist, the overall outlook for the margarine market remains positive, driven by consistent demand across various application segments and regions.
Margarine Market: A Comprehensive Report 2019-2033
This comprehensive report provides an in-depth analysis of the global margarine market, covering the period 2019-2033. With a base year of 2025 and a forecast period spanning 2025-2033, this study offers valuable insights into market dynamics, competitive landscapes, and future growth opportunities. The report leverages rigorous research methodologies and incorporates data from various credible sources to deliver actionable intelligence for industry stakeholders. Key players like Upfield BV, NMGK Group, Fuji Oil Co Ltd, Wilmar International, Bunge Limited, Conagra Brands Inc, Associated British Foods, Vandemoortele, Puratos NV, BRF SA, and Richardson International Limited are analyzed within the context of market segments including hard, soft, and liquid margarine, distributed through HoReCa, industrial channels, and to household consumers.
Margarine Market Market Structure & Competitive Dynamics
The global margarine market exhibits a moderately concentrated structure, with a few major players holding significant market share. The market is characterized by intense competition, driven by factors such as brand loyalty, pricing strategies, and product differentiation. Innovation plays a crucial role, with companies continuously introducing new products with improved nutritional profiles and flavors to cater to evolving consumer preferences. Regulatory frameworks concerning fat content, labeling, and sustainable sourcing significantly impact market dynamics. The presence of substitute products like butter and other spreads creates additional competitive pressure. Mergers and acquisitions (M&A) activities have been relatively frequent, reflecting consolidation efforts and expansion strategies within the industry. For instance, the acquisition of Pinnacle Foods by Conagra Brands significantly reshaped the market landscape. While precise M&A deal values are unavailable for the entirety of the study period (2019-2024), estimated deal values averaged xx Million annually during this period. Market share data for key players fluctuates, with Upfield BV holding an estimated xx% share in 2025, followed by Wilmar International at xx% and Bunge Limited at xx%. The competitive intensity is further fueled by continuous innovation, resulting in a dynamic market structure characterized by strategic alliances and collaborations.
Margarine Market Industry Trends & Insights
The global margarine market is poised for significant growth, projected to achieve a Compound Annual Growth Rate (CAGR) of [Insert Updated CAGR]% during the forecast period (2025-2033). This expansion is fueled by several key factors. The increasing demand for convenient and cost-effective cooking alternatives remains a primary driver. Furthermore, significant advancements in margarine processing and formulation have resulted in healthier products with reduced saturated and trans-fat content, directly addressing growing health concerns. This aligns perfectly with the global shift towards healthier diets and the rise of health-conscious consumers. The expanding utilization of margarine in food processing and industrial applications further contributes to market expansion. Strong market penetration, particularly within developing economies, presents substantial growth opportunities. The competitive landscape is dynamic, with companies strategically focusing on product differentiation and robust brand building to secure market share. The surge in plant-based alternatives and a heightened awareness of sustainability are driving innovation and influencing consumer purchasing decisions. As of 2025, the global margarine market is estimated at [Insert Updated Market Size] Million.
Dominant Markets & Segments in Margarine Market
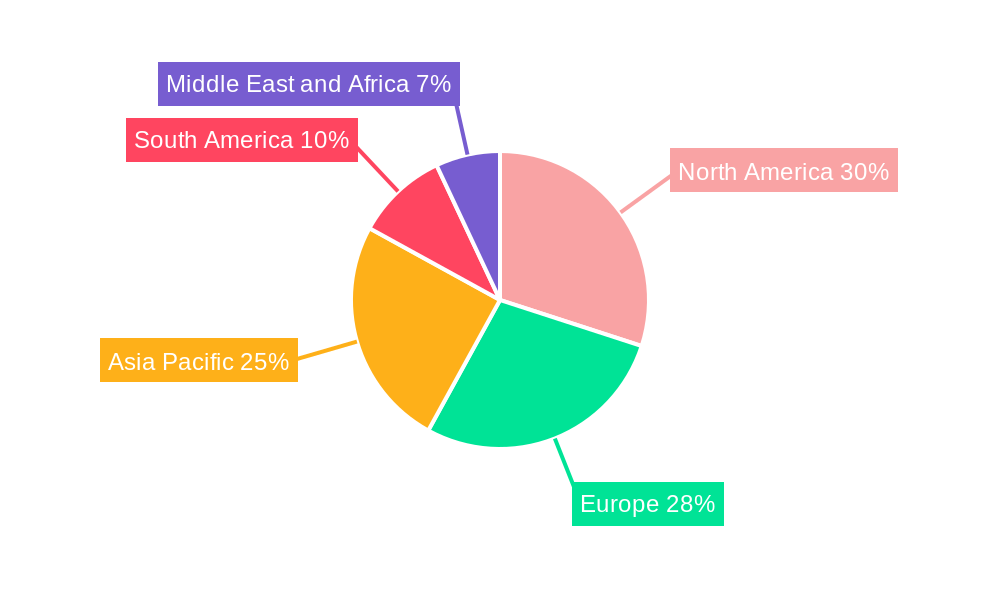
Market dominance within the margarine sector varies geographically and depends on specific criteria. In 2025, the household consumer segment constitutes the largest global market share, driven by high consumption rates and widespread product availability. North America and Europe remain leading markets, collectively accounting for [Insert Updated Percentage]% of the global market share. This dominance stems from well-established distribution networks and high per capita consumption. However, the Asia-Pacific region demonstrates substantial growth potential, fueled by population growth, rising disposable incomes, and evolving dietary preferences. Within distribution channels, the industrial segment exhibits strong growth, largely driven by the increasing demand for margarine in food manufacturing.
- Key Drivers of Regional Dominance:
- North America: Established retail infrastructure, high per capita consumption, and a strong presence of major manufacturers.
- Europe: A large consumer base, preference for convenient cooking alternatives, and a sophisticated food processing industry.
- Asia-Pacific: Rapid economic expansion, increasing urbanization, evolving dietary habits, and a burgeoning food processing sector.
The soft margarine segment maintains a significant market share, benefiting from its versatility in various culinary applications.
Margarine Market Product Innovations
Recent innovations in the margarine market focus on improving nutritional profiles, reducing trans-fat content, and enhancing taste and texture. Companies are increasingly incorporating healthier oils and fats, resulting in products with enhanced functional and nutritional properties. Technological advancements in production processes enable the creation of more sustainable and cost-effective margarine varieties. These developments directly address changing consumer preferences and bolster market competitiveness. The focus is on clean-label ingredients, appealing to health-conscious consumers seeking natural and minimally processed foods.
Report Segmentation & Scope
This report segments the margarine market across several key parameters:
- By Type: Hard Margarine, Soft Margarine, Liquid Margarine. Growth projections vary across these segments, with soft margarine exhibiting strong growth due to consumer preference. Market sizes for each segment in 2025 are estimated to be xx Million (Hard), xx Million (Soft), and xx Million (Liquid).
- By End User: Household Consumers, Industrial. The household consumer segment accounts for the largest market share, while the industrial segment exhibits robust growth potential.
- By Distribution Channel: HoReCa (Hotels, Restaurants, Catering), Industrial. The industrial channel shows substantial growth due to increasing margarine demand in food manufacturing.
Competitive dynamics within each segment are analyzed, highlighting key players and their respective market strategies.
Key Drivers of Margarine Market Growth
Several factors contribute to the margarine market's growth. Technological advancements in manufacturing processes result in cost-efficient production and improved product quality. Economic factors, such as rising disposable incomes in developing economies, increase the affordability of margarine, boosting demand. Furthermore, supportive regulatory frameworks facilitate market expansion and encourage innovation.
Challenges in the Margarine Market Sector
The margarine market faces several challenges that impact growth. Fluctuations in raw material prices, especially palm oil, significantly affect production costs and profitability. Manufacturers also grapple with stringent regulatory requirements concerning labeling and health claims, leading to increased compliance costs. Intense competition, coupled with the rising popularity of alternative spreads and butter, exerts pressure on market share and pricing. These factors collectively moderate market growth, influencing the overall expansion rate.
Leading Players in the Margarine Market Market
- Upfield BV
- NMGK Group
- Fuji Oil Co Ltd
- Wilmar International
- Bunge Limited
- Conagra Brands Inc
- Associated British Foods
- Vandemoortele
- Puratos NV
- BRF SA
- Richardson International Limited
Key Developments in Margarine Market Sector
- [Year/Month]: Upfield's partnership with IBM Food Trust to enhance supply chain transparency. This initiative aims to increase consumer trust and improve supply chain efficiency.
- [Year/Month]: Conagra Brands' acquisition of Pinnacle Foods to expand its margarine portfolio. This merger strengthened Conagra's market position and broadened its product offerings.
- [Year/Month]: Bunge's focus on sustainable palm oil production in response to environmental concerns. This commitment to sustainable practices addresses growing consumer demand for environmentally friendly products.
Strategic Margarine Market Market Outlook
The future of the margarine market looks promising, driven by continuous innovation, evolving consumer preferences, and the increasing demand for convenient and affordable cooking options. Opportunities exist in developing healthier, more sustainable, and innovative margarine products that meet the evolving needs of health-conscious consumers. Strategic partnerships and collaborations can further drive market growth and enhance competitiveness. The focus on sustainability, product differentiation, and targeted marketing strategies will be crucial for success in the years to come. The market's continued growth is expected to be driven by both existing and emerging markets, creating attractive opportunities for established players and new entrants alike.
Margarine Market Segmentation
-
1. Type
- 1.1. Hard
- 1.2. Soft
- 1.3. Liquid
-
2. End User
-
2.1. Household Consumers
- 2.1.1. Supermarkets/hypermarkets
- 2.1.2. Convenience/Grocery Stores
- 2.1.3. Online Retail Stores
- 2.1.4. Other Distribution Channels
- 2.2. HoReCa
- 2.3. Industrial
-
2.1. Household Consumers
Margarine Market Segmentation By Geography
-
1. North America
- 1.1. United States
- 1.2. Canada
- 1.3. Mexico
- 1.4. Rest of North America
-
2. Europe
- 2.1. United Kingdom
- 2.2. Germany
- 2.3. France
- 2.4. Russia
- 2.5. Italy
- 2.6. Spain
- 2.7. Rest of Europe
-
3. Asia Pacific
- 3.1. India
- 3.2. China
- 3.3. Japan
- 3.4. Australia
- 3.5. Rest of Asia Pacific
-
4. South America
- 4.1. Brazil
- 4.2. Argentina
- 4.3. Rest of South America
-
5. Middle East and Africa
- 5.1. South Africa
- 5.2. United Arab Emirates
- 5.3. Rest of Middle East and Africa
Margarine Market REPORT HIGHLIGHTS
| Aspects | Details |
|---|---|
| Study Period | 2019-2033 |
| Base Year | 2024 |
| Estimated Year | 2025 |
| Forecast Period | 2025-2033 |
| Historical Period | 2019-2024 |
| Growth Rate | CAGR of 2.42% from 2019-2033 |
| Segmentation |
|
Table of Contents
- 1. Introduction
- 1.1. Research Scope
- 1.2. Market Segmentation
- 1.3. Research Methodology
- 1.4. Definitions and Assumptions
- 2. Executive Summary
- 2.1. Introduction
- 3. Market Dynamics
- 3.1. Introduction
- 3.2. Market Drivers
- 3.2.1. Growing Demand for Bakery and Confectionery Products; Increasing Awareness about the benefits of Vegetarian and Vegan Diets
- 3.3. Market Restrains
- 3.3.1. Stringent Regulations for Consumption of Trans-Fats
- 3.4. Market Trends
- 3.4.1. Rising Demand for Sustainable Foods
- 4. Market Factor Analysis
- 4.1. Porters Five Forces
- 4.2. Supply/Value Chain
- 4.3. PESTEL analysis
- 4.4. Market Entropy
- 4.5. Patent/Trademark Analysis
- 5. Global Margarine Market Analysis, Insights and Forecast, 2019-2031
- 5.1. Market Analysis, Insights and Forecast - by Type
- 5.1.1. Hard
- 5.1.2. Soft
- 5.1.3. Liquid
- 5.2. Market Analysis, Insights and Forecast - by End User
- 5.2.1. Household Consumers
- 5.2.1.1. Supermarkets/hypermarkets
- 5.2.1.2. Convenience/Grocery Stores
- 5.2.1.3. Online Retail Stores
- 5.2.1.4. Other Distribution Channels
- 5.2.2. HoReCa
- 5.2.3. Industrial
- 5.2.1. Household Consumers
- 5.3. Market Analysis, Insights and Forecast - by Region
- 5.3.1. North America
- 5.3.2. Europe
- 5.3.3. Asia Pacific
- 5.3.4. South America
- 5.3.5. Middle East and Africa
- 5.1. Market Analysis, Insights and Forecast - by Type
- 6. North America Margarine Market Analysis, Insights and Forecast, 2019-2031
- 6.1. Market Analysis, Insights and Forecast - by Type
- 6.1.1. Hard
- 6.1.2. Soft
- 6.1.3. Liquid
- 6.2. Market Analysis, Insights and Forecast - by End User
- 6.2.1. Household Consumers
- 6.2.1.1. Supermarkets/hypermarkets
- 6.2.1.2. Convenience/Grocery Stores
- 6.2.1.3. Online Retail Stores
- 6.2.1.4. Other Distribution Channels
- 6.2.2. HoReCa
- 6.2.3. Industrial
- 6.2.1. Household Consumers
- 6.1. Market Analysis, Insights and Forecast - by Type
- 7. Europe Margarine Market Analysis, Insights and Forecast, 2019-2031
- 7.1. Market Analysis, Insights and Forecast - by Type
- 7.1.1. Hard
- 7.1.2. Soft
- 7.1.3. Liquid
- 7.2. Market Analysis, Insights and Forecast - by End User
- 7.2.1. Household Consumers
- 7.2.1.1. Supermarkets/hypermarkets
- 7.2.1.2. Convenience/Grocery Stores
- 7.2.1.3. Online Retail Stores
- 7.2.1.4. Other Distribution Channels
- 7.2.2. HoReCa
- 7.2.3. Industrial
- 7.2.1. Household Consumers
- 7.1. Market Analysis, Insights and Forecast - by Type
- 8. Asia Pacific Margarine Market Analysis, Insights and Forecast, 2019-2031
- 8.1. Market Analysis, Insights and Forecast - by Type
- 8.1.1. Hard
- 8.1.2. Soft
- 8.1.3. Liquid
- 8.2. Market Analysis, Insights and Forecast - by End User
- 8.2.1. Household Consumers
- 8.2.1.1. Supermarkets/hypermarkets
- 8.2.1.2. Convenience/Grocery Stores
- 8.2.1.3. Online Retail Stores
- 8.2.1.4. Other Distribution Channels
- 8.2.2. HoReCa
- 8.2.3. Industrial
- 8.2.1. Household Consumers
- 8.1. Market Analysis, Insights and Forecast - by Type
- 9. South America Margarine Market Analysis, Insights and Forecast, 2019-2031
- 9.1. Market Analysis, Insights and Forecast - by Type
- 9.1.1. Hard
- 9.1.2. Soft
- 9.1.3. Liquid
- 9.2. Market Analysis, Insights and Forecast - by End User
- 9.2.1. Household Consumers
- 9.2.1.1. Supermarkets/hypermarkets
- 9.2.1.2. Convenience/Grocery Stores
- 9.2.1.3. Online Retail Stores
- 9.2.1.4. Other Distribution Channels
- 9.2.2. HoReCa
- 9.2.3. Industrial
- 9.2.1. Household Consumers
- 9.1. Market Analysis, Insights and Forecast - by Type
- 10. Middle East and Africa Margarine Market Analysis, Insights and Forecast, 2019-2031
- 10.1. Market Analysis, Insights and Forecast - by Type
- 10.1.1. Hard
- 10.1.2. Soft
- 10.1.3. Liquid
- 10.2. Market Analysis, Insights and Forecast - by End User
- 10.2.1. Household Consumers
- 10.2.1.1. Supermarkets/hypermarkets
- 10.2.1.2. Convenience/Grocery Stores
- 10.2.1.3. Online Retail Stores
- 10.2.1.4. Other Distribution Channels
- 10.2.2. HoReCa
- 10.2.3. Industrial
- 10.2.1. Household Consumers
- 10.1. Market Analysis, Insights and Forecast - by Type
- 11. North America Margarine Market Analysis, Insights and Forecast, 2019-2031
- 11.1. Market Analysis, Insights and Forecast - By Country/Sub-region
- 11.1.1 United States
- 11.1.2 Canada
- 11.1.3 Mexico
- 11.1.4 Rest of North America
- 12. Europe Margarine Market Analysis, Insights and Forecast, 2019-2031
- 12.1. Market Analysis, Insights and Forecast - By Country/Sub-region
- 12.1.1 United Kingdom
- 12.1.2 Germany
- 12.1.3 France
- 12.1.4 Russia
- 12.1.5 Italy
- 12.1.6 Spain
- 12.1.7 Rest of Europe
- 13. Asia Pacific Margarine Market Analysis, Insights and Forecast, 2019-2031
- 13.1. Market Analysis, Insights and Forecast - By Country/Sub-region
- 13.1.1 India
- 13.1.2 China
- 13.1.3 Japan
- 13.1.4 Australia
- 13.1.5 Rest of Asia Pacific
- 14. South America Margarine Market Analysis, Insights and Forecast, 2019-2031
- 14.1. Market Analysis, Insights and Forecast - By Country/Sub-region
- 14.1.1 Brazil
- 14.1.2 Argentina
- 14.1.3 Rest of South America
- 15. Middle East and Africa Margarine Market Analysis, Insights and Forecast, 2019-2031
- 15.1. Market Analysis, Insights and Forecast - By Country/Sub-region
- 15.1.1 South Africa
- 15.1.2 United Arab Emirates
- 15.1.3 Rest of Middle East and Africa
- 16. Competitive Analysis
- 16.1. Global Market Share Analysis 2024
- 16.2. Company Profiles
- 16.2.1 Upfield BV
- 16.2.1.1. Overview
- 16.2.1.2. Products
- 16.2.1.3. SWOT Analysis
- 16.2.1.4. Recent Developments
- 16.2.1.5. Financials (Based on Availability)
- 16.2.2 NMGK Group
- 16.2.2.1. Overview
- 16.2.2.2. Products
- 16.2.2.3. SWOT Analysis
- 16.2.2.4. Recent Developments
- 16.2.2.5. Financials (Based on Availability)
- 16.2.3 Fuji Oil Co Ltd
- 16.2.3.1. Overview
- 16.2.3.2. Products
- 16.2.3.3. SWOT Analysis
- 16.2.3.4. Recent Developments
- 16.2.3.5. Financials (Based on Availability)
- 16.2.4 Wilmar International
- 16.2.4.1. Overview
- 16.2.4.2. Products
- 16.2.4.3. SWOT Analysis
- 16.2.4.4. Recent Developments
- 16.2.4.5. Financials (Based on Availability)
- 16.2.5 Bunge Limited
- 16.2.5.1. Overview
- 16.2.5.2. Products
- 16.2.5.3. SWOT Analysis
- 16.2.5.4. Recent Developments
- 16.2.5.5. Financials (Based on Availability)
- 16.2.6 Conagra Brands Inc
- 16.2.6.1. Overview
- 16.2.6.2. Products
- 16.2.6.3. SWOT Analysis
- 16.2.6.4. Recent Developments
- 16.2.6.5. Financials (Based on Availability)
- 16.2.7 Associated British Foods
- 16.2.7.1. Overview
- 16.2.7.2. Products
- 16.2.7.3. SWOT Analysis
- 16.2.7.4. Recent Developments
- 16.2.7.5. Financials (Based on Availability)
- 16.2.8 Vandemoortele*List Not Exhaustive
- 16.2.8.1. Overview
- 16.2.8.2. Products
- 16.2.8.3. SWOT Analysis
- 16.2.8.4. Recent Developments
- 16.2.8.5. Financials (Based on Availability)
- 16.2.9 Puratos NV
- 16.2.9.1. Overview
- 16.2.9.2. Products
- 16.2.9.3. SWOT Analysis
- 16.2.9.4. Recent Developments
- 16.2.9.5. Financials (Based on Availability)
- 16.2.10 BRF SA
- 16.2.10.1. Overview
- 16.2.10.2. Products
- 16.2.10.3. SWOT Analysis
- 16.2.10.4. Recent Developments
- 16.2.10.5. Financials (Based on Availability)
- 16.2.11 Richardson International Limited
- 16.2.11.1. Overview
- 16.2.11.2. Products
- 16.2.11.3. SWOT Analysis
- 16.2.11.4. Recent Developments
- 16.2.11.5. Financials (Based on Availability)
- 16.2.1 Upfield BV
List of Figures
- Figure 1: Global Margarine Market Revenue Breakdown (Million, %) by Region 2024 & 2032
- Figure 2: Global Margarine Market Volume Breakdown (K Tons, %) by Region 2024 & 2032
- Figure 3: North America Margarine Market Revenue (Million), by Country 2024 & 2032
- Figure 4: North America Margarine Market Volume (K Tons), by Country 2024 & 2032
- Figure 5: North America Margarine Market Revenue Share (%), by Country 2024 & 2032
- Figure 6: North America Margarine Market Volume Share (%), by Country 2024 & 2032
- Figure 7: Europe Margarine Market Revenue (Million), by Country 2024 & 2032
- Figure 8: Europe Margarine Market Volume (K Tons), by Country 2024 & 2032
- Figure 9: Europe Margarine Market Revenue Share (%), by Country 2024 & 2032
- Figure 10: Europe Margarine Market Volume Share (%), by Country 2024 & 2032
- Figure 11: Asia Pacific Margarine Market Revenue (Million), by Country 2024 & 2032
- Figure 12: Asia Pacific Margarine Market Volume (K Tons), by Country 2024 & 2032
- Figure 13: Asia Pacific Margarine Market Revenue Share (%), by Country 2024 & 2032
- Figure 14: Asia Pacific Margarine Market Volume Share (%), by Country 2024 & 2032
- Figure 15: South America Margarine Market Revenue (Million), by Country 2024 & 2032
- Figure 16: South America Margarine Market Volume (K Tons), by Country 2024 & 2032
- Figure 17: South America Margarine Market Revenue Share (%), by Country 2024 & 2032
- Figure 18: South America Margarine Market Volume Share (%), by Country 2024 & 2032
- Figure 19: Middle East and Africa Margarine Market Revenue (Million), by Country 2024 & 2032
- Figure 20: Middle East and Africa Margarine Market Volume (K Tons), by Country 2024 & 2032
- Figure 21: Middle East and Africa Margarine Market Revenue Share (%), by Country 2024 & 2032
- Figure 22: Middle East and Africa Margarine Market Volume Share (%), by Country 2024 & 2032
- Figure 23: North America Margarine Market Revenue (Million), by Type 2024 & 2032
- Figure 24: North America Margarine Market Volume (K Tons), by Type 2024 & 2032
- Figure 25: North America Margarine Market Revenue Share (%), by Type 2024 & 2032
- Figure 26: North America Margarine Market Volume Share (%), by Type 2024 & 2032
- Figure 27: North America Margarine Market Revenue (Million), by End User 2024 & 2032
- Figure 28: North America Margarine Market Volume (K Tons), by End User 2024 & 2032
- Figure 29: North America Margarine Market Revenue Share (%), by End User 2024 & 2032
- Figure 30: North America Margarine Market Volume Share (%), by End User 2024 & 2032
- Figure 31: North America Margarine Market Revenue (Million), by Country 2024 & 2032
- Figure 32: North America Margarine Market Volume (K Tons), by Country 2024 & 2032
- Figure 33: North America Margarine Market Revenue Share (%), by Country 2024 & 2032
- Figure 34: North America Margarine Market Volume Share (%), by Country 2024 & 2032
- Figure 35: Europe Margarine Market Revenue (Million), by Type 2024 & 2032
- Figure 36: Europe Margarine Market Volume (K Tons), by Type 2024 & 2032
- Figure 37: Europe Margarine Market Revenue Share (%), by Type 2024 & 2032
- Figure 38: Europe Margarine Market Volume Share (%), by Type 2024 & 2032
- Figure 39: Europe Margarine Market Revenue (Million), by End User 2024 & 2032
- Figure 40: Europe Margarine Market Volume (K Tons), by End User 2024 & 2032
- Figure 41: Europe Margarine Market Revenue Share (%), by End User 2024 & 2032
- Figure 42: Europe Margarine Market Volume Share (%), by End User 2024 & 2032
- Figure 43: Europe Margarine Market Revenue (Million), by Country 2024 & 2032
- Figure 44: Europe Margarine Market Volume (K Tons), by Country 2024 & 2032
- Figure 45: Europe Margarine Market Revenue Share (%), by Country 2024 & 2032
- Figure 46: Europe Margarine Market Volume Share (%), by Country 2024 & 2032
- Figure 47: Asia Pacific Margarine Market Revenue (Million), by Type 2024 & 2032
- Figure 48: Asia Pacific Margarine Market Volume (K Tons), by Type 2024 & 2032
- Figure 49: Asia Pacific Margarine Market Revenue Share (%), by Type 2024 & 2032
- Figure 50: Asia Pacific Margarine Market Volume Share (%), by Type 2024 & 2032
- Figure 51: Asia Pacific Margarine Market Revenue (Million), by End User 2024 & 2032
- Figure 52: Asia Pacific Margarine Market Volume (K Tons), by End User 2024 & 2032
- Figure 53: Asia Pacific Margarine Market Revenue Share (%), by End User 2024 & 2032
- Figure 54: Asia Pacific Margarine Market Volume Share (%), by End User 2024 & 2032
- Figure 55: Asia Pacific Margarine Market Revenue (Million), by Country 2024 & 2032
- Figure 56: Asia Pacific Margarine Market Volume (K Tons), by Country 2024 & 2032
- Figure 57: Asia Pacific Margarine Market Revenue Share (%), by Country 2024 & 2032
- Figure 58: Asia Pacific Margarine Market Volume Share (%), by Country 2024 & 2032
- Figure 59: South America Margarine Market Revenue (Million), by Type 2024 & 2032
- Figure 60: South America Margarine Market Volume (K Tons), by Type 2024 & 2032
- Figure 61: South America Margarine Market Revenue Share (%), by Type 2024 & 2032
- Figure 62: South America Margarine Market Volume Share (%), by Type 2024 & 2032
- Figure 63: South America Margarine Market Revenue (Million), by End User 2024 & 2032
- Figure 64: South America Margarine Market Volume (K Tons), by End User 2024 & 2032
- Figure 65: South America Margarine Market Revenue Share (%), by End User 2024 & 2032
- Figure 66: South America Margarine Market Volume Share (%), by End User 2024 & 2032
- Figure 67: South America Margarine Market Revenue (Million), by Country 2024 & 2032
- Figure 68: South America Margarine Market Volume (K Tons), by Country 2024 & 2032
- Figure 69: South America Margarine Market Revenue Share (%), by Country 2024 & 2032
- Figure 70: South America Margarine Market Volume Share (%), by Country 2024 & 2032
- Figure 71: Middle East and Africa Margarine Market Revenue (Million), by Type 2024 & 2032
- Figure 72: Middle East and Africa Margarine Market Volume (K Tons), by Type 2024 & 2032
- Figure 73: Middle East and Africa Margarine Market Revenue Share (%), by Type 2024 & 2032
- Figure 74: Middle East and Africa Margarine Market Volume Share (%), by Type 2024 & 2032
- Figure 75: Middle East and Africa Margarine Market Revenue (Million), by End User 2024 & 2032
- Figure 76: Middle East and Africa Margarine Market Volume (K Tons), by End User 2024 & 2032
- Figure 77: Middle East and Africa Margarine Market Revenue Share (%), by End User 2024 & 2032
- Figure 78: Middle East and Africa Margarine Market Volume Share (%), by End User 2024 & 2032
- Figure 79: Middle East and Africa Margarine Market Revenue (Million), by Country 2024 & 2032
- Figure 80: Middle East and Africa Margarine Market Volume (K Tons), by Country 2024 & 2032
- Figure 81: Middle East and Africa Margarine Market Revenue Share (%), by Country 2024 & 2032
- Figure 82: Middle East and Africa Margarine Market Volume Share (%), by Country 2024 & 2032
List of Tables
- Table 1: Global Margarine Market Revenue Million Forecast, by Region 2019 & 2032
- Table 2: Global Margarine Market Volume K Tons Forecast, by Region 2019 & 2032
- Table 3: Global Margarine Market Revenue Million Forecast, by Type 2019 & 2032
- Table 4: Global Margarine Market Volume K Tons Forecast, by Type 2019 & 2032
- Table 5: Global Margarine Market Revenue Million Forecast, by End User 2019 & 2032
- Table 6: Global Margarine Market Volume K Tons Forecast, by End User 2019 & 2032
- Table 7: Global Margarine Market Revenue Million Forecast, by Region 2019 & 2032
- Table 8: Global Margarine Market Volume K Tons Forecast, by Region 2019 & 2032
- Table 9: Global Margarine Market Revenue Million Forecast, by Country 2019 & 2032
- Table 10: Global Margarine Market Volume K Tons Forecast, by Country 2019 & 2032
- Table 11: United States Margarine Market Revenue (Million) Forecast, by Application 2019 & 2032
- Table 12: United States Margarine Market Volume (K Tons) Forecast, by Application 2019 & 2032
- Table 13: Canada Margarine Market Revenue (Million) Forecast, by Application 2019 & 2032
- Table 14: Canada Margarine Market Volume (K Tons) Forecast, by Application 2019 & 2032
- Table 15: Mexico Margarine Market Revenue (Million) Forecast, by Application 2019 & 2032
- Table 16: Mexico Margarine Market Volume (K Tons) Forecast, by Application 2019 & 2032
- Table 17: Rest of North America Margarine Market Revenue (Million) Forecast, by Application 2019 & 2032
- Table 18: Rest of North America Margarine Market Volume (K Tons) Forecast, by Application 2019 & 2032
- Table 19: Global Margarine Market Revenue Million Forecast, by Country 2019 & 2032
- Table 20: Global Margarine Market Volume K Tons Forecast, by Country 2019 & 2032
- Table 21: United Kingdom Margarine Market Revenue (Million) Forecast, by Application 2019 & 2032
- Table 22: United Kingdom Margarine Market Volume (K Tons) Forecast, by Application 2019 & 2032
- Table 23: Germany Margarine Market Revenue (Million) Forecast, by Application 2019 & 2032
- Table 24: Germany Margarine Market Volume (K Tons) Forecast, by Application 2019 & 2032
- Table 25: France Margarine Market Revenue (Million) Forecast, by Application 2019 & 2032
- Table 26: France Margarine Market Volume (K Tons) Forecast, by Application 2019 & 2032
- Table 27: Russia Margarine Market Revenue (Million) Forecast, by Application 2019 & 2032
- Table 28: Russia Margarine Market Volume (K Tons) Forecast, by Application 2019 & 2032
- Table 29: Italy Margarine Market Revenue (Million) Forecast, by Application 2019 & 2032
- Table 30: Italy Margarine Market Volume (K Tons) Forecast, by Application 2019 & 2032
- Table 31: Spain Margarine Market Revenue (Million) Forecast, by Application 2019 & 2032
- Table 32: Spain Margarine Market Volume (K Tons) Forecast, by Application 2019 & 2032
- Table 33: Rest of Europe Margarine Market Revenue (Million) Forecast, by Application 2019 & 2032
- Table 34: Rest of Europe Margarine Market Volume (K Tons) Forecast, by Application 2019 & 2032
- Table 35: Global Margarine Market Revenue Million Forecast, by Country 2019 & 2032
- Table 36: Global Margarine Market Volume K Tons Forecast, by Country 2019 & 2032
- Table 37: India Margarine Market Revenue (Million) Forecast, by Application 2019 & 2032
- Table 38: India Margarine Market Volume (K Tons) Forecast, by Application 2019 & 2032
- Table 39: China Margarine Market Revenue (Million) Forecast, by Application 2019 & 2032
- Table 40: China Margarine Market Volume (K Tons) Forecast, by Application 2019 & 2032
- Table 41: Japan Margarine Market Revenue (Million) Forecast, by Application 2019 & 2032
- Table 42: Japan Margarine Market Volume (K Tons) Forecast, by Application 2019 & 2032
- Table 43: Australia Margarine Market Revenue (Million) Forecast, by Application 2019 & 2032
- Table 44: Australia Margarine Market Volume (K Tons) Forecast, by Application 2019 & 2032
- Table 45: Rest of Asia Pacific Margarine Market Revenue (Million) Forecast, by Application 2019 & 2032
- Table 46: Rest of Asia Pacific Margarine Market Volume (K Tons) Forecast, by Application 2019 & 2032
- Table 47: Global Margarine Market Revenue Million Forecast, by Country 2019 & 2032
- Table 48: Global Margarine Market Volume K Tons Forecast, by Country 2019 & 2032
- Table 49: Brazil Margarine Market Revenue (Million) Forecast, by Application 2019 & 2032
- Table 50: Brazil Margarine Market Volume (K Tons) Forecast, by Application 2019 & 2032
- Table 51: Argentina Margarine Market Revenue (Million) Forecast, by Application 2019 & 2032
- Table 52: Argentina Margarine Market Volume (K Tons) Forecast, by Application 2019 & 2032
- Table 53: Rest of South America Margarine Market Revenue (Million) Forecast, by Application 2019 & 2032
- Table 54: Rest of South America Margarine Market Volume (K Tons) Forecast, by Application 2019 & 2032
- Table 55: Global Margarine Market Revenue Million Forecast, by Country 2019 & 2032
- Table 56: Global Margarine Market Volume K Tons Forecast, by Country 2019 & 2032
- Table 57: South Africa Margarine Market Revenue (Million) Forecast, by Application 2019 & 2032
- Table 58: South Africa Margarine Market Volume (K Tons) Forecast, by Application 2019 & 2032
- Table 59: United Arab Emirates Margarine Market Revenue (Million) Forecast, by Application 2019 & 2032
- Table 60: United Arab Emirates Margarine Market Volume (K Tons) Forecast, by Application 2019 & 2032
- Table 61: Rest of Middle East and Africa Margarine Market Revenue (Million) Forecast, by Application 2019 & 2032
- Table 62: Rest of Middle East and Africa Margarine Market Volume (K Tons) Forecast, by Application 2019 & 2032
- Table 63: Global Margarine Market Revenue Million Forecast, by Type 2019 & 2032
- Table 64: Global Margarine Market Volume K Tons Forecast, by Type 2019 & 2032
- Table 65: Global Margarine Market Revenue Million Forecast, by End User 2019 & 2032
- Table 66: Global Margarine Market Volume K Tons Forecast, by End User 2019 & 2032
- Table 67: Global Margarine Market Revenue Million Forecast, by Country 2019 & 2032
- Table 68: Global Margarine Market Volume K Tons Forecast, by Country 2019 & 2032
- Table 69: United States Margarine Market Revenue (Million) Forecast, by Application 2019 & 2032
- Table 70: United States Margarine Market Volume (K Tons) Forecast, by Application 2019 & 2032
- Table 71: Canada Margarine Market Revenue (Million) Forecast, by Application 2019 & 2032
- Table 72: Canada Margarine Market Volume (K Tons) Forecast, by Application 2019 & 2032
- Table 73: Mexico Margarine Market Revenue (Million) Forecast, by Application 2019 & 2032
- Table 74: Mexico Margarine Market Volume (K Tons) Forecast, by Application 2019 & 2032
- Table 75: Rest of North America Margarine Market Revenue (Million) Forecast, by Application 2019 & 2032
- Table 76: Rest of North America Margarine Market Volume (K Tons) Forecast, by Application 2019 & 2032
- Table 77: Global Margarine Market Revenue Million Forecast, by Type 2019 & 2032
- Table 78: Global Margarine Market Volume K Tons Forecast, by Type 2019 & 2032
- Table 79: Global Margarine Market Revenue Million Forecast, by End User 2019 & 2032
- Table 80: Global Margarine Market Volume K Tons Forecast, by End User 2019 & 2032
- Table 81: Global Margarine Market Revenue Million Forecast, by Country 2019 & 2032
- Table 82: Global Margarine Market Volume K Tons Forecast, by Country 2019 & 2032
- Table 83: United Kingdom Margarine Market Revenue (Million) Forecast, by Application 2019 & 2032
- Table 84: United Kingdom Margarine Market Volume (K Tons) Forecast, by Application 2019 & 2032
- Table 85: Germany Margarine Market Revenue (Million) Forecast, by Application 2019 & 2032
- Table 86: Germany Margarine Market Volume (K Tons) Forecast, by Application 2019 & 2032
- Table 87: France Margarine Market Revenue (Million) Forecast, by Application 2019 & 2032
- Table 88: France Margarine Market Volume (K Tons) Forecast, by Application 2019 & 2032
- Table 89: Russia Margarine Market Revenue (Million) Forecast, by Application 2019 & 2032
- Table 90: Russia Margarine Market Volume (K Tons) Forecast, by Application 2019 & 2032
- Table 91: Italy Margarine Market Revenue (Million) Forecast, by Application 2019 & 2032
- Table 92: Italy Margarine Market Volume (K Tons) Forecast, by Application 2019 & 2032
- Table 93: Spain Margarine Market Revenue (Million) Forecast, by Application 2019 & 2032
- Table 94: Spain Margarine Market Volume (K Tons) Forecast, by Application 2019 & 2032
- Table 95: Rest of Europe Margarine Market Revenue (Million) Forecast, by Application 2019 & 2032
- Table 96: Rest of Europe Margarine Market Volume (K Tons) Forecast, by Application 2019 & 2032
- Table 97: Global Margarine Market Revenue Million Forecast, by Type 2019 & 2032
- Table 98: Global Margarine Market Volume K Tons Forecast, by Type 2019 & 2032
- Table 99: Global Margarine Market Revenue Million Forecast, by End User 2019 & 2032
- Table 100: Global Margarine Market Volume K Tons Forecast, by End User 2019 & 2032
- Table 101: Global Margarine Market Revenue Million Forecast, by Country 2019 & 2032
- Table 102: Global Margarine Market Volume K Tons Forecast, by Country 2019 & 2032
- Table 103: India Margarine Market Revenue (Million) Forecast, by Application 2019 & 2032
- Table 104: India Margarine Market Volume (K Tons) Forecast, by Application 2019 & 2032
- Table 105: China Margarine Market Revenue (Million) Forecast, by Application 2019 & 2032
- Table 106: China Margarine Market Volume (K Tons) Forecast, by Application 2019 & 2032
- Table 107: Japan Margarine Market Revenue (Million) Forecast, by Application 2019 & 2032
- Table 108: Japan Margarine Market Volume (K Tons) Forecast, by Application 2019 & 2032
- Table 109: Australia Margarine Market Revenue (Million) Forecast, by Application 2019 & 2032
- Table 110: Australia Margarine Market Volume (K Tons) Forecast, by Application 2019 & 2032
- Table 111: Rest of Asia Pacific Margarine Market Revenue (Million) Forecast, by Application 2019 & 2032
- Table 112: Rest of Asia Pacific Margarine Market Volume (K Tons) Forecast, by Application 2019 & 2032
- Table 113: Global Margarine Market Revenue Million Forecast, by Type 2019 & 2032
- Table 114: Global Margarine Market Volume K Tons Forecast, by Type 2019 & 2032
- Table 115: Global Margarine Market Revenue Million Forecast, by End User 2019 & 2032
- Table 116: Global Margarine Market Volume K Tons Forecast, by End User 2019 & 2032
- Table 117: Global Margarine Market Revenue Million Forecast, by Country 2019 & 2032
- Table 118: Global Margarine Market Volume K Tons Forecast, by Country 2019 & 2032
- Table 119: Brazil Margarine Market Revenue (Million) Forecast, by Application 2019 & 2032
- Table 120: Brazil Margarine Market Volume (K Tons) Forecast, by Application 2019 & 2032
- Table 121: Argentina Margarine Market Revenue (Million) Forecast, by Application 2019 & 2032
- Table 122: Argentina Margarine Market Volume (K Tons) Forecast, by Application 2019 & 2032
- Table 123: Rest of South America Margarine Market Revenue (Million) Forecast, by Application 2019 & 2032
- Table 124: Rest of South America Margarine Market Volume (K Tons) Forecast, by Application 2019 & 2032
- Table 125: Global Margarine Market Revenue Million Forecast, by Type 2019 & 2032
- Table 126: Global Margarine Market Volume K Tons Forecast, by Type 2019 & 2032
- Table 127: Global Margarine Market Revenue Million Forecast, by End User 2019 & 2032
- Table 128: Global Margarine Market Volume K Tons Forecast, by End User 2019 & 2032
- Table 129: Global Margarine Market Revenue Million Forecast, by Country 2019 & 2032
- Table 130: Global Margarine Market Volume K Tons Forecast, by Country 2019 & 2032
- Table 131: South Africa Margarine Market Revenue (Million) Forecast, by Application 2019 & 2032
- Table 132: South Africa Margarine Market Volume (K Tons) Forecast, by Application 2019 & 2032
- Table 133: United Arab Emirates Margarine Market Revenue (Million) Forecast, by Application 2019 & 2032
- Table 134: United Arab Emirates Margarine Market Volume (K Tons) Forecast, by Application 2019 & 2032
- Table 135: Rest of Middle East and Africa Margarine Market Revenue (Million) Forecast, by Application 2019 & 2032
- Table 136: Rest of Middle East and Africa Margarine Market Volume (K Tons) Forecast, by Application 2019 & 2032
Frequently Asked Questions
1. What is the projected Compound Annual Growth Rate (CAGR) of the Margarine Market?
The projected CAGR is approximately 2.42%.
2. Which companies are prominent players in the Margarine Market?
Key companies in the market include Upfield BV, NMGK Group, Fuji Oil Co Ltd, Wilmar International, Bunge Limited, Conagra Brands Inc, Associated British Foods, Vandemoortele*List Not Exhaustive, Puratos NV, BRF SA, Richardson International Limited.
3. What are the main segments of the Margarine Market?
The market segments include Type, End User.
4. Can you provide details about the market size?
The market size is estimated to be USD 22.67 Million as of 2022.
5. What are some drivers contributing to market growth?
Growing Demand for Bakery and Confectionery Products; Increasing Awareness about the benefits of Vegetarian and Vegan Diets.
6. What are the notable trends driving market growth?
Rising Demand for Sustainable Foods.
7. Are there any restraints impacting market growth?
Stringent Regulations for Consumption of Trans-Fats.
8. Can you provide examples of recent developments in the market?
Upfield's partnership with IBM Food Trust to enhance supply chain transparency Conagra Brands' acquisition of Pinnacle Foods to expand its margarine portfolio Bunge's focus on sustainable palm oil production in response to environmental concerns
9. What pricing options are available for accessing the report?
Pricing options include single-user, multi-user, and enterprise licenses priced at USD 4750, USD 5250, and USD 8750 respectively.
10. Is the market size provided in terms of value or volume?
The market size is provided in terms of value, measured in Million and volume, measured in K Tons.
11. Are there any specific market keywords associated with the report?
Yes, the market keyword associated with the report is "Margarine Market," which aids in identifying and referencing the specific market segment covered.
12. How do I determine which pricing option suits my needs best?
The pricing options vary based on user requirements and access needs. Individual users may opt for single-user licenses, while businesses requiring broader access may choose multi-user or enterprise licenses for cost-effective access to the report.
13. Are there any additional resources or data provided in the Margarine Market report?
While the report offers comprehensive insights, it's advisable to review the specific contents or supplementary materials provided to ascertain if additional resources or data are available.
14. How can I stay updated on further developments or reports in the Margarine Market?
To stay informed about further developments, trends, and reports in the Margarine Market, consider subscribing to industry newsletters, following relevant companies and organizations, or regularly checking reputable industry news sources and publications.
Methodology
Step 1 - Identification of Relevant Samples Size from Population Database


Step 2 - Approaches for Defining Global Market Size (Value, Volume* & Price*)

Note*: In applicable scenarios
Step 3 - Data Sources
Primary Research
- Web Analytics
- Survey Reports
- Research Institute
- Latest Research Reports
- Opinion Leaders
Secondary Research
- Annual Reports
- White Paper
- Latest Press Release
- Industry Association
- Paid Database
- Investor Presentations

Step 4 - Data Triangulation
Involves using different sources of information in order to increase the validity of a study
These sources are likely to be stakeholders in a program - participants, other researchers, program staff, other community members, and so on.
Then we put all data in single framework & apply various statistical tools to find out the dynamic on the market.
During the analysis stage, feedback from the stakeholder groups would be compared to determine areas of agreement as well as areas of divergence


