
Key Insights
The Fruit & Vegetable Pieces and Powders market is experiencing robust growth, driven by increasing demand for convenient, healthy, and shelf-stable food ingredients. The market's expansion is fueled by several key factors. The rising popularity of processed foods, particularly in ready-to-eat (RTE) meals and snacks, necessitates convenient and easily incorporated ingredients. Fruit and vegetable pieces and powders offer manufacturers a way to add nutritional value and appealing colors and textures without compromising on processing efficiency. Furthermore, the growing consumer preference for natural and minimally processed foods is boosting demand for these products. This preference is particularly pronounced in developed regions like North America and Europe, where health-conscious consumers are actively seeking out products with clean labels and recognizable ingredients. The versatility of these products also contributes to their market success. They find applications across various food sectors, including beverages, confectionery, bakery, soups, sauces, and dairy products, making them a crucial component in diverse food manufacturing processes. The continued innovation in processing techniques, resulting in improved product quality and extended shelf life, further supports market growth.
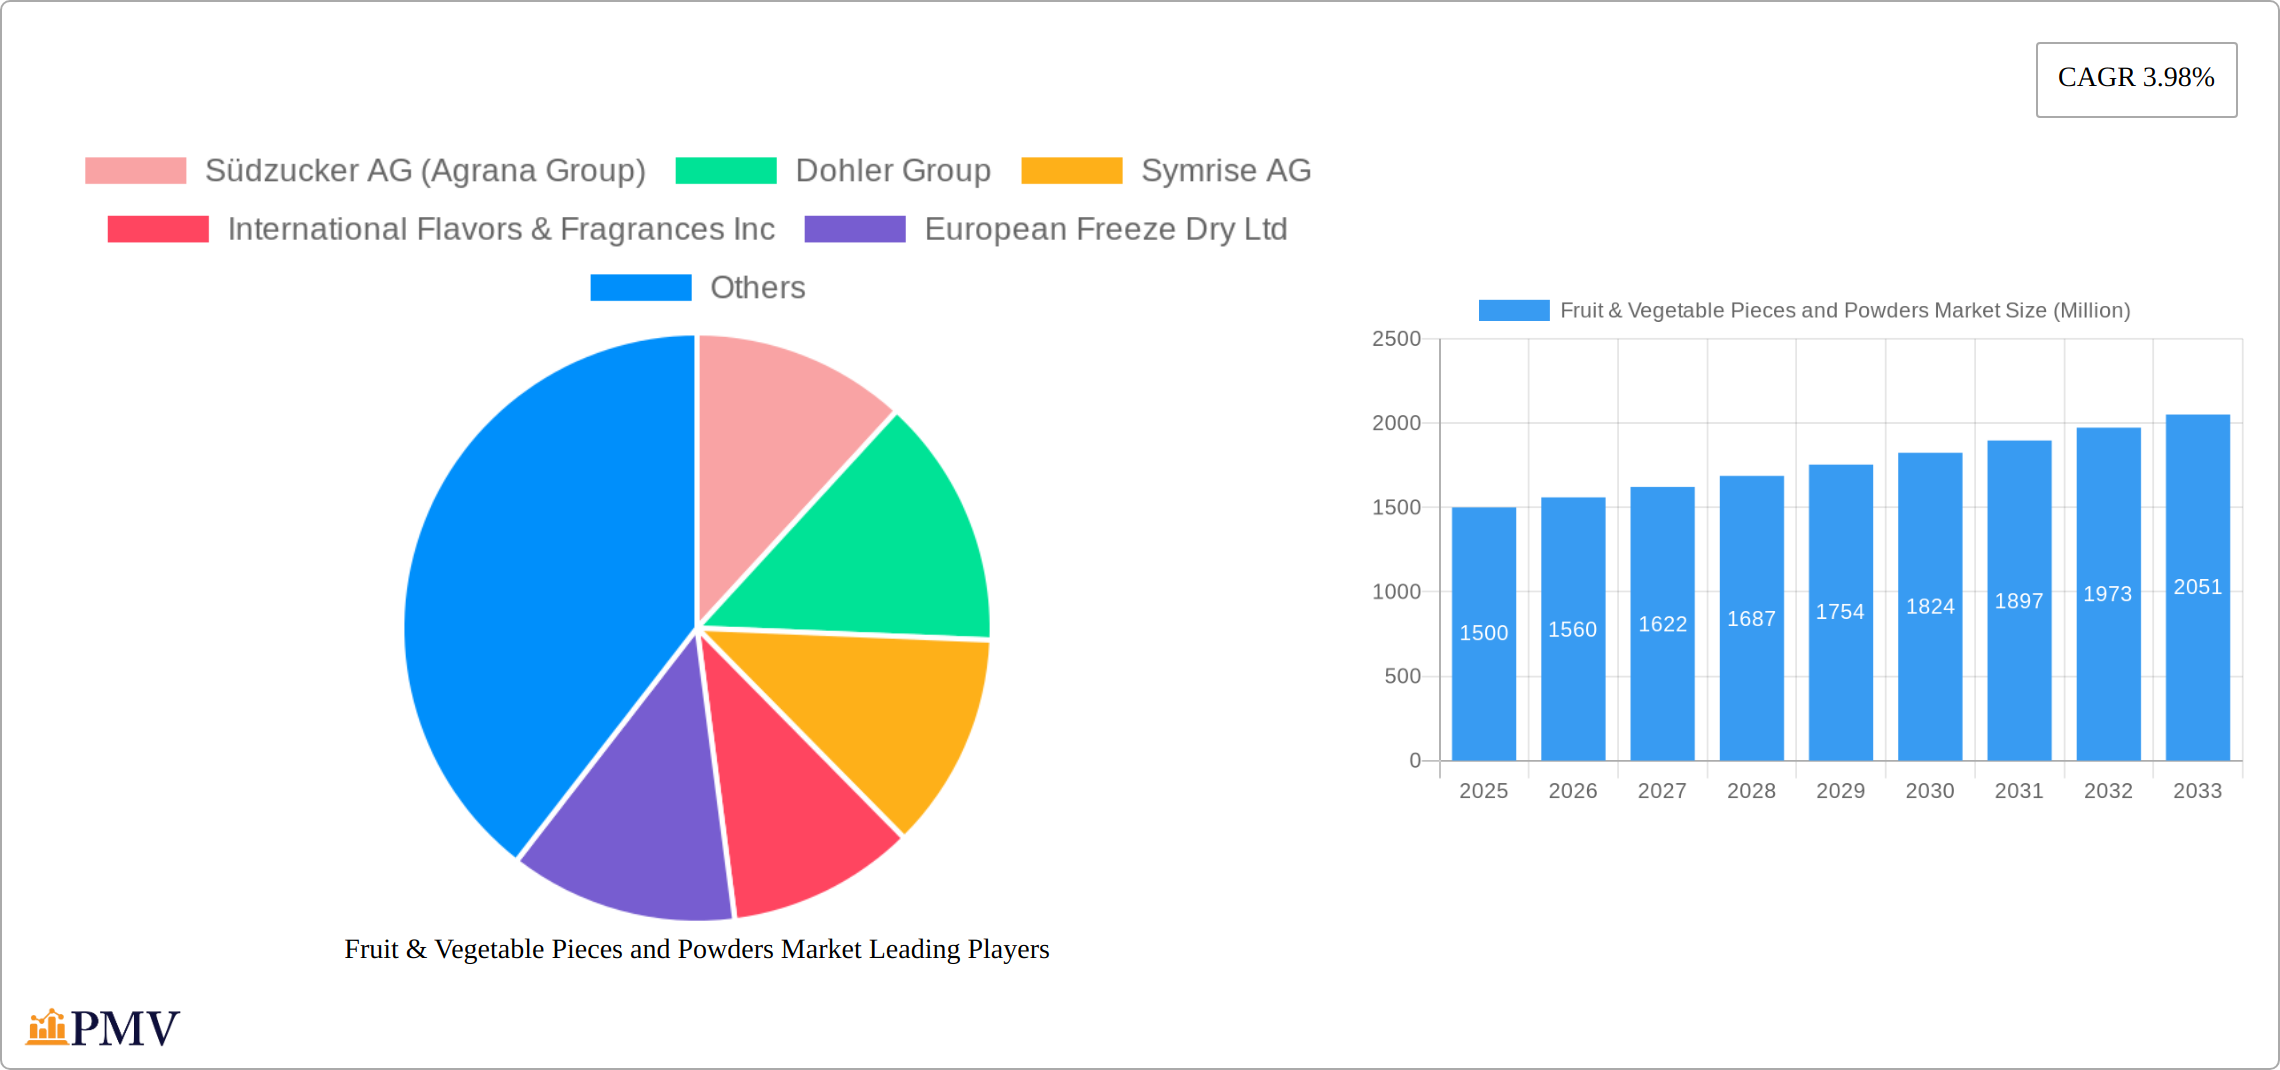
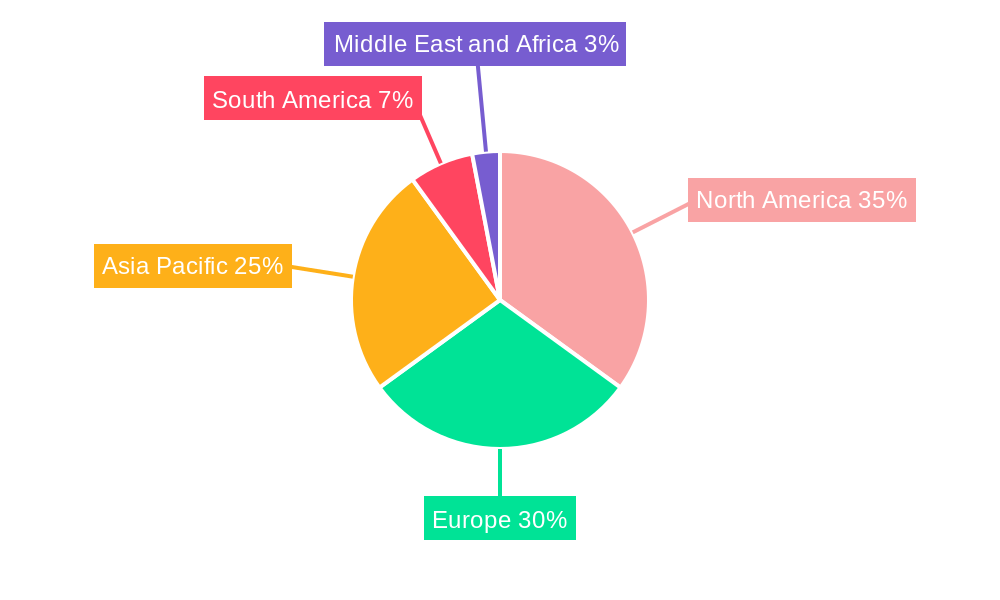
The market segmentation reveals considerable opportunities within specific categories. For instance, berry powders, particularly strawberry and blueberry, are gaining traction due to their strong antioxidant properties and vibrant colors. Concentrates and pastes hold a significant share in the product type segment due to their suitability for various applications and cost-effectiveness. The geographical breakdown suggests that North America and Europe are currently the largest markets, reflecting the aforementioned consumer trends. However, Asia-Pacific is poised for substantial growth in the coming years, driven by rising disposable incomes and changing dietary habits. Competitive forces are also shaping the market landscape, with established players like Südzucker AG, Dohler Group, and Symrise AG continually innovating and expanding their product portfolios to meet evolving consumer demands. Overall, the Fruit & Vegetable Pieces and Powders market is predicted to experience a sustained period of growth, fueled by consumer preferences, technological advancements, and the increasing global demand for convenient and healthy food solutions. The 3.98% CAGR indicates a steady, predictable market trajectory well into the forecast period.
Fruit & Vegetable Pieces and Powders Market: A Comprehensive Report (2019-2033)
This detailed report provides a comprehensive analysis of the global Fruit & Vegetable Pieces and Powders Market, offering invaluable insights for businesses operating within this dynamic sector. With a study period spanning 2019-2033, a base year of 2025, and a forecast period from 2025-2033, this report is an essential resource for strategic decision-making. The market is valued at xx Million in 2025 and is projected to reach xx Million by 2033, exhibiting a CAGR of xx%.
Fruit & Vegetable Pieces and Powders Market Market Structure & Competitive Dynamics
The Fruit & Vegetable Pieces and Powders market presents a moderately concentrated landscape, with key players wielding significant market share. Cargill Inc. and Archer Daniels Midland Company, for example, collectively control approximately xx% of the market. Other prominent players such as Südzucker AG (Agrana Group), Dohler Group, and Symrise AG also hold substantial positions. This competitive arena is defined by robust innovation, with companies strategically developing novel products and expanding their portfolios to align with evolving consumer preferences for healthier and more convenient food options.
Regulatory landscapes vary across geographical regions, impacting ingredient sourcing, processing standards, and labeling requirements. Companies must navigate these regional differences to ensure compliance. The market's growth trajectory is strongly influenced by the surging demand for natural and healthy food products. Consumers increasingly favor minimally processed fruit and vegetable ingredients, driving significant market expansion. Furthermore, the Fruit & Vegetable Pieces and Powders market has witnessed considerable M&A activity in recent years, with deal values exceeding xx Million over the past five years. [Insert specific M&A examples with deal values if available; otherwise, state "Specific M&A deal values are not publicly available at this time."]. These mergers and acquisitions reflect strategic efforts by companies to bolster their product lines, extend their geographic reach, and enhance their market share. This report offers a detailed analysis of these activities' impact on market dynamics and provides insights into future M&A trends, helping stakeholders anticipate and adapt to market shifts.
Fruit & Vegetable Pieces and Powders Market Industry Trends & Insights
The Fruit & Vegetable Pieces and Powders Market is experiencing robust growth, primarily fueled by the rising demand for convenient and healthy food options. Consumers are increasingly integrating fruits and vegetables into their diets, particularly in developed economies where health and wellness are paramount. This trend is further accelerated by technological advancements in processing and preservation techniques. Innovations like freeze-drying and high-pressure processing facilitate the creation of high-quality products with extended shelf lives, enhancing both consumer appeal and product viability.
Evolving consumer preferences continue to reshape market trends. The demand for organic, sustainably sourced, and non-GMO products is significantly impacting manufacturing practices. Producers are responding by adopting more sustainable production methods and improving supply chain transparency. The market penetration rate of organic fruit and vegetable pieces and powders is experiencing annual growth of xx%, reflecting the escalating consumer focus on natural and organic options. Innovation remains a key competitive differentiator, with companies consistently introducing new products to meet diverse and evolving consumer demands. This includes the development of functional ingredients offering added health benefits, such as enhanced antioxidant properties or improved nutritional profiles, catering to health-conscious consumers seeking nutritional enhancement.
Dominant Markets & Segments in Fruit & Vegetable Pieces and Powders Market
The Fruit & Vegetable Pieces and Powders Market shows significant regional variations in dominance. North America currently holds the largest market share, driven by high consumer demand for convenient and healthy food options. However, Asia-Pacific is expected to witness significant growth in the forecast period, fueled by increasing disposable incomes and rising health consciousness.
- Key Drivers in North America: Strong consumer preference for convenient, healthy foods; established distribution networks; robust research and development activities.
- Key Drivers in Asia-Pacific: Rapidly growing middle class; rising health awareness; expanding food processing industry.
Dominant Segments:
- Ingredient Type: Fruits hold a larger market share compared to vegetables, with berries (especially strawberries and blueberries) being particularly dominant due to their high demand in the food and beverage industry.
- Product Type: Powders are experiencing strong growth, driven by their versatility and convenience.
- Application: Beverages and confectionery products represent major application segments due to the widespread use of fruit and vegetable pieces and powders as flavoring agents and functional ingredients.
The dominance of specific segments is influenced by several factors, including consumer preferences, processing technology advancements, and the availability of raw materials.
Fruit & Vegetable Pieces and Powders Market Product Innovations
Recent innovations in the Fruit & Vegetable Pieces and Powders Market focus on enhancing product quality, extending shelf life, and developing functional ingredients. Freeze-drying technology is increasingly adopted for preserving the nutritional value and flavor of fruits and vegetables, while innovative extraction techniques are employed to produce concentrated ingredients with improved functionalities. The market is witnessing the emergence of novel products such as organically certified powders, functional blends with added health benefits, and customized ingredient solutions for specific applications. These innovations cater to the evolving needs of food manufacturers and meet the growing demand for clean-label, natural, and health-conscious products.
Report Segmentation & Scope
This report provides a comprehensive segmentation of the Fruit & Vegetable Pieces and Powders Market based on several key parameters:
Ingredient Type: A detailed breakdown is provided for Fruit (Berries: Strawberry, Blueberry, Raspberry, Other Berries; Other Fruits) and Vegetable segments. The report analyzes the growth projections, market size, and competitive dynamics of each, highlighting the diverse demands and production methods associated with different fruits and vegetables.
Product Type: The report thoroughly examines Concentrates, Pastes and Purees, Pieces, Powders, and NFC Juices. It details the market size and growth trajectory for each product type, considering factors such as consumer preferences, technological advancements, and production costs.
Application: The report analyzes market size and growth projections for Beverages, Confectionery Products, Bakery Products, Soups and Sauces, Dairy Products, and RTE Products, showcasing the diverse applications of fruit and vegetable ingredients across various food categories and highlighting the competitive landscape within each application segment.
Key Drivers of Fruit & Vegetable Pieces and Powders Market Growth
Several factors fuel the growth of the Fruit & Vegetable Pieces and Powders Market. The increasing consumer demand for healthy and convenient foods is a primary driver. Technological advancements such as improved extraction and processing techniques enhance product quality and shelf life, further boosting market growth. Furthermore, the rising prevalence of health and wellness trends and increasing disposable income in emerging economies contribute to greater adoption. Government regulations promoting the use of healthy ingredients in food products also positively influence market growth.
Challenges in the Fruit & Vegetable Pieces and Powders Market Sector
Despite favorable growth prospects, the Fruit & Vegetable Pieces and Powders Market faces several challenges. Fluctuations in raw material prices and supply chain disruptions pose significant risks, impacting production costs and product availability. Strict regulatory requirements regarding food safety and labeling increase compliance costs for manufacturers. Furthermore, intense competition and the need for continuous innovation to meet evolving consumer preferences add to the complexities of operating in this market.
Leading Players in the Fruit & Vegetable Pieces and Powders Market Market
- Südzucker AG (Agrana Group)
- Dohler Group
- Symrise AG
- International Flavors & Fragrances Inc
- European Freeze Dry Ltd
- Archer Daniels Midland Company
- Olam International
- Cargill Inc
- SunOpta Inc
- Van Drunen Farms
- Kanegrade Ltd
Key Developments in Fruit & Vegetable Pieces and Powders Market Sector
June 2022: Symrise's introduction of Diana Food, a line of blueberry ingredients with diverse organoleptic properties and certifications (organic, baby food standards), underscores the industry's focus on high-quality, specialized ingredients.
November 2021: Olam Food Ingredients (OFI)'s launch of a new brand emphasizing natural and healthy product solutions reflects the growing consumer preference for clean-label ingredients and the industry's response to this demand.
February 2021: European Freeze Dry's launch of freeze-dried jackfruit, targeting the vegan market, exemplifies innovation in response to evolving dietary preferences and the expansion into niche markets.
Strategic Fruit & Vegetable Pieces and Powders Market Market Outlook
The Fruit & Vegetable Pieces and Powders Market possesses significant growth potential. The confluence of increasing demand for healthy and convenient food options, technological advancements, and continuous innovation is poised to propel market expansion. Strategic opportunities exist in developing sustainably and ethically sourced ingredients, creating functional products with enhanced health benefits, and expanding into new geographic markets, particularly in emerging economies. Companies proactively addressing regulatory challenges and supply chain vulnerabilities will be ideally positioned to capitalize on future market growth and maintain a competitive edge.
Fruit & Vegetable Pieces and Powders Market Segmentation
-
1. Ingredient Type
-
1.1. Fruit
- 1.1.1. Apple
- 1.1.2. Orange
- 1.1.3. Pineapple
- 1.1.4. Mango
- 1.1.5. Banana
-
1.1.6. Berries
- 1.1.6.1. Strawberry
- 1.1.6.2. Blueberry
- 1.1.6.3. Raspberry
- 1.1.6.4. Other Berries
- 1.1.7. Other Fruits
-
1.2. Vegetable
- 1.2.1. Carrot
- 1.2.2. Tomatoes
- 1.2.3. Beetroot
- 1.2.4. Peas
- 1.2.5. Pumpkin
- 1.2.6. Other Vegetables
-
1.1. Fruit
-
2. Product Type
- 2.1. Concentrates
- 2.2. Pastes and Purees
- 2.3. Pieces
- 2.4. Powders
- 2.5. NFC Juices
-
3. Application
- 3.1. Beverages
- 3.2. Confectionery Products
- 3.3. Bakery Products
- 3.4. Soups and Sauces
- 3.5. Dairy Products
- 3.6. RTE Products
Fruit & Vegetable Pieces and Powders Market Segmentation By Geography
-
1. North America
- 1.1. United States
- 1.2. Canada
- 1.3. Mexico
- 1.4. Rest of North America
-
2. Europe
- 2.1. Spain
- 2.2. United Kingdom
- 2.3. France
- 2.4. Germany
- 2.5. Russia
- 2.6. Italy
- 2.7. Rest of Europe
-
3. Asia Pacific
- 3.1. China
- 3.2. India
- 3.3. Japan
- 3.4. Australia
- 3.5. Rest of Asia Pacific
-
4. South America
- 4.1. Brazil
- 4.2. Argentina
- 4.3. Rest of South America
-
5. Middle East and Africa
- 5.1. South Africa
- 5.2. Saudi Arabia
- 5.3. Rest of Middle East and Africa
Fruit & Vegetable Pieces and Powders Market REPORT HIGHLIGHTS
| Aspects | Details |
|---|---|
| Study Period | 2019-2033 |
| Base Year | 2024 |
| Estimated Year | 2025 |
| Forecast Period | 2025-2033 |
| Historical Period | 2019-2024 |
| Growth Rate | CAGR of 3.98% from 2019-2033 |
| Segmentation |
|
Table of Contents
- 1. Introduction
- 1.1. Research Scope
- 1.2. Market Segmentation
- 1.3. Research Methodology
- 1.4. Definitions and Assumptions
- 2. Executive Summary
- 2.1. Introduction
- 3. Market Dynamics
- 3.1. Introduction
- 3.2. Market Drivers
- 3.2.1. Increasing Demand for Protein-Rich Food; Increasing Demand for Plant-Based and Organic Ingredients
- 3.3. Market Restrains
- 3.3.1. Presence of Alternative Proteins
- 3.4. Market Trends
- 3.4.1. Increase in Demand for Natural Ingredients in the Food and Beverage Industry
- 4. Market Factor Analysis
- 4.1. Porters Five Forces
- 4.2. Supply/Value Chain
- 4.3. PESTEL analysis
- 4.4. Market Entropy
- 4.5. Patent/Trademark Analysis
- 5. Global Fruit & Vegetable Pieces and Powders Market Analysis, Insights and Forecast, 2019-2031
- 5.1. Market Analysis, Insights and Forecast - by Ingredient Type
- 5.1.1. Fruit
- 5.1.1.1. Apple
- 5.1.1.2. Orange
- 5.1.1.3. Pineapple
- 5.1.1.4. Mango
- 5.1.1.5. Banana
- 5.1.1.6. Berries
- 5.1.1.6.1. Strawberry
- 5.1.1.6.2. Blueberry
- 5.1.1.6.3. Raspberry
- 5.1.1.6.4. Other Berries
- 5.1.1.7. Other Fruits
- 5.1.2. Vegetable
- 5.1.2.1. Carrot
- 5.1.2.2. Tomatoes
- 5.1.2.3. Beetroot
- 5.1.2.4. Peas
- 5.1.2.5. Pumpkin
- 5.1.2.6. Other Vegetables
- 5.1.1. Fruit
- 5.2. Market Analysis, Insights and Forecast - by Product Type
- 5.2.1. Concentrates
- 5.2.2. Pastes and Purees
- 5.2.3. Pieces
- 5.2.4. Powders
- 5.2.5. NFC Juices
- 5.3. Market Analysis, Insights and Forecast - by Application
- 5.3.1. Beverages
- 5.3.2. Confectionery Products
- 5.3.3. Bakery Products
- 5.3.4. Soups and Sauces
- 5.3.5. Dairy Products
- 5.3.6. RTE Products
- 5.4. Market Analysis, Insights and Forecast - by Region
- 5.4.1. North America
- 5.4.2. Europe
- 5.4.3. Asia Pacific
- 5.4.4. South America
- 5.4.5. Middle East and Africa
- 5.1. Market Analysis, Insights and Forecast - by Ingredient Type
- 6. North America Fruit & Vegetable Pieces and Powders Market Analysis, Insights and Forecast, 2019-2031
- 6.1. Market Analysis, Insights and Forecast - by Ingredient Type
- 6.1.1. Fruit
- 6.1.1.1. Apple
- 6.1.1.2. Orange
- 6.1.1.3. Pineapple
- 6.1.1.4. Mango
- 6.1.1.5. Banana
- 6.1.1.6. Berries
- 6.1.1.6.1. Strawberry
- 6.1.1.6.2. Blueberry
- 6.1.1.6.3. Raspberry
- 6.1.1.6.4. Other Berries
- 6.1.1.7. Other Fruits
- 6.1.2. Vegetable
- 6.1.2.1. Carrot
- 6.1.2.2. Tomatoes
- 6.1.2.3. Beetroot
- 6.1.2.4. Peas
- 6.1.2.5. Pumpkin
- 6.1.2.6. Other Vegetables
- 6.1.1. Fruit
- 6.2. Market Analysis, Insights and Forecast - by Product Type
- 6.2.1. Concentrates
- 6.2.2. Pastes and Purees
- 6.2.3. Pieces
- 6.2.4. Powders
- 6.2.5. NFC Juices
- 6.3. Market Analysis, Insights and Forecast - by Application
- 6.3.1. Beverages
- 6.3.2. Confectionery Products
- 6.3.3. Bakery Products
- 6.3.4. Soups and Sauces
- 6.3.5. Dairy Products
- 6.3.6. RTE Products
- 6.1. Market Analysis, Insights and Forecast - by Ingredient Type
- 7. Europe Fruit & Vegetable Pieces and Powders Market Analysis, Insights and Forecast, 2019-2031
- 7.1. Market Analysis, Insights and Forecast - by Ingredient Type
- 7.1.1. Fruit
- 7.1.1.1. Apple
- 7.1.1.2. Orange
- 7.1.1.3. Pineapple
- 7.1.1.4. Mango
- 7.1.1.5. Banana
- 7.1.1.6. Berries
- 7.1.1.6.1. Strawberry
- 7.1.1.6.2. Blueberry
- 7.1.1.6.3. Raspberry
- 7.1.1.6.4. Other Berries
- 7.1.1.7. Other Fruits
- 7.1.2. Vegetable
- 7.1.2.1. Carrot
- 7.1.2.2. Tomatoes
- 7.1.2.3. Beetroot
- 7.1.2.4. Peas
- 7.1.2.5. Pumpkin
- 7.1.2.6. Other Vegetables
- 7.1.1. Fruit
- 7.2. Market Analysis, Insights and Forecast - by Product Type
- 7.2.1. Concentrates
- 7.2.2. Pastes and Purees
- 7.2.3. Pieces
- 7.2.4. Powders
- 7.2.5. NFC Juices
- 7.3. Market Analysis, Insights and Forecast - by Application
- 7.3.1. Beverages
- 7.3.2. Confectionery Products
- 7.3.3. Bakery Products
- 7.3.4. Soups and Sauces
- 7.3.5. Dairy Products
- 7.3.6. RTE Products
- 7.1. Market Analysis, Insights and Forecast - by Ingredient Type
- 8. Asia Pacific Fruit & Vegetable Pieces and Powders Market Analysis, Insights and Forecast, 2019-2031
- 8.1. Market Analysis, Insights and Forecast - by Ingredient Type
- 8.1.1. Fruit
- 8.1.1.1. Apple
- 8.1.1.2. Orange
- 8.1.1.3. Pineapple
- 8.1.1.4. Mango
- 8.1.1.5. Banana
- 8.1.1.6. Berries
- 8.1.1.6.1. Strawberry
- 8.1.1.6.2. Blueberry
- 8.1.1.6.3. Raspberry
- 8.1.1.6.4. Other Berries
- 8.1.1.7. Other Fruits
- 8.1.2. Vegetable
- 8.1.2.1. Carrot
- 8.1.2.2. Tomatoes
- 8.1.2.3. Beetroot
- 8.1.2.4. Peas
- 8.1.2.5. Pumpkin
- 8.1.2.6. Other Vegetables
- 8.1.1. Fruit
- 8.2. Market Analysis, Insights and Forecast - by Product Type
- 8.2.1. Concentrates
- 8.2.2. Pastes and Purees
- 8.2.3. Pieces
- 8.2.4. Powders
- 8.2.5. NFC Juices
- 8.3. Market Analysis, Insights and Forecast - by Application
- 8.3.1. Beverages
- 8.3.2. Confectionery Products
- 8.3.3. Bakery Products
- 8.3.4. Soups and Sauces
- 8.3.5. Dairy Products
- 8.3.6. RTE Products
- 8.1. Market Analysis, Insights and Forecast - by Ingredient Type
- 9. South America Fruit & Vegetable Pieces and Powders Market Analysis, Insights and Forecast, 2019-2031
- 9.1. Market Analysis, Insights and Forecast - by Ingredient Type
- 9.1.1. Fruit
- 9.1.1.1. Apple
- 9.1.1.2. Orange
- 9.1.1.3. Pineapple
- 9.1.1.4. Mango
- 9.1.1.5. Banana
- 9.1.1.6. Berries
- 9.1.1.6.1. Strawberry
- 9.1.1.6.2. Blueberry
- 9.1.1.6.3. Raspberry
- 9.1.1.6.4. Other Berries
- 9.1.1.7. Other Fruits
- 9.1.2. Vegetable
- 9.1.2.1. Carrot
- 9.1.2.2. Tomatoes
- 9.1.2.3. Beetroot
- 9.1.2.4. Peas
- 9.1.2.5. Pumpkin
- 9.1.2.6. Other Vegetables
- 9.1.1. Fruit
- 9.2. Market Analysis, Insights and Forecast - by Product Type
- 9.2.1. Concentrates
- 9.2.2. Pastes and Purees
- 9.2.3. Pieces
- 9.2.4. Powders
- 9.2.5. NFC Juices
- 9.3. Market Analysis, Insights and Forecast - by Application
- 9.3.1. Beverages
- 9.3.2. Confectionery Products
- 9.3.3. Bakery Products
- 9.3.4. Soups and Sauces
- 9.3.5. Dairy Products
- 9.3.6. RTE Products
- 9.1. Market Analysis, Insights and Forecast - by Ingredient Type
- 10. Middle East and Africa Fruit & Vegetable Pieces and Powders Market Analysis, Insights and Forecast, 2019-2031
- 10.1. Market Analysis, Insights and Forecast - by Ingredient Type
- 10.1.1. Fruit
- 10.1.1.1. Apple
- 10.1.1.2. Orange
- 10.1.1.3. Pineapple
- 10.1.1.4. Mango
- 10.1.1.5. Banana
- 10.1.1.6. Berries
- 10.1.1.6.1. Strawberry
- 10.1.1.6.2. Blueberry
- 10.1.1.6.3. Raspberry
- 10.1.1.6.4. Other Berries
- 10.1.1.7. Other Fruits
- 10.1.2. Vegetable
- 10.1.2.1. Carrot
- 10.1.2.2. Tomatoes
- 10.1.2.3. Beetroot
- 10.1.2.4. Peas
- 10.1.2.5. Pumpkin
- 10.1.2.6. Other Vegetables
- 10.1.1. Fruit
- 10.2. Market Analysis, Insights and Forecast - by Product Type
- 10.2.1. Concentrates
- 10.2.2. Pastes and Purees
- 10.2.3. Pieces
- 10.2.4. Powders
- 10.2.5. NFC Juices
- 10.3. Market Analysis, Insights and Forecast - by Application
- 10.3.1. Beverages
- 10.3.2. Confectionery Products
- 10.3.3. Bakery Products
- 10.3.4. Soups and Sauces
- 10.3.5. Dairy Products
- 10.3.6. RTE Products
- 10.1. Market Analysis, Insights and Forecast - by Ingredient Type
- 11. North America Fruit & Vegetable Pieces and Powders Market Analysis, Insights and Forecast, 2019-2031
- 11.1. Market Analysis, Insights and Forecast - By Country/Sub-region
- 11.1.1 United States
- 11.1.2 Canada
- 11.1.3 Mexico
- 11.1.4 Rest of North America
- 12. Europe Fruit & Vegetable Pieces and Powders Market Analysis, Insights and Forecast, 2019-2031
- 12.1. Market Analysis, Insights and Forecast - By Country/Sub-region
- 12.1.1 Spain
- 12.1.2 United Kingdom
- 12.1.3 France
- 12.1.4 Germany
- 12.1.5 Russia
- 12.1.6 Italy
- 12.1.7 Rest of Europe
- 13. Asia Pacific Fruit & Vegetable Pieces and Powders Market Analysis, Insights and Forecast, 2019-2031
- 13.1. Market Analysis, Insights and Forecast - By Country/Sub-region
- 13.1.1 China
- 13.1.2 India
- 13.1.3 Japan
- 13.1.4 Australia
- 13.1.5 Rest of Asia Pacific
- 14. South America Fruit & Vegetable Pieces and Powders Market Analysis, Insights and Forecast, 2019-2031
- 14.1. Market Analysis, Insights and Forecast - By Country/Sub-region
- 14.1.1 Brazil
- 14.1.2 Argentina
- 14.1.3 Rest of South America
- 15. Middle East and Africa Fruit & Vegetable Pieces and Powders Market Analysis, Insights and Forecast, 2019-2031
- 15.1. Market Analysis, Insights and Forecast - By Country/Sub-region
- 15.1.1 South Africa
- 15.1.2 Saudi Arabia
- 15.1.3 Rest of Middle East and Africa
- 16. Competitive Analysis
- 16.1. Global Market Share Analysis 2024
- 16.2. Company Profiles
- 16.2.1 Südzucker AG (Agrana Group)
- 16.2.1.1. Overview
- 16.2.1.2. Products
- 16.2.1.3. SWOT Analysis
- 16.2.1.4. Recent Developments
- 16.2.1.5. Financials (Based on Availability)
- 16.2.2 Dohler Group
- 16.2.2.1. Overview
- 16.2.2.2. Products
- 16.2.2.3. SWOT Analysis
- 16.2.2.4. Recent Developments
- 16.2.2.5. Financials (Based on Availability)
- 16.2.3 Symrise AG
- 16.2.3.1. Overview
- 16.2.3.2. Products
- 16.2.3.3. SWOT Analysis
- 16.2.3.4. Recent Developments
- 16.2.3.5. Financials (Based on Availability)
- 16.2.4 International Flavors & Fragrances Inc
- 16.2.4.1. Overview
- 16.2.4.2. Products
- 16.2.4.3. SWOT Analysis
- 16.2.4.4. Recent Developments
- 16.2.4.5. Financials (Based on Availability)
- 16.2.5 European Freeze Dry Ltd
- 16.2.5.1. Overview
- 16.2.5.2. Products
- 16.2.5.3. SWOT Analysis
- 16.2.5.4. Recent Developments
- 16.2.5.5. Financials (Based on Availability)
- 16.2.6 Archer Daniels Midland Company
- 16.2.6.1. Overview
- 16.2.6.2. Products
- 16.2.6.3. SWOT Analysis
- 16.2.6.4. Recent Developments
- 16.2.6.5. Financials (Based on Availability)
- 16.2.7 Olam International
- 16.2.7.1. Overview
- 16.2.7.2. Products
- 16.2.7.3. SWOT Analysis
- 16.2.7.4. Recent Developments
- 16.2.7.5. Financials (Based on Availability)
- 16.2.8 Cargill Inc
- 16.2.8.1. Overview
- 16.2.8.2. Products
- 16.2.8.3. SWOT Analysis
- 16.2.8.4. Recent Developments
- 16.2.8.5. Financials (Based on Availability)
- 16.2.9 SunOpta Inc
- 16.2.9.1. Overview
- 16.2.9.2. Products
- 16.2.9.3. SWOT Analysis
- 16.2.9.4. Recent Developments
- 16.2.9.5. Financials (Based on Availability)
- 16.2.10 Van Drunen Farms
- 16.2.10.1. Overview
- 16.2.10.2. Products
- 16.2.10.3. SWOT Analysis
- 16.2.10.4. Recent Developments
- 16.2.10.5. Financials (Based on Availability)
- 16.2.11 Kanegrade Ltd
- 16.2.11.1. Overview
- 16.2.11.2. Products
- 16.2.11.3. SWOT Analysis
- 16.2.11.4. Recent Developments
- 16.2.11.5. Financials (Based on Availability)
- 16.2.1 Südzucker AG (Agrana Group)
List of Figures
- Figure 1: Global Fruit & Vegetable Pieces and Powders Market Revenue Breakdown (Million, %) by Region 2024 & 2032
- Figure 2: Global Fruit & Vegetable Pieces and Powders Market Volume Breakdown (K Tons, %) by Region 2024 & 2032
- Figure 3: North America Fruit & Vegetable Pieces and Powders Market Revenue (Million), by Country 2024 & 2032
- Figure 4: North America Fruit & Vegetable Pieces and Powders Market Volume (K Tons), by Country 2024 & 2032
- Figure 5: North America Fruit & Vegetable Pieces and Powders Market Revenue Share (%), by Country 2024 & 2032
- Figure 6: North America Fruit & Vegetable Pieces and Powders Market Volume Share (%), by Country 2024 & 2032
- Figure 7: Europe Fruit & Vegetable Pieces and Powders Market Revenue (Million), by Country 2024 & 2032
- Figure 8: Europe Fruit & Vegetable Pieces and Powders Market Volume (K Tons), by Country 2024 & 2032
- Figure 9: Europe Fruit & Vegetable Pieces and Powders Market Revenue Share (%), by Country 2024 & 2032
- Figure 10: Europe Fruit & Vegetable Pieces and Powders Market Volume Share (%), by Country 2024 & 2032
- Figure 11: Asia Pacific Fruit & Vegetable Pieces and Powders Market Revenue (Million), by Country 2024 & 2032
- Figure 12: Asia Pacific Fruit & Vegetable Pieces and Powders Market Volume (K Tons), by Country 2024 & 2032
- Figure 13: Asia Pacific Fruit & Vegetable Pieces and Powders Market Revenue Share (%), by Country 2024 & 2032
- Figure 14: Asia Pacific Fruit & Vegetable Pieces and Powders Market Volume Share (%), by Country 2024 & 2032
- Figure 15: South America Fruit & Vegetable Pieces and Powders Market Revenue (Million), by Country 2024 & 2032
- Figure 16: South America Fruit & Vegetable Pieces and Powders Market Volume (K Tons), by Country 2024 & 2032
- Figure 17: South America Fruit & Vegetable Pieces and Powders Market Revenue Share (%), by Country 2024 & 2032
- Figure 18: South America Fruit & Vegetable Pieces and Powders Market Volume Share (%), by Country 2024 & 2032
- Figure 19: Middle East and Africa Fruit & Vegetable Pieces and Powders Market Revenue (Million), by Country 2024 & 2032
- Figure 20: Middle East and Africa Fruit & Vegetable Pieces and Powders Market Volume (K Tons), by Country 2024 & 2032
- Figure 21: Middle East and Africa Fruit & Vegetable Pieces and Powders Market Revenue Share (%), by Country 2024 & 2032
- Figure 22: Middle East and Africa Fruit & Vegetable Pieces and Powders Market Volume Share (%), by Country 2024 & 2032
- Figure 23: North America Fruit & Vegetable Pieces and Powders Market Revenue (Million), by Ingredient Type 2024 & 2032
- Figure 24: North America Fruit & Vegetable Pieces and Powders Market Volume (K Tons), by Ingredient Type 2024 & 2032
- Figure 25: North America Fruit & Vegetable Pieces and Powders Market Revenue Share (%), by Ingredient Type 2024 & 2032
- Figure 26: North America Fruit & Vegetable Pieces and Powders Market Volume Share (%), by Ingredient Type 2024 & 2032
- Figure 27: North America Fruit & Vegetable Pieces and Powders Market Revenue (Million), by Product Type 2024 & 2032
- Figure 28: North America Fruit & Vegetable Pieces and Powders Market Volume (K Tons), by Product Type 2024 & 2032
- Figure 29: North America Fruit & Vegetable Pieces and Powders Market Revenue Share (%), by Product Type 2024 & 2032
- Figure 30: North America Fruit & Vegetable Pieces and Powders Market Volume Share (%), by Product Type 2024 & 2032
- Figure 31: North America Fruit & Vegetable Pieces and Powders Market Revenue (Million), by Application 2024 & 2032
- Figure 32: North America Fruit & Vegetable Pieces and Powders Market Volume (K Tons), by Application 2024 & 2032
- Figure 33: North America Fruit & Vegetable Pieces and Powders Market Revenue Share (%), by Application 2024 & 2032
- Figure 34: North America Fruit & Vegetable Pieces and Powders Market Volume Share (%), by Application 2024 & 2032
- Figure 35: North America Fruit & Vegetable Pieces and Powders Market Revenue (Million), by Country 2024 & 2032
- Figure 36: North America Fruit & Vegetable Pieces and Powders Market Volume (K Tons), by Country 2024 & 2032
- Figure 37: North America Fruit & Vegetable Pieces and Powders Market Revenue Share (%), by Country 2024 & 2032
- Figure 38: North America Fruit & Vegetable Pieces and Powders Market Volume Share (%), by Country 2024 & 2032
- Figure 39: Europe Fruit & Vegetable Pieces and Powders Market Revenue (Million), by Ingredient Type 2024 & 2032
- Figure 40: Europe Fruit & Vegetable Pieces and Powders Market Volume (K Tons), by Ingredient Type 2024 & 2032
- Figure 41: Europe Fruit & Vegetable Pieces and Powders Market Revenue Share (%), by Ingredient Type 2024 & 2032
- Figure 42: Europe Fruit & Vegetable Pieces and Powders Market Volume Share (%), by Ingredient Type 2024 & 2032
- Figure 43: Europe Fruit & Vegetable Pieces and Powders Market Revenue (Million), by Product Type 2024 & 2032
- Figure 44: Europe Fruit & Vegetable Pieces and Powders Market Volume (K Tons), by Product Type 2024 & 2032
- Figure 45: Europe Fruit & Vegetable Pieces and Powders Market Revenue Share (%), by Product Type 2024 & 2032
- Figure 46: Europe Fruit & Vegetable Pieces and Powders Market Volume Share (%), by Product Type 2024 & 2032
- Figure 47: Europe Fruit & Vegetable Pieces and Powders Market Revenue (Million), by Application 2024 & 2032
- Figure 48: Europe Fruit & Vegetable Pieces and Powders Market Volume (K Tons), by Application 2024 & 2032
- Figure 49: Europe Fruit & Vegetable Pieces and Powders Market Revenue Share (%), by Application 2024 & 2032
- Figure 50: Europe Fruit & Vegetable Pieces and Powders Market Volume Share (%), by Application 2024 & 2032
- Figure 51: Europe Fruit & Vegetable Pieces and Powders Market Revenue (Million), by Country 2024 & 2032
- Figure 52: Europe Fruit & Vegetable Pieces and Powders Market Volume (K Tons), by Country 2024 & 2032
- Figure 53: Europe Fruit & Vegetable Pieces and Powders Market Revenue Share (%), by Country 2024 & 2032
- Figure 54: Europe Fruit & Vegetable Pieces and Powders Market Volume Share (%), by Country 2024 & 2032
- Figure 55: Asia Pacific Fruit & Vegetable Pieces and Powders Market Revenue (Million), by Ingredient Type 2024 & 2032
- Figure 56: Asia Pacific Fruit & Vegetable Pieces and Powders Market Volume (K Tons), by Ingredient Type 2024 & 2032
- Figure 57: Asia Pacific Fruit & Vegetable Pieces and Powders Market Revenue Share (%), by Ingredient Type 2024 & 2032
- Figure 58: Asia Pacific Fruit & Vegetable Pieces and Powders Market Volume Share (%), by Ingredient Type 2024 & 2032
- Figure 59: Asia Pacific Fruit & Vegetable Pieces and Powders Market Revenue (Million), by Product Type 2024 & 2032
- Figure 60: Asia Pacific Fruit & Vegetable Pieces and Powders Market Volume (K Tons), by Product Type 2024 & 2032
- Figure 61: Asia Pacific Fruit & Vegetable Pieces and Powders Market Revenue Share (%), by Product Type 2024 & 2032
- Figure 62: Asia Pacific Fruit & Vegetable Pieces and Powders Market Volume Share (%), by Product Type 2024 & 2032
- Figure 63: Asia Pacific Fruit & Vegetable Pieces and Powders Market Revenue (Million), by Application 2024 & 2032
- Figure 64: Asia Pacific Fruit & Vegetable Pieces and Powders Market Volume (K Tons), by Application 2024 & 2032
- Figure 65: Asia Pacific Fruit & Vegetable Pieces and Powders Market Revenue Share (%), by Application 2024 & 2032
- Figure 66: Asia Pacific Fruit & Vegetable Pieces and Powders Market Volume Share (%), by Application 2024 & 2032
- Figure 67: Asia Pacific Fruit & Vegetable Pieces and Powders Market Revenue (Million), by Country 2024 & 2032
- Figure 68: Asia Pacific Fruit & Vegetable Pieces and Powders Market Volume (K Tons), by Country 2024 & 2032
- Figure 69: Asia Pacific Fruit & Vegetable Pieces and Powders Market Revenue Share (%), by Country 2024 & 2032
- Figure 70: Asia Pacific Fruit & Vegetable Pieces and Powders Market Volume Share (%), by Country 2024 & 2032
- Figure 71: South America Fruit & Vegetable Pieces and Powders Market Revenue (Million), by Ingredient Type 2024 & 2032
- Figure 72: South America Fruit & Vegetable Pieces and Powders Market Volume (K Tons), by Ingredient Type 2024 & 2032
- Figure 73: South America Fruit & Vegetable Pieces and Powders Market Revenue Share (%), by Ingredient Type 2024 & 2032
- Figure 74: South America Fruit & Vegetable Pieces and Powders Market Volume Share (%), by Ingredient Type 2024 & 2032
- Figure 75: South America Fruit & Vegetable Pieces and Powders Market Revenue (Million), by Product Type 2024 & 2032
- Figure 76: South America Fruit & Vegetable Pieces and Powders Market Volume (K Tons), by Product Type 2024 & 2032
- Figure 77: South America Fruit & Vegetable Pieces and Powders Market Revenue Share (%), by Product Type 2024 & 2032
- Figure 78: South America Fruit & Vegetable Pieces and Powders Market Volume Share (%), by Product Type 2024 & 2032
- Figure 79: South America Fruit & Vegetable Pieces and Powders Market Revenue (Million), by Application 2024 & 2032
- Figure 80: South America Fruit & Vegetable Pieces and Powders Market Volume (K Tons), by Application 2024 & 2032
- Figure 81: South America Fruit & Vegetable Pieces and Powders Market Revenue Share (%), by Application 2024 & 2032
- Figure 82: South America Fruit & Vegetable Pieces and Powders Market Volume Share (%), by Application 2024 & 2032
- Figure 83: South America Fruit & Vegetable Pieces and Powders Market Revenue (Million), by Country 2024 & 2032
- Figure 84: South America Fruit & Vegetable Pieces and Powders Market Volume (K Tons), by Country 2024 & 2032
- Figure 85: South America Fruit & Vegetable Pieces and Powders Market Revenue Share (%), by Country 2024 & 2032
- Figure 86: South America Fruit & Vegetable Pieces and Powders Market Volume Share (%), by Country 2024 & 2032
- Figure 87: Middle East and Africa Fruit & Vegetable Pieces and Powders Market Revenue (Million), by Ingredient Type 2024 & 2032
- Figure 88: Middle East and Africa Fruit & Vegetable Pieces and Powders Market Volume (K Tons), by Ingredient Type 2024 & 2032
- Figure 89: Middle East and Africa Fruit & Vegetable Pieces and Powders Market Revenue Share (%), by Ingredient Type 2024 & 2032
- Figure 90: Middle East and Africa Fruit & Vegetable Pieces and Powders Market Volume Share (%), by Ingredient Type 2024 & 2032
- Figure 91: Middle East and Africa Fruit & Vegetable Pieces and Powders Market Revenue (Million), by Product Type 2024 & 2032
- Figure 92: Middle East and Africa Fruit & Vegetable Pieces and Powders Market Volume (K Tons), by Product Type 2024 & 2032
- Figure 93: Middle East and Africa Fruit & Vegetable Pieces and Powders Market Revenue Share (%), by Product Type 2024 & 2032
- Figure 94: Middle East and Africa Fruit & Vegetable Pieces and Powders Market Volume Share (%), by Product Type 2024 & 2032
- Figure 95: Middle East and Africa Fruit & Vegetable Pieces and Powders Market Revenue (Million), by Application 2024 & 2032
- Figure 96: Middle East and Africa Fruit & Vegetable Pieces and Powders Market Volume (K Tons), by Application 2024 & 2032
- Figure 97: Middle East and Africa Fruit & Vegetable Pieces and Powders Market Revenue Share (%), by Application 2024 & 2032
- Figure 98: Middle East and Africa Fruit & Vegetable Pieces and Powders Market Volume Share (%), by Application 2024 & 2032
- Figure 99: Middle East and Africa Fruit & Vegetable Pieces and Powders Market Revenue (Million), by Country 2024 & 2032
- Figure 100: Middle East and Africa Fruit & Vegetable Pieces and Powders Market Volume (K Tons), by Country 2024 & 2032
- Figure 101: Middle East and Africa Fruit & Vegetable Pieces and Powders Market Revenue Share (%), by Country 2024 & 2032
- Figure 102: Middle East and Africa Fruit & Vegetable Pieces and Powders Market Volume Share (%), by Country 2024 & 2032
List of Tables
- Table 1: Global Fruit & Vegetable Pieces and Powders Market Revenue Million Forecast, by Region 2019 & 2032
- Table 2: Global Fruit & Vegetable Pieces and Powders Market Volume K Tons Forecast, by Region 2019 & 2032
- Table 3: Global Fruit & Vegetable Pieces and Powders Market Revenue Million Forecast, by Ingredient Type 2019 & 2032
- Table 4: Global Fruit & Vegetable Pieces and Powders Market Volume K Tons Forecast, by Ingredient Type 2019 & 2032
- Table 5: Global Fruit & Vegetable Pieces and Powders Market Revenue Million Forecast, by Product Type 2019 & 2032
- Table 6: Global Fruit & Vegetable Pieces and Powders Market Volume K Tons Forecast, by Product Type 2019 & 2032
- Table 7: Global Fruit & Vegetable Pieces and Powders Market Revenue Million Forecast, by Application 2019 & 2032
- Table 8: Global Fruit & Vegetable Pieces and Powders Market Volume K Tons Forecast, by Application 2019 & 2032
- Table 9: Global Fruit & Vegetable Pieces and Powders Market Revenue Million Forecast, by Region 2019 & 2032
- Table 10: Global Fruit & Vegetable Pieces and Powders Market Volume K Tons Forecast, by Region 2019 & 2032
- Table 11: Global Fruit & Vegetable Pieces and Powders Market Revenue Million Forecast, by Country 2019 & 2032
- Table 12: Global Fruit & Vegetable Pieces and Powders Market Volume K Tons Forecast, by Country 2019 & 2032
- Table 13: United States Fruit & Vegetable Pieces and Powders Market Revenue (Million) Forecast, by Application 2019 & 2032
- Table 14: United States Fruit & Vegetable Pieces and Powders Market Volume (K Tons) Forecast, by Application 2019 & 2032
- Table 15: Canada Fruit & Vegetable Pieces and Powders Market Revenue (Million) Forecast, by Application 2019 & 2032
- Table 16: Canada Fruit & Vegetable Pieces and Powders Market Volume (K Tons) Forecast, by Application 2019 & 2032
- Table 17: Mexico Fruit & Vegetable Pieces and Powders Market Revenue (Million) Forecast, by Application 2019 & 2032
- Table 18: Mexico Fruit & Vegetable Pieces and Powders Market Volume (K Tons) Forecast, by Application 2019 & 2032
- Table 19: Rest of North America Fruit & Vegetable Pieces and Powders Market Revenue (Million) Forecast, by Application 2019 & 2032
- Table 20: Rest of North America Fruit & Vegetable Pieces and Powders Market Volume (K Tons) Forecast, by Application 2019 & 2032
- Table 21: Global Fruit & Vegetable Pieces and Powders Market Revenue Million Forecast, by Country 2019 & 2032
- Table 22: Global Fruit & Vegetable Pieces and Powders Market Volume K Tons Forecast, by Country 2019 & 2032
- Table 23: Spain Fruit & Vegetable Pieces and Powders Market Revenue (Million) Forecast, by Application 2019 & 2032
- Table 24: Spain Fruit & Vegetable Pieces and Powders Market Volume (K Tons) Forecast, by Application 2019 & 2032
- Table 25: United Kingdom Fruit & Vegetable Pieces and Powders Market Revenue (Million) Forecast, by Application 2019 & 2032
- Table 26: United Kingdom Fruit & Vegetable Pieces and Powders Market Volume (K Tons) Forecast, by Application 2019 & 2032
- Table 27: France Fruit & Vegetable Pieces and Powders Market Revenue (Million) Forecast, by Application 2019 & 2032
- Table 28: France Fruit & Vegetable Pieces and Powders Market Volume (K Tons) Forecast, by Application 2019 & 2032
- Table 29: Germany Fruit & Vegetable Pieces and Powders Market Revenue (Million) Forecast, by Application 2019 & 2032
- Table 30: Germany Fruit & Vegetable Pieces and Powders Market Volume (K Tons) Forecast, by Application 2019 & 2032
- Table 31: Russia Fruit & Vegetable Pieces and Powders Market Revenue (Million) Forecast, by Application 2019 & 2032
- Table 32: Russia Fruit & Vegetable Pieces and Powders Market Volume (K Tons) Forecast, by Application 2019 & 2032
- Table 33: Italy Fruit & Vegetable Pieces and Powders Market Revenue (Million) Forecast, by Application 2019 & 2032
- Table 34: Italy Fruit & Vegetable Pieces and Powders Market Volume (K Tons) Forecast, by Application 2019 & 2032
- Table 35: Rest of Europe Fruit & Vegetable Pieces and Powders Market Revenue (Million) Forecast, by Application 2019 & 2032
- Table 36: Rest of Europe Fruit & Vegetable Pieces and Powders Market Volume (K Tons) Forecast, by Application 2019 & 2032
- Table 37: Global Fruit & Vegetable Pieces and Powders Market Revenue Million Forecast, by Country 2019 & 2032
- Table 38: Global Fruit & Vegetable Pieces and Powders Market Volume K Tons Forecast, by Country 2019 & 2032
- Table 39: China Fruit & Vegetable Pieces and Powders Market Revenue (Million) Forecast, by Application 2019 & 2032
- Table 40: China Fruit & Vegetable Pieces and Powders Market Volume (K Tons) Forecast, by Application 2019 & 2032
- Table 41: India Fruit & Vegetable Pieces and Powders Market Revenue (Million) Forecast, by Application 2019 & 2032
- Table 42: India Fruit & Vegetable Pieces and Powders Market Volume (K Tons) Forecast, by Application 2019 & 2032
- Table 43: Japan Fruit & Vegetable Pieces and Powders Market Revenue (Million) Forecast, by Application 2019 & 2032
- Table 44: Japan Fruit & Vegetable Pieces and Powders Market Volume (K Tons) Forecast, by Application 2019 & 2032
- Table 45: Australia Fruit & Vegetable Pieces and Powders Market Revenue (Million) Forecast, by Application 2019 & 2032
- Table 46: Australia Fruit & Vegetable Pieces and Powders Market Volume (K Tons) Forecast, by Application 2019 & 2032
- Table 47: Rest of Asia Pacific Fruit & Vegetable Pieces and Powders Market Revenue (Million) Forecast, by Application 2019 & 2032
- Table 48: Rest of Asia Pacific Fruit & Vegetable Pieces and Powders Market Volume (K Tons) Forecast, by Application 2019 & 2032
- Table 49: Global Fruit & Vegetable Pieces and Powders Market Revenue Million Forecast, by Country 2019 & 2032
- Table 50: Global Fruit & Vegetable Pieces and Powders Market Volume K Tons Forecast, by Country 2019 & 2032
- Table 51: Brazil Fruit & Vegetable Pieces and Powders Market Revenue (Million) Forecast, by Application 2019 & 2032
- Table 52: Brazil Fruit & Vegetable Pieces and Powders Market Volume (K Tons) Forecast, by Application 2019 & 2032
- Table 53: Argentina Fruit & Vegetable Pieces and Powders Market Revenue (Million) Forecast, by Application 2019 & 2032
- Table 54: Argentina Fruit & Vegetable Pieces and Powders Market Volume (K Tons) Forecast, by Application 2019 & 2032
- Table 55: Rest of South America Fruit & Vegetable Pieces and Powders Market Revenue (Million) Forecast, by Application 2019 & 2032
- Table 56: Rest of South America Fruit & Vegetable Pieces and Powders Market Volume (K Tons) Forecast, by Application 2019 & 2032
- Table 57: Global Fruit & Vegetable Pieces and Powders Market Revenue Million Forecast, by Country 2019 & 2032
- Table 58: Global Fruit & Vegetable Pieces and Powders Market Volume K Tons Forecast, by Country 2019 & 2032
- Table 59: South Africa Fruit & Vegetable Pieces and Powders Market Revenue (Million) Forecast, by Application 2019 & 2032
- Table 60: South Africa Fruit & Vegetable Pieces and Powders Market Volume (K Tons) Forecast, by Application 2019 & 2032
- Table 61: Saudi Arabia Fruit & Vegetable Pieces and Powders Market Revenue (Million) Forecast, by Application 2019 & 2032
- Table 62: Saudi Arabia Fruit & Vegetable Pieces and Powders Market Volume (K Tons) Forecast, by Application 2019 & 2032
- Table 63: Rest of Middle East and Africa Fruit & Vegetable Pieces and Powders Market Revenue (Million) Forecast, by Application 2019 & 2032
- Table 64: Rest of Middle East and Africa Fruit & Vegetable Pieces and Powders Market Volume (K Tons) Forecast, by Application 2019 & 2032
- Table 65: Global Fruit & Vegetable Pieces and Powders Market Revenue Million Forecast, by Ingredient Type 2019 & 2032
- Table 66: Global Fruit & Vegetable Pieces and Powders Market Volume K Tons Forecast, by Ingredient Type 2019 & 2032
- Table 67: Global Fruit & Vegetable Pieces and Powders Market Revenue Million Forecast, by Product Type 2019 & 2032
- Table 68: Global Fruit & Vegetable Pieces and Powders Market Volume K Tons Forecast, by Product Type 2019 & 2032
- Table 69: Global Fruit & Vegetable Pieces and Powders Market Revenue Million Forecast, by Application 2019 & 2032
- Table 70: Global Fruit & Vegetable Pieces and Powders Market Volume K Tons Forecast, by Application 2019 & 2032
- Table 71: Global Fruit & Vegetable Pieces and Powders Market Revenue Million Forecast, by Country 2019 & 2032
- Table 72: Global Fruit & Vegetable Pieces and Powders Market Volume K Tons Forecast, by Country 2019 & 2032
- Table 73: United States Fruit & Vegetable Pieces and Powders Market Revenue (Million) Forecast, by Application 2019 & 2032
- Table 74: United States Fruit & Vegetable Pieces and Powders Market Volume (K Tons) Forecast, by Application 2019 & 2032
- Table 75: Canada Fruit & Vegetable Pieces and Powders Market Revenue (Million) Forecast, by Application 2019 & 2032
- Table 76: Canada Fruit & Vegetable Pieces and Powders Market Volume (K Tons) Forecast, by Application 2019 & 2032
- Table 77: Mexico Fruit & Vegetable Pieces and Powders Market Revenue (Million) Forecast, by Application 2019 & 2032
- Table 78: Mexico Fruit & Vegetable Pieces and Powders Market Volume (K Tons) Forecast, by Application 2019 & 2032
- Table 79: Rest of North America Fruit & Vegetable Pieces and Powders Market Revenue (Million) Forecast, by Application 2019 & 2032
- Table 80: Rest of North America Fruit & Vegetable Pieces and Powders Market Volume (K Tons) Forecast, by Application 2019 & 2032
- Table 81: Global Fruit & Vegetable Pieces and Powders Market Revenue Million Forecast, by Ingredient Type 2019 & 2032
- Table 82: Global Fruit & Vegetable Pieces and Powders Market Volume K Tons Forecast, by Ingredient Type 2019 & 2032
- Table 83: Global Fruit & Vegetable Pieces and Powders Market Revenue Million Forecast, by Product Type 2019 & 2032
- Table 84: Global Fruit & Vegetable Pieces and Powders Market Volume K Tons Forecast, by Product Type 2019 & 2032
- Table 85: Global Fruit & Vegetable Pieces and Powders Market Revenue Million Forecast, by Application 2019 & 2032
- Table 86: Global Fruit & Vegetable Pieces and Powders Market Volume K Tons Forecast, by Application 2019 & 2032
- Table 87: Global Fruit & Vegetable Pieces and Powders Market Revenue Million Forecast, by Country 2019 & 2032
- Table 88: Global Fruit & Vegetable Pieces and Powders Market Volume K Tons Forecast, by Country 2019 & 2032
- Table 89: Spain Fruit & Vegetable Pieces and Powders Market Revenue (Million) Forecast, by Application 2019 & 2032
- Table 90: Spain Fruit & Vegetable Pieces and Powders Market Volume (K Tons) Forecast, by Application 2019 & 2032
- Table 91: United Kingdom Fruit & Vegetable Pieces and Powders Market Revenue (Million) Forecast, by Application 2019 & 2032
- Table 92: United Kingdom Fruit & Vegetable Pieces and Powders Market Volume (K Tons) Forecast, by Application 2019 & 2032
- Table 93: France Fruit & Vegetable Pieces and Powders Market Revenue (Million) Forecast, by Application 2019 & 2032
- Table 94: France Fruit & Vegetable Pieces and Powders Market Volume (K Tons) Forecast, by Application 2019 & 2032
- Table 95: Germany Fruit & Vegetable Pieces and Powders Market Revenue (Million) Forecast, by Application 2019 & 2032
- Table 96: Germany Fruit & Vegetable Pieces and Powders Market Volume (K Tons) Forecast, by Application 2019 & 2032
- Table 97: Russia Fruit & Vegetable Pieces and Powders Market Revenue (Million) Forecast, by Application 2019 & 2032
- Table 98: Russia Fruit & Vegetable Pieces and Powders Market Volume (K Tons) Forecast, by Application 2019 & 2032
- Table 99: Italy Fruit & Vegetable Pieces and Powders Market Revenue (Million) Forecast, by Application 2019 & 2032
- Table 100: Italy Fruit & Vegetable Pieces and Powders Market Volume (K Tons) Forecast, by Application 2019 & 2032
- Table 101: Rest of Europe Fruit & Vegetable Pieces and Powders Market Revenue (Million) Forecast, by Application 2019 & 2032
- Table 102: Rest of Europe Fruit & Vegetable Pieces and Powders Market Volume (K Tons) Forecast, by Application 2019 & 2032
- Table 103: Global Fruit & Vegetable Pieces and Powders Market Revenue Million Forecast, by Ingredient Type 2019 & 2032
- Table 104: Global Fruit & Vegetable Pieces and Powders Market Volume K Tons Forecast, by Ingredient Type 2019 & 2032
- Table 105: Global Fruit & Vegetable Pieces and Powders Market Revenue Million Forecast, by Product Type 2019 & 2032
- Table 106: Global Fruit & Vegetable Pieces and Powders Market Volume K Tons Forecast, by Product Type 2019 & 2032
- Table 107: Global Fruit & Vegetable Pieces and Powders Market Revenue Million Forecast, by Application 2019 & 2032
- Table 108: Global Fruit & Vegetable Pieces and Powders Market Volume K Tons Forecast, by Application 2019 & 2032
- Table 109: Global Fruit & Vegetable Pieces and Powders Market Revenue Million Forecast, by Country 2019 & 2032
- Table 110: Global Fruit & Vegetable Pieces and Powders Market Volume K Tons Forecast, by Country 2019 & 2032
- Table 111: China Fruit & Vegetable Pieces and Powders Market Revenue (Million) Forecast, by Application 2019 & 2032
- Table 112: China Fruit & Vegetable Pieces and Powders Market Volume (K Tons) Forecast, by Application 2019 & 2032
- Table 113: India Fruit & Vegetable Pieces and Powders Market Revenue (Million) Forecast, by Application 2019 & 2032
- Table 114: India Fruit & Vegetable Pieces and Powders Market Volume (K Tons) Forecast, by Application 2019 & 2032
- Table 115: Japan Fruit & Vegetable Pieces and Powders Market Revenue (Million) Forecast, by Application 2019 & 2032
- Table 116: Japan Fruit & Vegetable Pieces and Powders Market Volume (K Tons) Forecast, by Application 2019 & 2032
- Table 117: Australia Fruit & Vegetable Pieces and Powders Market Revenue (Million) Forecast, by Application 2019 & 2032
- Table 118: Australia Fruit & Vegetable Pieces and Powders Market Volume (K Tons) Forecast, by Application 2019 & 2032
- Table 119: Rest of Asia Pacific Fruit & Vegetable Pieces and Powders Market Revenue (Million) Forecast, by Application 2019 & 2032
- Table 120: Rest of Asia Pacific Fruit & Vegetable Pieces and Powders Market Volume (K Tons) Forecast, by Application 2019 & 2032
- Table 121: Global Fruit & Vegetable Pieces and Powders Market Revenue Million Forecast, by Ingredient Type 2019 & 2032
- Table 122: Global Fruit & Vegetable Pieces and Powders Market Volume K Tons Forecast, by Ingredient Type 2019 & 2032
- Table 123: Global Fruit & Vegetable Pieces and Powders Market Revenue Million Forecast, by Product Type 2019 & 2032
- Table 124: Global Fruit & Vegetable Pieces and Powders Market Volume K Tons Forecast, by Product Type 2019 & 2032
- Table 125: Global Fruit & Vegetable Pieces and Powders Market Revenue Million Forecast, by Application 2019 & 2032
- Table 126: Global Fruit & Vegetable Pieces and Powders Market Volume K Tons Forecast, by Application 2019 & 2032
- Table 127: Global Fruit & Vegetable Pieces and Powders Market Revenue Million Forecast, by Country 2019 & 2032
- Table 128: Global Fruit & Vegetable Pieces and Powders Market Volume K Tons Forecast, by Country 2019 & 2032
- Table 129: Brazil Fruit & Vegetable Pieces and Powders Market Revenue (Million) Forecast, by Application 2019 & 2032
- Table 130: Brazil Fruit & Vegetable Pieces and Powders Market Volume (K Tons) Forecast, by Application 2019 & 2032
- Table 131: Argentina Fruit & Vegetable Pieces and Powders Market Revenue (Million) Forecast, by Application 2019 & 2032
- Table 132: Argentina Fruit & Vegetable Pieces and Powders Market Volume (K Tons) Forecast, by Application 2019 & 2032
- Table 133: Rest of South America Fruit & Vegetable Pieces and Powders Market Revenue (Million) Forecast, by Application 2019 & 2032
- Table 134: Rest of South America Fruit & Vegetable Pieces and Powders Market Volume (K Tons) Forecast, by Application 2019 & 2032
- Table 135: Global Fruit & Vegetable Pieces and Powders Market Revenue Million Forecast, by Ingredient Type 2019 & 2032
- Table 136: Global Fruit & Vegetable Pieces and Powders Market Volume K Tons Forecast, by Ingredient Type 2019 & 2032
- Table 137: Global Fruit & Vegetable Pieces and Powders Market Revenue Million Forecast, by Product Type 2019 & 2032
- Table 138: Global Fruit & Vegetable Pieces and Powders Market Volume K Tons Forecast, by Product Type 2019 & 2032
- Table 139: Global Fruit & Vegetable Pieces and Powders Market Revenue Million Forecast, by Application 2019 & 2032
- Table 140: Global Fruit & Vegetable Pieces and Powders Market Volume K Tons Forecast, by Application 2019 & 2032
- Table 141: Global Fruit & Vegetable Pieces and Powders Market Revenue Million Forecast, by Country 2019 & 2032
- Table 142: Global Fruit & Vegetable Pieces and Powders Market Volume K Tons Forecast, by Country 2019 & 2032
- Table 143: South Africa Fruit & Vegetable Pieces and Powders Market Revenue (Million) Forecast, by Application 2019 & 2032
- Table 144: South Africa Fruit & Vegetable Pieces and Powders Market Volume (K Tons) Forecast, by Application 2019 & 2032
- Table 145: Saudi Arabia Fruit & Vegetable Pieces and Powders Market Revenue (Million) Forecast, by Application 2019 & 2032
- Table 146: Saudi Arabia Fruit & Vegetable Pieces and Powders Market Volume (K Tons) Forecast, by Application 2019 & 2032
- Table 147: Rest of Middle East and Africa Fruit & Vegetable Pieces and Powders Market Revenue (Million) Forecast, by Application 2019 & 2032
- Table 148: Rest of Middle East and Africa Fruit & Vegetable Pieces and Powders Market Volume (K Tons) Forecast, by Application 2019 & 2032
Frequently Asked Questions
1. What is the projected Compound Annual Growth Rate (CAGR) of the Fruit & Vegetable Pieces and Powders Market?
The projected CAGR is approximately 3.98%.
2. Which companies are prominent players in the Fruit & Vegetable Pieces and Powders Market?
Key companies in the market include Südzucker AG (Agrana Group), Dohler Group, Symrise AG, International Flavors & Fragrances Inc, European Freeze Dry Ltd, Archer Daniels Midland Company, Olam International, Cargill Inc, SunOpta Inc, Van Drunen Farms, Kanegrade Ltd.
3. What are the main segments of the Fruit & Vegetable Pieces and Powders Market?
The market segments include Ingredient Type, Product Type, Application.
4. Can you provide details about the market size?
The market size is estimated to be USD XX Million as of 2022.
5. What are some drivers contributing to market growth?
Increasing Demand for Protein-Rich Food; Increasing Demand for Plant-Based and Organic Ingredients.
6. What are the notable trends driving market growth?
Increase in Demand for Natural Ingredients in the Food and Beverage Industry.
7. Are there any restraints impacting market growth?
Presence of Alternative Proteins.
8. Can you provide examples of recent developments in the market?
June 2022: Symrise introduced Diana Food, an extensive line of active components and blueberry ingredients. The company claims that its newly launched product qualities and performance benefits include different organoleptic properties, application-specific high-quality standards for baby food, distinctive certifications like organic, and the option to assert health benefits.
9. What pricing options are available for accessing the report?
Pricing options include single-user, multi-user, and enterprise licenses priced at USD 4750, USD 5250, and USD 8750 respectively.
10. Is the market size provided in terms of value or volume?
The market size is provided in terms of value, measured in Million and volume, measured in K Tons.
11. Are there any specific market keywords associated with the report?
Yes, the market keyword associated with the report is "Fruit & Vegetable Pieces and Powders Market," which aids in identifying and referencing the specific market segment covered.
12. How do I determine which pricing option suits my needs best?
The pricing options vary based on user requirements and access needs. Individual users may opt for single-user licenses, while businesses requiring broader access may choose multi-user or enterprise licenses for cost-effective access to the report.
13. Are there any additional resources or data provided in the Fruit & Vegetable Pieces and Powders Market report?
While the report offers comprehensive insights, it's advisable to review the specific contents or supplementary materials provided to ascertain if additional resources or data are available.
14. How can I stay updated on further developments or reports in the Fruit & Vegetable Pieces and Powders Market?
To stay informed about further developments, trends, and reports in the Fruit & Vegetable Pieces and Powders Market, consider subscribing to industry newsletters, following relevant companies and organizations, or regularly checking reputable industry news sources and publications.
Methodology
Step 1 - Identification of Relevant Samples Size from Population Database


Step 2 - Approaches for Defining Global Market Size (Value, Volume* & Price*)

Note*: In applicable scenarios
Step 3 - Data Sources
Primary Research
- Web Analytics
- Survey Reports
- Research Institute
- Latest Research Reports
- Opinion Leaders
Secondary Research
- Annual Reports
- White Paper
- Latest Press Release
- Industry Association
- Paid Database
- Investor Presentations

Step 4 - Data Triangulation
Involves using different sources of information in order to increase the validity of a study
These sources are likely to be stakeholders in a program - participants, other researchers, program staff, other community members, and so on.
Then we put all data in single framework & apply various statistical tools to find out the dynamic on the market.
During the analysis stage, feedback from the stakeholder groups would be compared to determine areas of agreement as well as areas of divergence


