
Key Insights
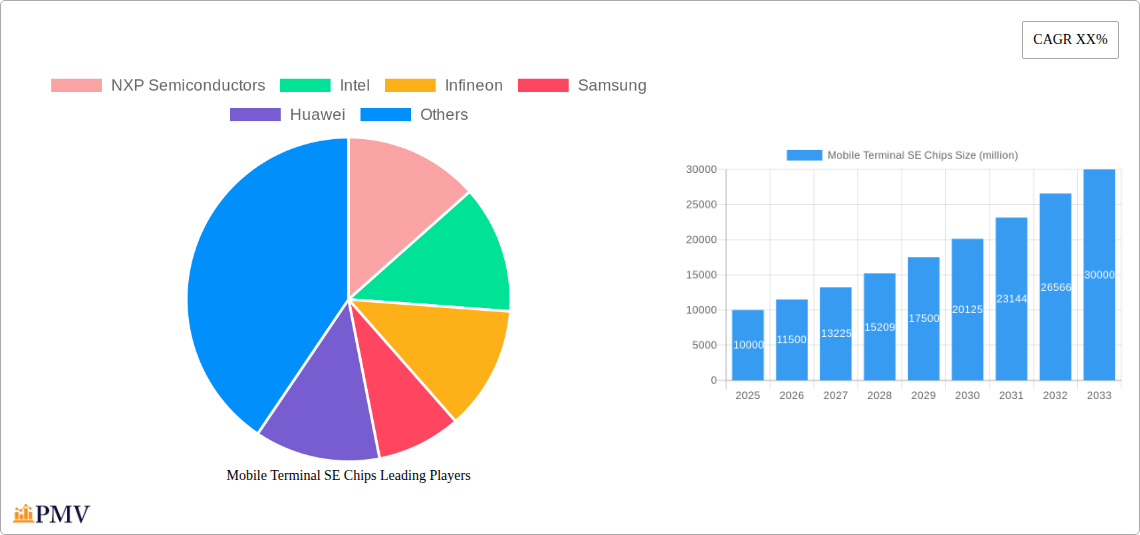
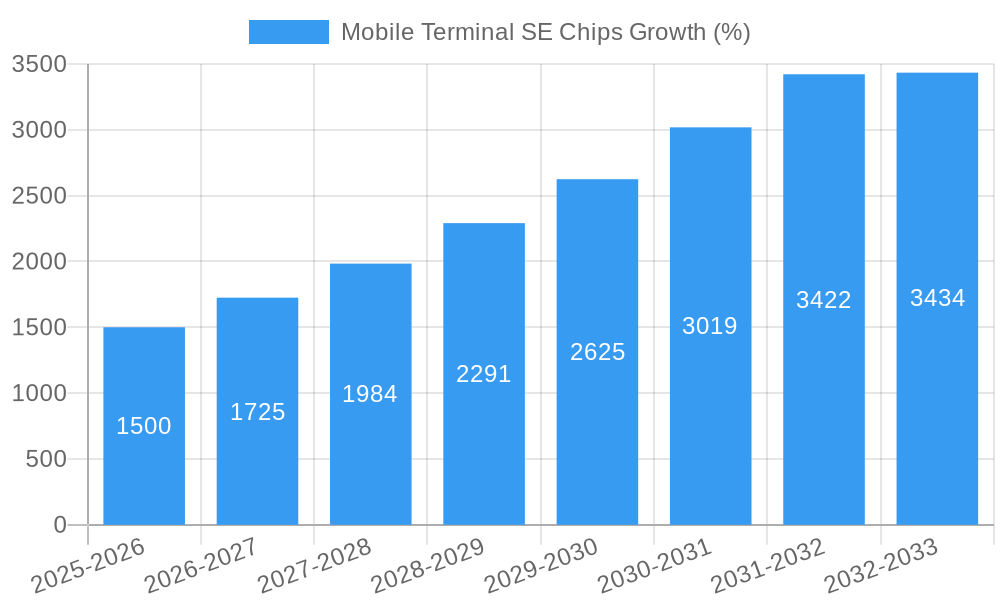
The mobile terminal secure element (SE) chip market is experiencing robust growth, driven by the increasing demand for secure mobile transactions and the proliferation of mobile payment systems. The market, estimated at $10 billion in 2025, is projected to expand at a Compound Annual Growth Rate (CAGR) of 15% from 2025 to 2033, reaching an estimated $30 billion by 2033. This growth is fueled by several key factors, including the rising adoption of near-field communication (NFC) technology for contactless payments, the increasing penetration of smartphones globally, and the growing need for enhanced security features in mobile devices to protect sensitive user data. The integration of SE chips into various mobile applications beyond payments, such as digital identity verification and access control, further contributes to market expansion. Leading players like NXP Semiconductors, Intel, and Infineon are major contributors, leveraging their established expertise in semiconductor technology and secure element solutions. However, competition is intensifying with the emergence of Chinese players like Huawei and Unigroup Guoxin, who are actively investing in R&D and expanding their market share.
The market segmentation reveals a strong preference for higher-end SE chips offering advanced security features and increased processing capabilities. Geographical variations exist, with North America and Europe currently dominating the market due to higher adoption rates of mobile payments and advanced technologies. However, Asia-Pacific is expected to witness significant growth in the coming years due to the increasing smartphone penetration and burgeoning digital economy in developing countries. While the market faces challenges such as the potential for security breaches and evolving regulatory landscapes, the overall outlook remains positive, driven by ongoing technological advancements and the expanding applications for secure elements in mobile devices. The continued focus on enhancing security protocols and integrating innovative features will be critical for sustained growth in this dynamic market.
Mobile Terminal SE Chips Market Report: 2019-2033
This comprehensive report provides an in-depth analysis of the global Mobile Terminal SE Chips market, offering crucial insights for businesses, investors, and stakeholders. Covering the period from 2019 to 2033, with a focus on 2025, this report dissects market structure, competitive dynamics, industry trends, and future projections, empowering informed decision-making. The report leverages extensive research and data analysis to deliver actionable insights, focusing on key market players, emerging technologies, and regional variations. The total market size in 2025 is estimated at $XX million, with a projected CAGR of XX% from 2025 to 2033.
Mobile Terminal SE Chips Market Structure & Competitive Dynamics
The global Mobile Terminal SE Chips market exhibits a moderately concentrated structure, with key players like NXP Semiconductors, Intel, Infineon, Samsung, and Huawei holding significant market share. Market concentration is further analyzed through the Herfindahl-Hirschman Index (HHI), revealing the level of competition and potential for future consolidation. The report also examines the innovation ecosystems surrounding SE chip development, including R&D investments, collaborative partnerships, and intellectual property landscape. Regulatory frameworks governing the design, manufacturing, and deployment of SE chips across various regions are thoroughly analyzed, along with their impact on market growth. Product substitutes, such as software-based security solutions, are considered, assessing their potential threat to the dominance of SE chips. Further, the report analyses end-user trends, including increasing demand for enhanced security features in mobile devices and the Internet of Things (IoT), and the influence of these trends on the market. Finally, a detailed analysis of M&A activities within the sector is provided, including transaction values (e.g., an estimated $XX million deal in 2024 between Company A and Company B) and their implications for market consolidation and technological advancements. Key market share data for 2025 are included, with NXP Semiconductors holding approximately XX%, followed by Intel at XX%, Infineon at XX%, and Samsung at XX%.
Mobile Terminal SE Chips Industry Trends & Insights
The Mobile Terminal SE Chips market is driven by several key factors, including the rising adoption of smartphones and other mobile devices, the increasing demand for secure mobile transactions, and the growing penetration of the IoT. The CAGR for the market during the forecast period (2025-2033) is projected to be XX%. Technological disruptions, such as advancements in chip architecture and encryption algorithms, are continuously shaping the landscape. Consumer preferences for enhanced security and privacy are further fueling demand. Market penetration analysis reveals high adoption rates in developed regions, with emerging markets poised for significant growth. Competitive dynamics are characterized by intense rivalry among established players and the emergence of new entrants, leading to innovation and price competition. These factors contribute to market growth and present both opportunities and challenges for existing and new market participants. The report details the impact of these drivers, disruptions, and preferences with specific data points illustrating the market's evolution and future trajectory.
Dominant Markets & Segments in Mobile Terminal SE Chips
The report identifies [Leading Region/Country] as the dominant market for Mobile Terminal SE Chips in 2025, accounting for approximately XX% of the global market. This dominance stems from several key drivers:
- Robust economic growth: High GDP growth fueled strong demand for mobile devices.
- Developed infrastructure: Advanced telecommunications networks and robust digital infrastructure support high-performance mobile technology.
- Favorable government policies: Supportive regulatory frameworks promote technological advancement and market expansion.
- High smartphone penetration: Extensive smartphone usage creates a vast market for secure mobile technologies.
This dominance is further substantiated through a thorough analysis of market size, growth rates, and consumer behavior within [Leading Region/Country]. Detailed comparative analyses with other regions highlight the significant differences in market dynamics and underlying drivers, providing insights into geographic opportunities.
Mobile Terminal SE Chips Product Innovations
Recent innovations in Mobile Terminal SE Chips include advancements in secure element (SE) architectures, enabling enhanced security protocols and faster processing speeds. The integration of advanced cryptographic algorithms and hardware security modules (HSMs) significantly improves data protection. New applications are emerging in areas such as mobile payments, digital identity verification, and IoT security, broadening the market scope. This technological evolution enhances product differentiation and contributes to the competitive advantage of leading players in the market.
Report Segmentation & Scope
This report segments the Mobile Terminal SE Chips market based on chip type (e.g., embedded SE, standalone SE), application (e.g., mobile payments, eSIM), and geography. Each segment's market size, growth projections, and competitive dynamics are analyzed separately, providing granular insights. Growth projections for each segment are based on thorough market research and analysis of projected growth trends. The report also analyzes the competitive landscape within each segment, identifying key players and their market strategies.
Key Drivers of Mobile Terminal SE Chips Growth
Several factors are driving the growth of the Mobile Terminal SE Chips market: The increasing adoption of mobile devices and the expansion of mobile payment systems worldwide are key drivers. Furthermore, growing concerns about data security and privacy are pushing for the adoption of advanced secure technologies, increasing the demand for SE chips. Government regulations mandating enhanced security in mobile transactions further boost market expansion.
Challenges in the Mobile Terminal SE Chips Sector
Challenges facing the Mobile Terminal SE Chips market include the high cost of development and manufacturing, potentially limiting broader adoption. Competition from alternative security solutions and the increasing sophistication of cyberattacks pose significant threats. Supply chain disruptions and geopolitical uncertainties can also influence market growth. Finally, stringent regulatory compliance requirements add complexity to product development and deployment.
Leading Players in the Mobile Terminal SE Chips Market
- NXP Semiconductors
- Intel
- Infineon
- Samsung
- Huawei
- Unigroup Guoxin
- Nations Technologies
- CEC Huada Electronic
- Wuhan Ruinajie Semiconductor
- Horizon Robotics
- Datang Telecom Technology
- Sinosun Technology
- Beijing Hongsi Electronic Technology
- C Core Technology
- Shenzhen Goodix
Key Developments in Mobile Terminal SE Chips Sector
- January 2023: NXP Semiconductors announced a new generation of SE chips with enhanced security features.
- March 2022: Infineon Technologies partnered with a major mobile manufacturer to integrate its SE chips into their latest flagship device.
- June 2021: Samsung launched a new line of SE chips optimized for IoT applications. (Further developments to be added based on available data.)
Strategic Mobile Terminal SE Chips Market Outlook
The future of the Mobile Terminal SE Chips market is promising, driven by sustained growth in mobile device adoption, expanding IoT deployments, and increasing demand for secure digital transactions. Strategic opportunities exist for companies to focus on innovation, particularly in areas like biometrics, quantum-resistant cryptography, and advanced encryption techniques. Strategic partnerships and M&A activities will continue to shape the competitive landscape. The market is projected to maintain a healthy growth trajectory for the forecast period, driven by these technological advancements and the inherent need for robust security solutions in an increasingly digital world.
Mobile Terminal SE Chips Segmentation
-
1. Application
- 1.1. Retail Industry
- 1.2. Transportation and Logistics
- 1.3. Healthcare
- 1.4. Industrial Manufacturing
- 1.5. Other
-
2. Types
- 2.1. Symmetric Encryption
- 2.2. Asymmetric Encryption
- 2.3. Abstract Algorithms
Mobile Terminal SE Chips Segmentation By Geography
-
1. North America
- 1.1. United States
- 1.2. Canada
- 1.3. Mexico
-
2. South America
- 2.1. Brazil
- 2.2. Argentina
- 2.3. Rest of South America
-
3. Europe
- 3.1. United Kingdom
- 3.2. Germany
- 3.3. France
- 3.4. Italy
- 3.5. Spain
- 3.6. Russia
- 3.7. Benelux
- 3.8. Nordics
- 3.9. Rest of Europe
-
4. Middle East & Africa
- 4.1. Turkey
- 4.2. Israel
- 4.3. GCC
- 4.4. North Africa
- 4.5. South Africa
- 4.6. Rest of Middle East & Africa
-
5. Asia Pacific
- 5.1. China
- 5.2. India
- 5.3. Japan
- 5.4. South Korea
- 5.5. ASEAN
- 5.6. Oceania
- 5.7. Rest of Asia Pacific

Mobile Terminal SE Chips REPORT HIGHLIGHTS
| Aspects | Details |
|---|---|
| Study Period | 2019-2033 |
| Base Year | 2024 |
| Estimated Year | 2025 |
| Forecast Period | 2025-2033 |
| Historical Period | 2019-2024 |
| Growth Rate | CAGR of XX% from 2019-2033 |
| Segmentation |
|
Table of Contents
- 1. Introduction
- 1.1. Research Scope
- 1.2. Market Segmentation
- 1.3. Research Methodology
- 1.4. Definitions and Assumptions
- 2. Executive Summary
- 2.1. Introduction
- 3. Market Dynamics
- 3.1. Introduction
- 3.2. Market Drivers
- 3.3. Market Restrains
- 3.4. Market Trends
- 4. Market Factor Analysis
- 4.1. Porters Five Forces
- 4.2. Supply/Value Chain
- 4.3. PESTEL analysis
- 4.4. Market Entropy
- 4.5. Patent/Trademark Analysis
- 5. Global Mobile Terminal SE Chips Analysis, Insights and Forecast, 2019-2031
- 5.1. Market Analysis, Insights and Forecast - by Application
- 5.1.1. Retail Industry
- 5.1.2. Transportation and Logistics
- 5.1.3. Healthcare
- 5.1.4. Industrial Manufacturing
- 5.1.5. Other
- 5.2. Market Analysis, Insights and Forecast - by Types
- 5.2.1. Symmetric Encryption
- 5.2.2. Asymmetric Encryption
- 5.2.3. Abstract Algorithms
- 5.3. Market Analysis, Insights and Forecast - by Region
- 5.3.1. North America
- 5.3.2. South America
- 5.3.3. Europe
- 5.3.4. Middle East & Africa
- 5.3.5. Asia Pacific
- 5.1. Market Analysis, Insights and Forecast - by Application
- 6. North America Mobile Terminal SE Chips Analysis, Insights and Forecast, 2019-2031
- 6.1. Market Analysis, Insights and Forecast - by Application
- 6.1.1. Retail Industry
- 6.1.2. Transportation and Logistics
- 6.1.3. Healthcare
- 6.1.4. Industrial Manufacturing
- 6.1.5. Other
- 6.2. Market Analysis, Insights and Forecast - by Types
- 6.2.1. Symmetric Encryption
- 6.2.2. Asymmetric Encryption
- 6.2.3. Abstract Algorithms
- 6.1. Market Analysis, Insights and Forecast - by Application
- 7. South America Mobile Terminal SE Chips Analysis, Insights and Forecast, 2019-2031
- 7.1. Market Analysis, Insights and Forecast - by Application
- 7.1.1. Retail Industry
- 7.1.2. Transportation and Logistics
- 7.1.3. Healthcare
- 7.1.4. Industrial Manufacturing
- 7.1.5. Other
- 7.2. Market Analysis, Insights and Forecast - by Types
- 7.2.1. Symmetric Encryption
- 7.2.2. Asymmetric Encryption
- 7.2.3. Abstract Algorithms
- 7.1. Market Analysis, Insights and Forecast - by Application
- 8. Europe Mobile Terminal SE Chips Analysis, Insights and Forecast, 2019-2031
- 8.1. Market Analysis, Insights and Forecast - by Application
- 8.1.1. Retail Industry
- 8.1.2. Transportation and Logistics
- 8.1.3. Healthcare
- 8.1.4. Industrial Manufacturing
- 8.1.5. Other
- 8.2. Market Analysis, Insights and Forecast - by Types
- 8.2.1. Symmetric Encryption
- 8.2.2. Asymmetric Encryption
- 8.2.3. Abstract Algorithms
- 8.1. Market Analysis, Insights and Forecast - by Application
- 9. Middle East & Africa Mobile Terminal SE Chips Analysis, Insights and Forecast, 2019-2031
- 9.1. Market Analysis, Insights and Forecast - by Application
- 9.1.1. Retail Industry
- 9.1.2. Transportation and Logistics
- 9.1.3. Healthcare
- 9.1.4. Industrial Manufacturing
- 9.1.5. Other
- 9.2. Market Analysis, Insights and Forecast - by Types
- 9.2.1. Symmetric Encryption
- 9.2.2. Asymmetric Encryption
- 9.2.3. Abstract Algorithms
- 9.1. Market Analysis, Insights and Forecast - by Application
- 10. Asia Pacific Mobile Terminal SE Chips Analysis, Insights and Forecast, 2019-2031
- 10.1. Market Analysis, Insights and Forecast - by Application
- 10.1.1. Retail Industry
- 10.1.2. Transportation and Logistics
- 10.1.3. Healthcare
- 10.1.4. Industrial Manufacturing
- 10.1.5. Other
- 10.2. Market Analysis, Insights and Forecast - by Types
- 10.2.1. Symmetric Encryption
- 10.2.2. Asymmetric Encryption
- 10.2.3. Abstract Algorithms
- 10.1. Market Analysis, Insights and Forecast - by Application
- 11. Competitive Analysis
- 11.1. Global Market Share Analysis 2024
- 11.2. Company Profiles
- 11.2.1 NXP Semiconductors
- 11.2.1.1. Overview
- 11.2.1.2. Products
- 11.2.1.3. SWOT Analysis
- 11.2.1.4. Recent Developments
- 11.2.1.5. Financials (Based on Availability)
- 11.2.2 Intel
- 11.2.2.1. Overview
- 11.2.2.2. Products
- 11.2.2.3. SWOT Analysis
- 11.2.2.4. Recent Developments
- 11.2.2.5. Financials (Based on Availability)
- 11.2.3 Infineon
- 11.2.3.1. Overview
- 11.2.3.2. Products
- 11.2.3.3. SWOT Analysis
- 11.2.3.4. Recent Developments
- 11.2.3.5. Financials (Based on Availability)
- 11.2.4 Samsung
- 11.2.4.1. Overview
- 11.2.4.2. Products
- 11.2.4.3. SWOT Analysis
- 11.2.4.4. Recent Developments
- 11.2.4.5. Financials (Based on Availability)
- 11.2.5 Huawei
- 11.2.5.1. Overview
- 11.2.5.2. Products
- 11.2.5.3. SWOT Analysis
- 11.2.5.4. Recent Developments
- 11.2.5.5. Financials (Based on Availability)
- 11.2.6 Unigroup Guoxin
- 11.2.6.1. Overview
- 11.2.6.2. Products
- 11.2.6.3. SWOT Analysis
- 11.2.6.4. Recent Developments
- 11.2.6.5. Financials (Based on Availability)
- 11.2.7 Nations Technologies
- 11.2.7.1. Overview
- 11.2.7.2. Products
- 11.2.7.3. SWOT Analysis
- 11.2.7.4. Recent Developments
- 11.2.7.5. Financials (Based on Availability)
- 11.2.8 CEC Huada Electronic
- 11.2.8.1. Overview
- 11.2.8.2. Products
- 11.2.8.3. SWOT Analysis
- 11.2.8.4. Recent Developments
- 11.2.8.5. Financials (Based on Availability)
- 11.2.9 Wuhan Ruinajie Semiconductor
- 11.2.9.1. Overview
- 11.2.9.2. Products
- 11.2.9.3. SWOT Analysis
- 11.2.9.4. Recent Developments
- 11.2.9.5. Financials (Based on Availability)
- 11.2.10 Horizon Robotics
- 11.2.10.1. Overview
- 11.2.10.2. Products
- 11.2.10.3. SWOT Analysis
- 11.2.10.4. Recent Developments
- 11.2.10.5. Financials (Based on Availability)
- 11.2.11 Datang Telecom Technology
- 11.2.11.1. Overview
- 11.2.11.2. Products
- 11.2.11.3. SWOT Analysis
- 11.2.11.4. Recent Developments
- 11.2.11.5. Financials (Based on Availability)
- 11.2.12 Sinosun Technology
- 11.2.12.1. Overview
- 11.2.12.2. Products
- 11.2.12.3. SWOT Analysis
- 11.2.12.4. Recent Developments
- 11.2.12.5. Financials (Based on Availability)
- 11.2.13 Beijing Hongsi Electronic Technology
- 11.2.13.1. Overview
- 11.2.13.2. Products
- 11.2.13.3. SWOT Analysis
- 11.2.13.4. Recent Developments
- 11.2.13.5. Financials (Based on Availability)
- 11.2.14 C Core Technology
- 11.2.14.1. Overview
- 11.2.14.2. Products
- 11.2.14.3. SWOT Analysis
- 11.2.14.4. Recent Developments
- 11.2.14.5. Financials (Based on Availability)
- 11.2.15 Shenzhen Goodix
- 11.2.15.1. Overview
- 11.2.15.2. Products
- 11.2.15.3. SWOT Analysis
- 11.2.15.4. Recent Developments
- 11.2.15.5. Financials (Based on Availability)
- 11.2.1 NXP Semiconductors
List of Figures
- Figure 1: Global Mobile Terminal SE Chips Revenue Breakdown (million, %) by Region 2024 & 2032
- Figure 2: Global Mobile Terminal SE Chips Volume Breakdown (K, %) by Region 2024 & 2032
- Figure 3: North America Mobile Terminal SE Chips Revenue (million), by Application 2024 & 2032
- Figure 4: North America Mobile Terminal SE Chips Volume (K), by Application 2024 & 2032
- Figure 5: North America Mobile Terminal SE Chips Revenue Share (%), by Application 2024 & 2032
- Figure 6: North America Mobile Terminal SE Chips Volume Share (%), by Application 2024 & 2032
- Figure 7: North America Mobile Terminal SE Chips Revenue (million), by Types 2024 & 2032
- Figure 8: North America Mobile Terminal SE Chips Volume (K), by Types 2024 & 2032
- Figure 9: North America Mobile Terminal SE Chips Revenue Share (%), by Types 2024 & 2032
- Figure 10: North America Mobile Terminal SE Chips Volume Share (%), by Types 2024 & 2032
- Figure 11: North America Mobile Terminal SE Chips Revenue (million), by Country 2024 & 2032
- Figure 12: North America Mobile Terminal SE Chips Volume (K), by Country 2024 & 2032
- Figure 13: North America Mobile Terminal SE Chips Revenue Share (%), by Country 2024 & 2032
- Figure 14: North America Mobile Terminal SE Chips Volume Share (%), by Country 2024 & 2032
- Figure 15: South America Mobile Terminal SE Chips Revenue (million), by Application 2024 & 2032
- Figure 16: South America Mobile Terminal SE Chips Volume (K), by Application 2024 & 2032
- Figure 17: South America Mobile Terminal SE Chips Revenue Share (%), by Application 2024 & 2032
- Figure 18: South America Mobile Terminal SE Chips Volume Share (%), by Application 2024 & 2032
- Figure 19: South America Mobile Terminal SE Chips Revenue (million), by Types 2024 & 2032
- Figure 20: South America Mobile Terminal SE Chips Volume (K), by Types 2024 & 2032
- Figure 21: South America Mobile Terminal SE Chips Revenue Share (%), by Types 2024 & 2032
- Figure 22: South America Mobile Terminal SE Chips Volume Share (%), by Types 2024 & 2032
- Figure 23: South America Mobile Terminal SE Chips Revenue (million), by Country 2024 & 2032
- Figure 24: South America Mobile Terminal SE Chips Volume (K), by Country 2024 & 2032
- Figure 25: South America Mobile Terminal SE Chips Revenue Share (%), by Country 2024 & 2032
- Figure 26: South America Mobile Terminal SE Chips Volume Share (%), by Country 2024 & 2032
- Figure 27: Europe Mobile Terminal SE Chips Revenue (million), by Application 2024 & 2032
- Figure 28: Europe Mobile Terminal SE Chips Volume (K), by Application 2024 & 2032
- Figure 29: Europe Mobile Terminal SE Chips Revenue Share (%), by Application 2024 & 2032
- Figure 30: Europe Mobile Terminal SE Chips Volume Share (%), by Application 2024 & 2032
- Figure 31: Europe Mobile Terminal SE Chips Revenue (million), by Types 2024 & 2032
- Figure 32: Europe Mobile Terminal SE Chips Volume (K), by Types 2024 & 2032
- Figure 33: Europe Mobile Terminal SE Chips Revenue Share (%), by Types 2024 & 2032
- Figure 34: Europe Mobile Terminal SE Chips Volume Share (%), by Types 2024 & 2032
- Figure 35: Europe Mobile Terminal SE Chips Revenue (million), by Country 2024 & 2032
- Figure 36: Europe Mobile Terminal SE Chips Volume (K), by Country 2024 & 2032
- Figure 37: Europe Mobile Terminal SE Chips Revenue Share (%), by Country 2024 & 2032
- Figure 38: Europe Mobile Terminal SE Chips Volume Share (%), by Country 2024 & 2032
- Figure 39: Middle East & Africa Mobile Terminal SE Chips Revenue (million), by Application 2024 & 2032
- Figure 40: Middle East & Africa Mobile Terminal SE Chips Volume (K), by Application 2024 & 2032
- Figure 41: Middle East & Africa Mobile Terminal SE Chips Revenue Share (%), by Application 2024 & 2032
- Figure 42: Middle East & Africa Mobile Terminal SE Chips Volume Share (%), by Application 2024 & 2032
- Figure 43: Middle East & Africa Mobile Terminal SE Chips Revenue (million), by Types 2024 & 2032
- Figure 44: Middle East & Africa Mobile Terminal SE Chips Volume (K), by Types 2024 & 2032
- Figure 45: Middle East & Africa Mobile Terminal SE Chips Revenue Share (%), by Types 2024 & 2032
- Figure 46: Middle East & Africa Mobile Terminal SE Chips Volume Share (%), by Types 2024 & 2032
- Figure 47: Middle East & Africa Mobile Terminal SE Chips Revenue (million), by Country 2024 & 2032
- Figure 48: Middle East & Africa Mobile Terminal SE Chips Volume (K), by Country 2024 & 2032
- Figure 49: Middle East & Africa Mobile Terminal SE Chips Revenue Share (%), by Country 2024 & 2032
- Figure 50: Middle East & Africa Mobile Terminal SE Chips Volume Share (%), by Country 2024 & 2032
- Figure 51: Asia Pacific Mobile Terminal SE Chips Revenue (million), by Application 2024 & 2032
- Figure 52: Asia Pacific Mobile Terminal SE Chips Volume (K), by Application 2024 & 2032
- Figure 53: Asia Pacific Mobile Terminal SE Chips Revenue Share (%), by Application 2024 & 2032
- Figure 54: Asia Pacific Mobile Terminal SE Chips Volume Share (%), by Application 2024 & 2032
- Figure 55: Asia Pacific Mobile Terminal SE Chips Revenue (million), by Types 2024 & 2032
- Figure 56: Asia Pacific Mobile Terminal SE Chips Volume (K), by Types 2024 & 2032
- Figure 57: Asia Pacific Mobile Terminal SE Chips Revenue Share (%), by Types 2024 & 2032
- Figure 58: Asia Pacific Mobile Terminal SE Chips Volume Share (%), by Types 2024 & 2032
- Figure 59: Asia Pacific Mobile Terminal SE Chips Revenue (million), by Country 2024 & 2032
- Figure 60: Asia Pacific Mobile Terminal SE Chips Volume (K), by Country 2024 & 2032
- Figure 61: Asia Pacific Mobile Terminal SE Chips Revenue Share (%), by Country 2024 & 2032
- Figure 62: Asia Pacific Mobile Terminal SE Chips Volume Share (%), by Country 2024 & 2032
List of Tables
- Table 1: Global Mobile Terminal SE Chips Revenue million Forecast, by Region 2019 & 2032
- Table 2: Global Mobile Terminal SE Chips Volume K Forecast, by Region 2019 & 2032
- Table 3: Global Mobile Terminal SE Chips Revenue million Forecast, by Application 2019 & 2032
- Table 4: Global Mobile Terminal SE Chips Volume K Forecast, by Application 2019 & 2032
- Table 5: Global Mobile Terminal SE Chips Revenue million Forecast, by Types 2019 & 2032
- Table 6: Global Mobile Terminal SE Chips Volume K Forecast, by Types 2019 & 2032
- Table 7: Global Mobile Terminal SE Chips Revenue million Forecast, by Region 2019 & 2032
- Table 8: Global Mobile Terminal SE Chips Volume K Forecast, by Region 2019 & 2032
- Table 9: Global Mobile Terminal SE Chips Revenue million Forecast, by Application 2019 & 2032
- Table 10: Global Mobile Terminal SE Chips Volume K Forecast, by Application 2019 & 2032
- Table 11: Global Mobile Terminal SE Chips Revenue million Forecast, by Types 2019 & 2032
- Table 12: Global Mobile Terminal SE Chips Volume K Forecast, by Types 2019 & 2032
- Table 13: Global Mobile Terminal SE Chips Revenue million Forecast, by Country 2019 & 2032
- Table 14: Global Mobile Terminal SE Chips Volume K Forecast, by Country 2019 & 2032
- Table 15: United States Mobile Terminal SE Chips Revenue (million) Forecast, by Application 2019 & 2032
- Table 16: United States Mobile Terminal SE Chips Volume (K) Forecast, by Application 2019 & 2032
- Table 17: Canada Mobile Terminal SE Chips Revenue (million) Forecast, by Application 2019 & 2032
- Table 18: Canada Mobile Terminal SE Chips Volume (K) Forecast, by Application 2019 & 2032
- Table 19: Mexico Mobile Terminal SE Chips Revenue (million) Forecast, by Application 2019 & 2032
- Table 20: Mexico Mobile Terminal SE Chips Volume (K) Forecast, by Application 2019 & 2032
- Table 21: Global Mobile Terminal SE Chips Revenue million Forecast, by Application 2019 & 2032
- Table 22: Global Mobile Terminal SE Chips Volume K Forecast, by Application 2019 & 2032
- Table 23: Global Mobile Terminal SE Chips Revenue million Forecast, by Types 2019 & 2032
- Table 24: Global Mobile Terminal SE Chips Volume K Forecast, by Types 2019 & 2032
- Table 25: Global Mobile Terminal SE Chips Revenue million Forecast, by Country 2019 & 2032
- Table 26: Global Mobile Terminal SE Chips Volume K Forecast, by Country 2019 & 2032
- Table 27: Brazil Mobile Terminal SE Chips Revenue (million) Forecast, by Application 2019 & 2032
- Table 28: Brazil Mobile Terminal SE Chips Volume (K) Forecast, by Application 2019 & 2032
- Table 29: Argentina Mobile Terminal SE Chips Revenue (million) Forecast, by Application 2019 & 2032
- Table 30: Argentina Mobile Terminal SE Chips Volume (K) Forecast, by Application 2019 & 2032
- Table 31: Rest of South America Mobile Terminal SE Chips Revenue (million) Forecast, by Application 2019 & 2032
- Table 32: Rest of South America Mobile Terminal SE Chips Volume (K) Forecast, by Application 2019 & 2032
- Table 33: Global Mobile Terminal SE Chips Revenue million Forecast, by Application 2019 & 2032
- Table 34: Global Mobile Terminal SE Chips Volume K Forecast, by Application 2019 & 2032
- Table 35: Global Mobile Terminal SE Chips Revenue million Forecast, by Types 2019 & 2032
- Table 36: Global Mobile Terminal SE Chips Volume K Forecast, by Types 2019 & 2032
- Table 37: Global Mobile Terminal SE Chips Revenue million Forecast, by Country 2019 & 2032
- Table 38: Global Mobile Terminal SE Chips Volume K Forecast, by Country 2019 & 2032
- Table 39: United Kingdom Mobile Terminal SE Chips Revenue (million) Forecast, by Application 2019 & 2032
- Table 40: United Kingdom Mobile Terminal SE Chips Volume (K) Forecast, by Application 2019 & 2032
- Table 41: Germany Mobile Terminal SE Chips Revenue (million) Forecast, by Application 2019 & 2032
- Table 42: Germany Mobile Terminal SE Chips Volume (K) Forecast, by Application 2019 & 2032
- Table 43: France Mobile Terminal SE Chips Revenue (million) Forecast, by Application 2019 & 2032
- Table 44: France Mobile Terminal SE Chips Volume (K) Forecast, by Application 2019 & 2032
- Table 45: Italy Mobile Terminal SE Chips Revenue (million) Forecast, by Application 2019 & 2032
- Table 46: Italy Mobile Terminal SE Chips Volume (K) Forecast, by Application 2019 & 2032
- Table 47: Spain Mobile Terminal SE Chips Revenue (million) Forecast, by Application 2019 & 2032
- Table 48: Spain Mobile Terminal SE Chips Volume (K) Forecast, by Application 2019 & 2032
- Table 49: Russia Mobile Terminal SE Chips Revenue (million) Forecast, by Application 2019 & 2032
- Table 50: Russia Mobile Terminal SE Chips Volume (K) Forecast, by Application 2019 & 2032
- Table 51: Benelux Mobile Terminal SE Chips Revenue (million) Forecast, by Application 2019 & 2032
- Table 52: Benelux Mobile Terminal SE Chips Volume (K) Forecast, by Application 2019 & 2032
- Table 53: Nordics Mobile Terminal SE Chips Revenue (million) Forecast, by Application 2019 & 2032
- Table 54: Nordics Mobile Terminal SE Chips Volume (K) Forecast, by Application 2019 & 2032
- Table 55: Rest of Europe Mobile Terminal SE Chips Revenue (million) Forecast, by Application 2019 & 2032
- Table 56: Rest of Europe Mobile Terminal SE Chips Volume (K) Forecast, by Application 2019 & 2032
- Table 57: Global Mobile Terminal SE Chips Revenue million Forecast, by Application 2019 & 2032
- Table 58: Global Mobile Terminal SE Chips Volume K Forecast, by Application 2019 & 2032
- Table 59: Global Mobile Terminal SE Chips Revenue million Forecast, by Types 2019 & 2032
- Table 60: Global Mobile Terminal SE Chips Volume K Forecast, by Types 2019 & 2032
- Table 61: Global Mobile Terminal SE Chips Revenue million Forecast, by Country 2019 & 2032
- Table 62: Global Mobile Terminal SE Chips Volume K Forecast, by Country 2019 & 2032
- Table 63: Turkey Mobile Terminal SE Chips Revenue (million) Forecast, by Application 2019 & 2032
- Table 64: Turkey Mobile Terminal SE Chips Volume (K) Forecast, by Application 2019 & 2032
- Table 65: Israel Mobile Terminal SE Chips Revenue (million) Forecast, by Application 2019 & 2032
- Table 66: Israel Mobile Terminal SE Chips Volume (K) Forecast, by Application 2019 & 2032
- Table 67: GCC Mobile Terminal SE Chips Revenue (million) Forecast, by Application 2019 & 2032
- Table 68: GCC Mobile Terminal SE Chips Volume (K) Forecast, by Application 2019 & 2032
- Table 69: North Africa Mobile Terminal SE Chips Revenue (million) Forecast, by Application 2019 & 2032
- Table 70: North Africa Mobile Terminal SE Chips Volume (K) Forecast, by Application 2019 & 2032
- Table 71: South Africa Mobile Terminal SE Chips Revenue (million) Forecast, by Application 2019 & 2032
- Table 72: South Africa Mobile Terminal SE Chips Volume (K) Forecast, by Application 2019 & 2032
- Table 73: Rest of Middle East & Africa Mobile Terminal SE Chips Revenue (million) Forecast, by Application 2019 & 2032
- Table 74: Rest of Middle East & Africa Mobile Terminal SE Chips Volume (K) Forecast, by Application 2019 & 2032
- Table 75: Global Mobile Terminal SE Chips Revenue million Forecast, by Application 2019 & 2032
- Table 76: Global Mobile Terminal SE Chips Volume K Forecast, by Application 2019 & 2032
- Table 77: Global Mobile Terminal SE Chips Revenue million Forecast, by Types 2019 & 2032
- Table 78: Global Mobile Terminal SE Chips Volume K Forecast, by Types 2019 & 2032
- Table 79: Global Mobile Terminal SE Chips Revenue million Forecast, by Country 2019 & 2032
- Table 80: Global Mobile Terminal SE Chips Volume K Forecast, by Country 2019 & 2032
- Table 81: China Mobile Terminal SE Chips Revenue (million) Forecast, by Application 2019 & 2032
- Table 82: China Mobile Terminal SE Chips Volume (K) Forecast, by Application 2019 & 2032
- Table 83: India Mobile Terminal SE Chips Revenue (million) Forecast, by Application 2019 & 2032
- Table 84: India Mobile Terminal SE Chips Volume (K) Forecast, by Application 2019 & 2032
- Table 85: Japan Mobile Terminal SE Chips Revenue (million) Forecast, by Application 2019 & 2032
- Table 86: Japan Mobile Terminal SE Chips Volume (K) Forecast, by Application 2019 & 2032
- Table 87: South Korea Mobile Terminal SE Chips Revenue (million) Forecast, by Application 2019 & 2032
- Table 88: South Korea Mobile Terminal SE Chips Volume (K) Forecast, by Application 2019 & 2032
- Table 89: ASEAN Mobile Terminal SE Chips Revenue (million) Forecast, by Application 2019 & 2032
- Table 90: ASEAN Mobile Terminal SE Chips Volume (K) Forecast, by Application 2019 & 2032
- Table 91: Oceania Mobile Terminal SE Chips Revenue (million) Forecast, by Application 2019 & 2032
- Table 92: Oceania Mobile Terminal SE Chips Volume (K) Forecast, by Application 2019 & 2032
- Table 93: Rest of Asia Pacific Mobile Terminal SE Chips Revenue (million) Forecast, by Application 2019 & 2032
- Table 94: Rest of Asia Pacific Mobile Terminal SE Chips Volume (K) Forecast, by Application 2019 & 2032
Frequently Asked Questions
1. What is the projected Compound Annual Growth Rate (CAGR) of the Mobile Terminal SE Chips?
The projected CAGR is approximately XX%.
2. Which companies are prominent players in the Mobile Terminal SE Chips?
Key companies in the market include NXP Semiconductors, Intel, Infineon, Samsung, Huawei, Unigroup Guoxin, Nations Technologies, CEC Huada Electronic, Wuhan Ruinajie Semiconductor, Horizon Robotics, Datang Telecom Technology, Sinosun Technology, Beijing Hongsi Electronic Technology, C Core Technology, Shenzhen Goodix.
3. What are the main segments of the Mobile Terminal SE Chips?
The market segments include Application, Types.
4. Can you provide details about the market size?
The market size is estimated to be USD XXX million as of 2022.
5. What are some drivers contributing to market growth?
N/A
6. What are the notable trends driving market growth?
N/A
7. Are there any restraints impacting market growth?
N/A
8. Can you provide examples of recent developments in the market?
N/A
9. What pricing options are available for accessing the report?
Pricing options include single-user, multi-user, and enterprise licenses priced at USD 3950.00, USD 5925.00, and USD 7900.00 respectively.
10. Is the market size provided in terms of value or volume?
The market size is provided in terms of value, measured in million and volume, measured in K.
11. Are there any specific market keywords associated with the report?
Yes, the market keyword associated with the report is "Mobile Terminal SE Chips," which aids in identifying and referencing the specific market segment covered.
12. How do I determine which pricing option suits my needs best?
The pricing options vary based on user requirements and access needs. Individual users may opt for single-user licenses, while businesses requiring broader access may choose multi-user or enterprise licenses for cost-effective access to the report.
13. Are there any additional resources or data provided in the Mobile Terminal SE Chips report?
While the report offers comprehensive insights, it's advisable to review the specific contents or supplementary materials provided to ascertain if additional resources or data are available.
14. How can I stay updated on further developments or reports in the Mobile Terminal SE Chips?
To stay informed about further developments, trends, and reports in the Mobile Terminal SE Chips, consider subscribing to industry newsletters, following relevant companies and organizations, or regularly checking reputable industry news sources and publications.
Methodology
Step 1 - Identification of Relevant Samples Size from Population Database


Step 2 - Approaches for Defining Global Market Size (Value, Volume* & Price*)

Note*: In applicable scenarios
Step 3 - Data Sources
Primary Research
- Web Analytics
- Survey Reports
- Research Institute
- Latest Research Reports
- Opinion Leaders
Secondary Research
- Annual Reports
- White Paper
- Latest Press Release
- Industry Association
- Paid Database
- Investor Presentations

Step 4 - Data Triangulation
Involves using different sources of information in order to increase the validity of a study
These sources are likely to be stakeholders in a program - participants, other researchers, program staff, other community members, and so on.
Then we put all data in single framework & apply various statistical tools to find out the dynamic on the market.
During the analysis stage, feedback from the stakeholder groups would be compared to determine areas of agreement as well as areas of divergence


