
Key Insights
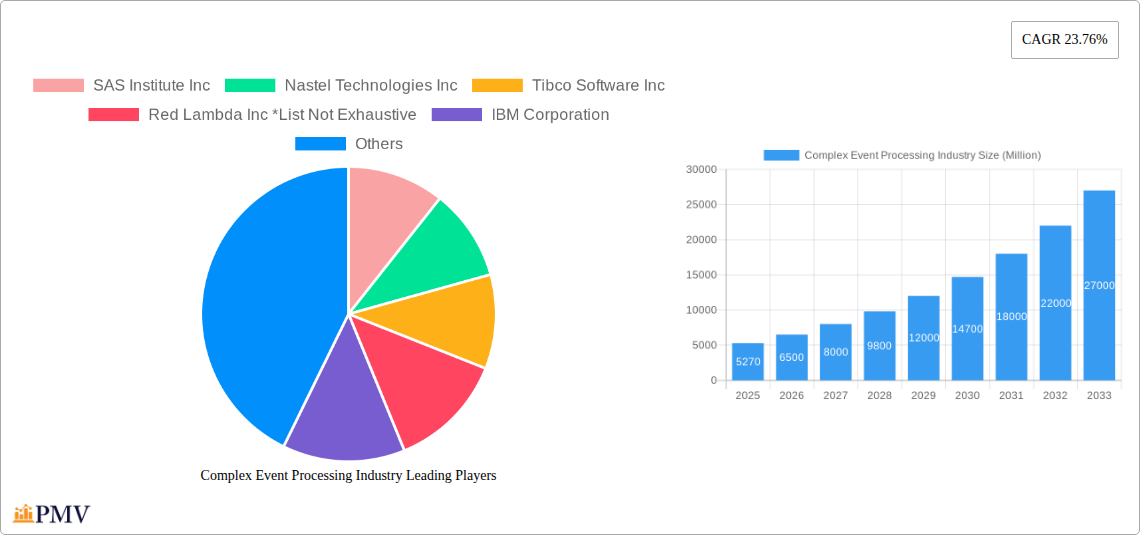
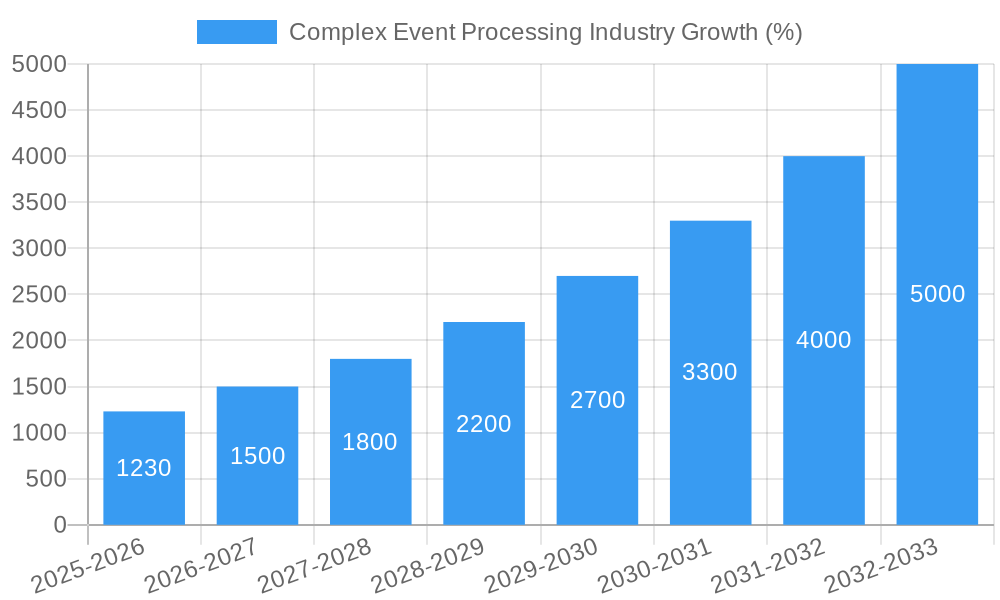
The Complex Event Processing (CEP) market is experiencing robust growth, projected to reach \$5.27 billion in 2025 and exhibiting a Compound Annual Growth Rate (CAGR) of 23.76% from 2025 to 2033. This expansion is driven by several key factors. The increasing volume and velocity of data generated by various sources, including IoT devices, necessitate real-time analytics capabilities that CEP solutions uniquely provide. Furthermore, the rising adoption of cloud-based CEP platforms offers scalability and cost-effectiveness, attracting businesses of all sizes. The BFSI (Banking, Financial Services, and Insurance) sector is a major adopter, leveraging CEP for fraud detection, risk management, and personalized customer experiences. Other significant end-user verticals driving growth include managed mobility services, government and defense (for real-time threat detection and security), healthcare (for patient monitoring and predictive analytics), and retail (for inventory management and personalized offers). The market is segmented by enterprise type (small and medium enterprises, large enterprises), end-user vertical, and type (software and services). Competitive landscape includes established players like IBM, SAP, Oracle, and Cisco, alongside specialized CEP vendors such as SAS, Tibco, and Informatica. The continued digital transformation across industries, coupled with advancements in artificial intelligence and machine learning integrated within CEP platforms, will further accelerate market growth in the coming years.
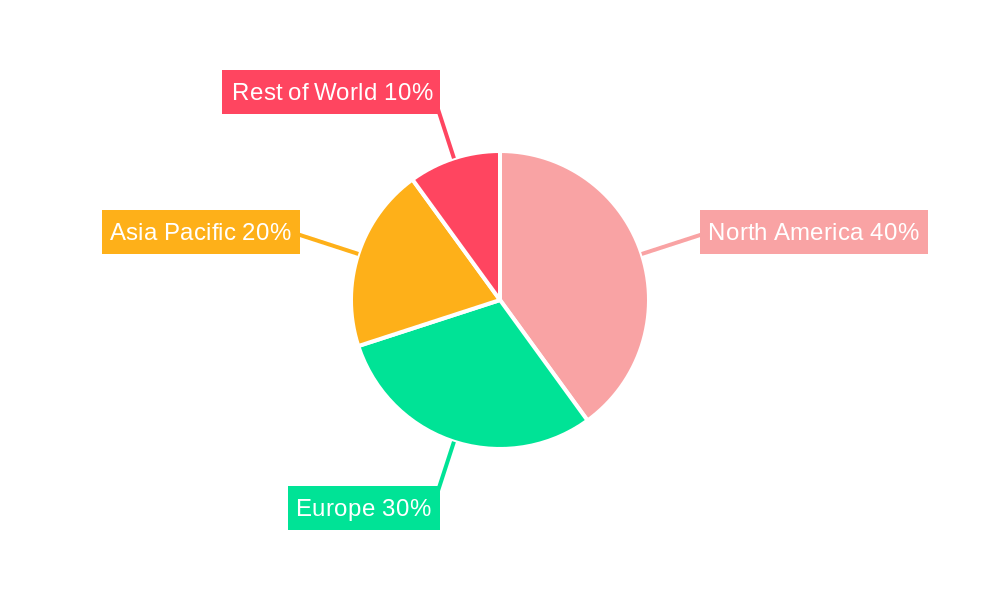
The geographical distribution of the CEP market reflects a strong presence in North America, driven by early adoption and technological advancements. However, the Asia-Pacific region is expected to witness significant growth due to rapid digitalization, expanding internet penetration, and increasing investments in advanced technologies. Europe also holds substantial market share, particularly in sectors like BFSI and manufacturing. While the software segment currently dominates, the services segment is also experiencing growth, fueled by the demand for implementation, integration, and support services related to CEP solutions. Continued innovation in areas like edge computing and real-time data streaming will shape the future trajectory of the CEP market, creating new opportunities for both established players and emerging vendors.
Complex Event Processing Industry Market Report: 2019-2033
This comprehensive report provides an in-depth analysis of the Complex Event Processing (CEP) industry, offering valuable insights for businesses, investors, and stakeholders. The study covers the period 2019-2033, with a focus on the forecast period 2025-2033 and a base year of 2025. The global CEP market is projected to reach xx Million by 2033, exhibiting a robust Compound Annual Growth Rate (CAGR) of xx%.
Complex Event Processing Industry Market Structure & Competitive Dynamics
The Complex Event Processing (CEP) market is characterized by a moderate level of concentration, with several major players holding significant market share. However, the presence of numerous smaller, specialized firms fosters a dynamic competitive landscape. The market structure is influenced by ongoing mergers and acquisitions (M&A) activity, with deal values exceeding xx Million in recent years. Key M&A activities have involved strategic acquisitions to expand product portfolios and geographical reach.
Innovation ecosystems play a crucial role, with both established players and startups contributing to technological advancements in real-time data analytics and event stream processing. Regulatory frameworks, particularly those related to data privacy and security, significantly impact market dynamics. Product substitutes, such as traditional data warehousing and business intelligence solutions, pose a competitive challenge. End-user trends, such as the increasing adoption of cloud-based solutions and the growing demand for real-time insights across various industries, shape market growth.
Market Share (2024 Estimates):
- SAS Institute Inc: xx%
- Nastel Technologies Inc: xx%
- Tibco Software Inc: xx%
- IBM Corporation: xx%
- Oracle Corporation: xx%
- Other players: xx%
Recent M&A Activity (2019-2024): A total of xx M&A deals valued at approximately xx Million have been recorded. These deals predominantly involved acquisitions of smaller CEP specialists by larger technology firms.
Complex Event Processing Industry Industry Trends & Insights
The CEP market is experiencing significant growth driven by several key factors. The increasing volume and velocity of data generated by connected devices and digital platforms fuel the demand for real-time insights. Technological advancements, such as the rise of artificial intelligence (AI) and machine learning (ML) integrated into CEP platforms, are enhancing the capabilities of these systems, enabling more sophisticated analytics and predictive capabilities. Furthermore, cloud computing's adoption is driving market expansion, providing scalability, cost-effectiveness, and accessibility to CEP solutions. Consumer preferences are shifting towards faster, more accurate, and actionable intelligence, pushing the demand for sophisticated CEP solutions. Competitive dynamics remain intense, with established players and new entrants constantly innovating to gain market share.
The market is witnessing a high level of market penetration among large enterprises, driven by their need for advanced analytics and real-time decision-making capabilities. However, the adoption rate among small and medium-sized enterprises (SMEs) is also increasing, albeit at a slower pace, owing to cost and complexity considerations. The global CEP market is estimated to grow at a CAGR of xx% during the forecast period (2025-2033), with significant growth potential in various vertical sectors.
Dominant Markets & Segments in Complex Event Processing Industry
The North American region currently holds the largest market share in the CEP industry, driven by the high adoption rate of advanced technologies and the presence of several key technology companies. However, the Asia-Pacific region is expected to exhibit the fastest growth during the forecast period, owing to rapid digitalization and increasing investment in IT infrastructure.
By Enterprise Type:
- Large Enterprises: Dominated by high adoption rates and budget for advanced analytics.
- Small and Medium Enterprises (SMEs): Showing increasing adoption, although at a slower pace.
By End-user Vertical:
- BFSI (Banking, Financial Services, and Insurance): High demand driven by fraud detection, risk management, and real-time trading.
- Telecom and IT Industry: Extensive use for network management, customer service optimization, and cybersecurity.
- Government and Defense: Growing adoption for situational awareness, security operations, and intelligence analysis.
- Other Verticals: Showing increasing adoption across various sectors like retail, healthcare, manufacturing, and media.
Key Drivers:
- Government initiatives and supportive economic policies in certain regions accelerate adoption.
- Robust IT infrastructure and increasing internet penetration are essential for growth.
- High demand for real-time analytics across diverse sectors is driving market expansion.
By Type:
- Software: Holds the largest market share due to its wide applications and diverse functionalities.
- Services: Growing steadily, providing crucial support for the implementation and maintenance of CEP solutions.
Complex Event Processing Industry Product Innovations
Recent product innovations in the CEP space focus on enhancing scalability, integrating advanced analytics capabilities (AI/ML), and improving user experience through intuitive interfaces. The market is witnessing a shift towards cloud-based CEP solutions offering greater flexibility and cost-effectiveness. These innovations cater to the growing demand for real-time insights and automation across various industries, ensuring a competitive market landscape.
Report Segmentation & Scope
This report provides a detailed segmentation of the Complex Event Processing industry:
By Enterprise Type: The report analyzes the market size and growth projections for both large enterprises and SMEs. Competitive dynamics are assessed for each segment.
By End-user Vertical: The report covers BFSI, Managed Mobility, Government and Defense, Retail, Healthcare, Telecom and IT Industry, Media and Entertainment, Manufacturing, and Other End-user Verticals, analyzing the specific needs and adoption patterns within each sector. Each segment's market size and future growth potential are included.
By Type: The report assesses the market size and growth prospects of both the Software and Services segments, highlighting the competitive dynamics and key players in each area.
Key Drivers of Complex Event Processing Industry Growth
Several factors drive the growth of the Complex Event Processing industry: The explosion of data from IoT devices and digital platforms creates a strong need for real-time insights. Technological advancements, such as AI and ML integration, enhance CEP capabilities, providing superior analytics and prediction. Cloud computing facilitates scalability, cost-effectiveness, and access to CEP solutions. Government regulations supporting data analytics and cybersecurity also contribute to industry growth.
Challenges in the Complex Event Processing Industry Sector
Challenges in the CEP industry include the complexity of implementing and integrating CEP solutions, the need for skilled professionals, the high cost of implementation, and the need for robust data security and privacy measures. Competition from alternative technologies and the evolving regulatory landscape also pose challenges. The impact of these challenges is reflected in slower adoption among SMEs and increased implementation costs.
Leading Players in the Complex Event Processing Industry Market
- SAS Institute Inc
- Nastel Technologies Inc
- Tibco Software Inc
- Red Lambda Inc
- IBM Corporation
- Software AG
- Cisco Systems Inc
- Espertech Inc
- Oracle Corporation
- Informatica Corporation
- SAP SE
Key Developments in Complex Event Processing Industry Sector
June 2023: Cisco announced its reimagining of human interaction with AI, leveraging language models to enhance collaboration and security across its portfolio. This development signals a major shift towards AI-powered CEP solutions.
January 2023: Oracle introduced new logistics capabilities in Oracle Fusion Cloud Supply Chain Management (SCM), enhancing accuracy, automation, and flexibility. This reflects the increasing integration of CEP into enterprise resource planning (ERP) systems.
Strategic Complex Event Processing Industry Market Outlook
The Complex Event Processing industry presents significant growth potential due to the ongoing expansion of data volumes, the increasing adoption of cloud computing, and the rising demand for real-time insights across diverse sectors. Strategic opportunities lie in developing innovative solutions that leverage AI/ML, enhancing user experience, and addressing the needs of SMEs. The market is poised for continued expansion, with substantial growth projected in the coming years.
Complex Event Processing Industry Segmentation
-
1. Type
- 1.1. Software
- 1.2. Services
-
2. Enterprise Type
- 2.1. Small and Medium Enterprise
- 2.2. Large Enterprise
-
3. End-user Vertical
- 3.1. BFSI
- 3.2. Managed Mobility
- 3.3. Government and Defense
- 3.4. Retail
- 3.5. Healthcare
- 3.6. Telecom and IT Industry
- 3.7. Media and Entertainment
- 3.8. Manufacturing
- 3.9. Other End-user Verticals
Complex Event Processing Industry Segmentation By Geography
- 1. North America
- 2. Europe
- 3. Asia
- 4. Australia and New Zealand
- 5. Latin America
- 6. Middle East and Africa
Complex Event Processing Industry REPORT HIGHLIGHTS
| Aspects | Details |
|---|---|
| Study Period | 2019-2033 |
| Base Year | 2024 |
| Estimated Year | 2025 |
| Forecast Period | 2025-2033 |
| Historical Period | 2019-2024 |
| Growth Rate | CAGR of 23.76% from 2019-2033 |
| Segmentation |
|
Table of Contents
- 1. Introduction
- 1.1. Research Scope
- 1.2. Market Segmentation
- 1.3. Research Methodology
- 1.4. Definitions and Assumptions
- 2. Executive Summary
- 2.1. Introduction
- 3. Market Dynamics
- 3.1. Introduction
- 3.2. Market Drivers
- 3.2.1. Development in the Field of Machine Learning and Data Analytics; Growing Need for Real-time Analytics
- 3.3. Market Restrains
- 3.3.1. Lack of Consistency in Results
- 3.4. Market Trends
- 3.4.1. BFSI End-user Segment to Grow Significantly
- 4. Market Factor Analysis
- 4.1. Porters Five Forces
- 4.2. Supply/Value Chain
- 4.3. PESTEL analysis
- 4.4. Market Entropy
- 4.5. Patent/Trademark Analysis
- 5. Global Complex Event Processing Industry Analysis, Insights and Forecast, 2019-2031
- 5.1. Market Analysis, Insights and Forecast - by Type
- 5.1.1. Software
- 5.1.2. Services
- 5.2. Market Analysis, Insights and Forecast - by Enterprise Type
- 5.2.1. Small and Medium Enterprise
- 5.2.2. Large Enterprise
- 5.3. Market Analysis, Insights and Forecast - by End-user Vertical
- 5.3.1. BFSI
- 5.3.2. Managed Mobility
- 5.3.3. Government and Defense
- 5.3.4. Retail
- 5.3.5. Healthcare
- 5.3.6. Telecom and IT Industry
- 5.3.7. Media and Entertainment
- 5.3.8. Manufacturing
- 5.3.9. Other End-user Verticals
- 5.4. Market Analysis, Insights and Forecast - by Region
- 5.4.1. North America
- 5.4.2. Europe
- 5.4.3. Asia
- 5.4.4. Australia and New Zealand
- 5.4.5. Latin America
- 5.4.6. Middle East and Africa
- 5.1. Market Analysis, Insights and Forecast - by Type
- 6. North America Complex Event Processing Industry Analysis, Insights and Forecast, 2019-2031
- 6.1. Market Analysis, Insights and Forecast - by Type
- 6.1.1. Software
- 6.1.2. Services
- 6.2. Market Analysis, Insights and Forecast - by Enterprise Type
- 6.2.1. Small and Medium Enterprise
- 6.2.2. Large Enterprise
- 6.3. Market Analysis, Insights and Forecast - by End-user Vertical
- 6.3.1. BFSI
- 6.3.2. Managed Mobility
- 6.3.3. Government and Defense
- 6.3.4. Retail
- 6.3.5. Healthcare
- 6.3.6. Telecom and IT Industry
- 6.3.7. Media and Entertainment
- 6.3.8. Manufacturing
- 6.3.9. Other End-user Verticals
- 6.1. Market Analysis, Insights and Forecast - by Type
- 7. Europe Complex Event Processing Industry Analysis, Insights and Forecast, 2019-2031
- 7.1. Market Analysis, Insights and Forecast - by Type
- 7.1.1. Software
- 7.1.2. Services
- 7.2. Market Analysis, Insights and Forecast - by Enterprise Type
- 7.2.1. Small and Medium Enterprise
- 7.2.2. Large Enterprise
- 7.3. Market Analysis, Insights and Forecast - by End-user Vertical
- 7.3.1. BFSI
- 7.3.2. Managed Mobility
- 7.3.3. Government and Defense
- 7.3.4. Retail
- 7.3.5. Healthcare
- 7.3.6. Telecom and IT Industry
- 7.3.7. Media and Entertainment
- 7.3.8. Manufacturing
- 7.3.9. Other End-user Verticals
- 7.1. Market Analysis, Insights and Forecast - by Type
- 8. Asia Complex Event Processing Industry Analysis, Insights and Forecast, 2019-2031
- 8.1. Market Analysis, Insights and Forecast - by Type
- 8.1.1. Software
- 8.1.2. Services
- 8.2. Market Analysis, Insights and Forecast - by Enterprise Type
- 8.2.1. Small and Medium Enterprise
- 8.2.2. Large Enterprise
- 8.3. Market Analysis, Insights and Forecast - by End-user Vertical
- 8.3.1. BFSI
- 8.3.2. Managed Mobility
- 8.3.3. Government and Defense
- 8.3.4. Retail
- 8.3.5. Healthcare
- 8.3.6. Telecom and IT Industry
- 8.3.7. Media and Entertainment
- 8.3.8. Manufacturing
- 8.3.9. Other End-user Verticals
- 8.1. Market Analysis, Insights and Forecast - by Type
- 9. Australia and New Zealand Complex Event Processing Industry Analysis, Insights and Forecast, 2019-2031
- 9.1. Market Analysis, Insights and Forecast - by Type
- 9.1.1. Software
- 9.1.2. Services
- 9.2. Market Analysis, Insights and Forecast - by Enterprise Type
- 9.2.1. Small and Medium Enterprise
- 9.2.2. Large Enterprise
- 9.3. Market Analysis, Insights and Forecast - by End-user Vertical
- 9.3.1. BFSI
- 9.3.2. Managed Mobility
- 9.3.3. Government and Defense
- 9.3.4. Retail
- 9.3.5. Healthcare
- 9.3.6. Telecom and IT Industry
- 9.3.7. Media and Entertainment
- 9.3.8. Manufacturing
- 9.3.9. Other End-user Verticals
- 9.1. Market Analysis, Insights and Forecast - by Type
- 10. Latin America Complex Event Processing Industry Analysis, Insights and Forecast, 2019-2031
- 10.1. Market Analysis, Insights and Forecast - by Type
- 10.1.1. Software
- 10.1.2. Services
- 10.2. Market Analysis, Insights and Forecast - by Enterprise Type
- 10.2.1. Small and Medium Enterprise
- 10.2.2. Large Enterprise
- 10.3. Market Analysis, Insights and Forecast - by End-user Vertical
- 10.3.1. BFSI
- 10.3.2. Managed Mobility
- 10.3.3. Government and Defense
- 10.3.4. Retail
- 10.3.5. Healthcare
- 10.3.6. Telecom and IT Industry
- 10.3.7. Media and Entertainment
- 10.3.8. Manufacturing
- 10.3.9. Other End-user Verticals
- 10.1. Market Analysis, Insights and Forecast - by Type
- 11. Middle East and Africa Complex Event Processing Industry Analysis, Insights and Forecast, 2019-2031
- 11.1. Market Analysis, Insights and Forecast - by Type
- 11.1.1. Software
- 11.1.2. Services
- 11.2. Market Analysis, Insights and Forecast - by Enterprise Type
- 11.2.1. Small and Medium Enterprise
- 11.2.2. Large Enterprise
- 11.3. Market Analysis, Insights and Forecast - by End-user Vertical
- 11.3.1. BFSI
- 11.3.2. Managed Mobility
- 11.3.3. Government and Defense
- 11.3.4. Retail
- 11.3.5. Healthcare
- 11.3.6. Telecom and IT Industry
- 11.3.7. Media and Entertainment
- 11.3.8. Manufacturing
- 11.3.9. Other End-user Verticals
- 11.1. Market Analysis, Insights and Forecast - by Type
- 12. North America Complex Event Processing Industry Analysis, Insights and Forecast, 2019-2031
- 12.1. Market Analysis, Insights and Forecast - By Country/Sub-region
- 12.1.1 United States
- 12.1.2 Canada
- 12.1.3 Mexico
- 13. Europe Complex Event Processing Industry Analysis, Insights and Forecast, 2019-2031
- 13.1. Market Analysis, Insights and Forecast - By Country/Sub-region
- 13.1.1 Germany
- 13.1.2 United Kingdom
- 13.1.3 France
- 13.1.4 Spain
- 13.1.5 Italy
- 13.1.6 Spain
- 13.1.7 Belgium
- 13.1.8 Netherland
- 13.1.9 Nordics
- 13.1.10 Rest of Europe
- 14. Asia Pacific Complex Event Processing Industry Analysis, Insights and Forecast, 2019-2031
- 14.1. Market Analysis, Insights and Forecast - By Country/Sub-region
- 14.1.1 China
- 14.1.2 Japan
- 14.1.3 India
- 14.1.4 South Korea
- 14.1.5 Southeast Asia
- 14.1.6 Australia
- 14.1.7 Indonesia
- 14.1.8 Phillipes
- 14.1.9 Singapore
- 14.1.10 Thailandc
- 14.1.11 Rest of Asia Pacific
- 15. South America Complex Event Processing Industry Analysis, Insights and Forecast, 2019-2031
- 15.1. Market Analysis, Insights and Forecast - By Country/Sub-region
- 15.1.1 Brazil
- 15.1.2 Argentina
- 15.1.3 Peru
- 15.1.4 Chile
- 15.1.5 Colombia
- 15.1.6 Ecuador
- 15.1.7 Venezuela
- 15.1.8 Rest of South America
- 16. North America Complex Event Processing Industry Analysis, Insights and Forecast, 2019-2031
- 16.1. Market Analysis, Insights and Forecast - By Country/Sub-region
- 16.1.1 United States
- 16.1.2 Canada
- 16.1.3 Mexico
- 17. MEA Complex Event Processing Industry Analysis, Insights and Forecast, 2019-2031
- 17.1. Market Analysis, Insights and Forecast - By Country/Sub-region
- 17.1.1 United Arab Emirates
- 17.1.2 Saudi Arabia
- 17.1.3 South Africa
- 17.1.4 Rest of Middle East and Africa
- 18. Competitive Analysis
- 18.1. Global Market Share Analysis 2024
- 18.2. Company Profiles
- 18.2.1 SAS Institute Inc
- 18.2.1.1. Overview
- 18.2.1.2. Products
- 18.2.1.3. SWOT Analysis
- 18.2.1.4. Recent Developments
- 18.2.1.5. Financials (Based on Availability)
- 18.2.2 Nastel Technologies Inc
- 18.2.2.1. Overview
- 18.2.2.2. Products
- 18.2.2.3. SWOT Analysis
- 18.2.2.4. Recent Developments
- 18.2.2.5. Financials (Based on Availability)
- 18.2.3 Tibco Software Inc
- 18.2.3.1. Overview
- 18.2.3.2. Products
- 18.2.3.3. SWOT Analysis
- 18.2.3.4. Recent Developments
- 18.2.3.5. Financials (Based on Availability)
- 18.2.4 Red Lambda Inc *List Not Exhaustive
- 18.2.4.1. Overview
- 18.2.4.2. Products
- 18.2.4.3. SWOT Analysis
- 18.2.4.4. Recent Developments
- 18.2.4.5. Financials (Based on Availability)
- 18.2.5 IBM Corporation
- 18.2.5.1. Overview
- 18.2.5.2. Products
- 18.2.5.3. SWOT Analysis
- 18.2.5.4. Recent Developments
- 18.2.5.5. Financials (Based on Availability)
- 18.2.6 Software AG
- 18.2.6.1. Overview
- 18.2.6.2. Products
- 18.2.6.3. SWOT Analysis
- 18.2.6.4. Recent Developments
- 18.2.6.5. Financials (Based on Availability)
- 18.2.7 Cisco Systems Inc
- 18.2.7.1. Overview
- 18.2.7.2. Products
- 18.2.7.3. SWOT Analysis
- 18.2.7.4. Recent Developments
- 18.2.7.5. Financials (Based on Availability)
- 18.2.8 Espertech Inc
- 18.2.8.1. Overview
- 18.2.8.2. Products
- 18.2.8.3. SWOT Analysis
- 18.2.8.4. Recent Developments
- 18.2.8.5. Financials (Based on Availability)
- 18.2.9 Oracle Corporation
- 18.2.9.1. Overview
- 18.2.9.2. Products
- 18.2.9.3. SWOT Analysis
- 18.2.9.4. Recent Developments
- 18.2.9.5. Financials (Based on Availability)
- 18.2.10 Informatica Corporation
- 18.2.10.1. Overview
- 18.2.10.2. Products
- 18.2.10.3. SWOT Analysis
- 18.2.10.4. Recent Developments
- 18.2.10.5. Financials (Based on Availability)
- 18.2.11 SAP SE
- 18.2.11.1. Overview
- 18.2.11.2. Products
- 18.2.11.3. SWOT Analysis
- 18.2.11.4. Recent Developments
- 18.2.11.5. Financials (Based on Availability)
- 18.2.1 SAS Institute Inc
List of Figures
- Figure 1: Global Complex Event Processing Industry Revenue Breakdown (Million, %) by Region 2024 & 2032
- Figure 2: North America Complex Event Processing Industry Revenue (Million), by Country 2024 & 2032
- Figure 3: North America Complex Event Processing Industry Revenue Share (%), by Country 2024 & 2032
- Figure 4: Europe Complex Event Processing Industry Revenue (Million), by Country 2024 & 2032
- Figure 5: Europe Complex Event Processing Industry Revenue Share (%), by Country 2024 & 2032
- Figure 6: Asia Pacific Complex Event Processing Industry Revenue (Million), by Country 2024 & 2032
- Figure 7: Asia Pacific Complex Event Processing Industry Revenue Share (%), by Country 2024 & 2032
- Figure 8: South America Complex Event Processing Industry Revenue (Million), by Country 2024 & 2032
- Figure 9: South America Complex Event Processing Industry Revenue Share (%), by Country 2024 & 2032
- Figure 10: North America Complex Event Processing Industry Revenue (Million), by Country 2024 & 2032
- Figure 11: North America Complex Event Processing Industry Revenue Share (%), by Country 2024 & 2032
- Figure 12: MEA Complex Event Processing Industry Revenue (Million), by Country 2024 & 2032
- Figure 13: MEA Complex Event Processing Industry Revenue Share (%), by Country 2024 & 2032
- Figure 14: North America Complex Event Processing Industry Revenue (Million), by Type 2024 & 2032
- Figure 15: North America Complex Event Processing Industry Revenue Share (%), by Type 2024 & 2032
- Figure 16: North America Complex Event Processing Industry Revenue (Million), by Enterprise Type 2024 & 2032
- Figure 17: North America Complex Event Processing Industry Revenue Share (%), by Enterprise Type 2024 & 2032
- Figure 18: North America Complex Event Processing Industry Revenue (Million), by End-user Vertical 2024 & 2032
- Figure 19: North America Complex Event Processing Industry Revenue Share (%), by End-user Vertical 2024 & 2032
- Figure 20: North America Complex Event Processing Industry Revenue (Million), by Country 2024 & 2032
- Figure 21: North America Complex Event Processing Industry Revenue Share (%), by Country 2024 & 2032
- Figure 22: Europe Complex Event Processing Industry Revenue (Million), by Type 2024 & 2032
- Figure 23: Europe Complex Event Processing Industry Revenue Share (%), by Type 2024 & 2032
- Figure 24: Europe Complex Event Processing Industry Revenue (Million), by Enterprise Type 2024 & 2032
- Figure 25: Europe Complex Event Processing Industry Revenue Share (%), by Enterprise Type 2024 & 2032
- Figure 26: Europe Complex Event Processing Industry Revenue (Million), by End-user Vertical 2024 & 2032
- Figure 27: Europe Complex Event Processing Industry Revenue Share (%), by End-user Vertical 2024 & 2032
- Figure 28: Europe Complex Event Processing Industry Revenue (Million), by Country 2024 & 2032
- Figure 29: Europe Complex Event Processing Industry Revenue Share (%), by Country 2024 & 2032
- Figure 30: Asia Complex Event Processing Industry Revenue (Million), by Type 2024 & 2032
- Figure 31: Asia Complex Event Processing Industry Revenue Share (%), by Type 2024 & 2032
- Figure 32: Asia Complex Event Processing Industry Revenue (Million), by Enterprise Type 2024 & 2032
- Figure 33: Asia Complex Event Processing Industry Revenue Share (%), by Enterprise Type 2024 & 2032
- Figure 34: Asia Complex Event Processing Industry Revenue (Million), by End-user Vertical 2024 & 2032
- Figure 35: Asia Complex Event Processing Industry Revenue Share (%), by End-user Vertical 2024 & 2032
- Figure 36: Asia Complex Event Processing Industry Revenue (Million), by Country 2024 & 2032
- Figure 37: Asia Complex Event Processing Industry Revenue Share (%), by Country 2024 & 2032
- Figure 38: Australia and New Zealand Complex Event Processing Industry Revenue (Million), by Type 2024 & 2032
- Figure 39: Australia and New Zealand Complex Event Processing Industry Revenue Share (%), by Type 2024 & 2032
- Figure 40: Australia and New Zealand Complex Event Processing Industry Revenue (Million), by Enterprise Type 2024 & 2032
- Figure 41: Australia and New Zealand Complex Event Processing Industry Revenue Share (%), by Enterprise Type 2024 & 2032
- Figure 42: Australia and New Zealand Complex Event Processing Industry Revenue (Million), by End-user Vertical 2024 & 2032
- Figure 43: Australia and New Zealand Complex Event Processing Industry Revenue Share (%), by End-user Vertical 2024 & 2032
- Figure 44: Australia and New Zealand Complex Event Processing Industry Revenue (Million), by Country 2024 & 2032
- Figure 45: Australia and New Zealand Complex Event Processing Industry Revenue Share (%), by Country 2024 & 2032
- Figure 46: Latin America Complex Event Processing Industry Revenue (Million), by Type 2024 & 2032
- Figure 47: Latin America Complex Event Processing Industry Revenue Share (%), by Type 2024 & 2032
- Figure 48: Latin America Complex Event Processing Industry Revenue (Million), by Enterprise Type 2024 & 2032
- Figure 49: Latin America Complex Event Processing Industry Revenue Share (%), by Enterprise Type 2024 & 2032
- Figure 50: Latin America Complex Event Processing Industry Revenue (Million), by End-user Vertical 2024 & 2032
- Figure 51: Latin America Complex Event Processing Industry Revenue Share (%), by End-user Vertical 2024 & 2032
- Figure 52: Latin America Complex Event Processing Industry Revenue (Million), by Country 2024 & 2032
- Figure 53: Latin America Complex Event Processing Industry Revenue Share (%), by Country 2024 & 2032
- Figure 54: Middle East and Africa Complex Event Processing Industry Revenue (Million), by Type 2024 & 2032
- Figure 55: Middle East and Africa Complex Event Processing Industry Revenue Share (%), by Type 2024 & 2032
- Figure 56: Middle East and Africa Complex Event Processing Industry Revenue (Million), by Enterprise Type 2024 & 2032
- Figure 57: Middle East and Africa Complex Event Processing Industry Revenue Share (%), by Enterprise Type 2024 & 2032
- Figure 58: Middle East and Africa Complex Event Processing Industry Revenue (Million), by End-user Vertical 2024 & 2032
- Figure 59: Middle East and Africa Complex Event Processing Industry Revenue Share (%), by End-user Vertical 2024 & 2032
- Figure 60: Middle East and Africa Complex Event Processing Industry Revenue (Million), by Country 2024 & 2032
- Figure 61: Middle East and Africa Complex Event Processing Industry Revenue Share (%), by Country 2024 & 2032
List of Tables
- Table 1: Global Complex Event Processing Industry Revenue Million Forecast, by Region 2019 & 2032
- Table 2: Global Complex Event Processing Industry Revenue Million Forecast, by Type 2019 & 2032
- Table 3: Global Complex Event Processing Industry Revenue Million Forecast, by Enterprise Type 2019 & 2032
- Table 4: Global Complex Event Processing Industry Revenue Million Forecast, by End-user Vertical 2019 & 2032
- Table 5: Global Complex Event Processing Industry Revenue Million Forecast, by Region 2019 & 2032
- Table 6: Global Complex Event Processing Industry Revenue Million Forecast, by Country 2019 & 2032
- Table 7: United States Complex Event Processing Industry Revenue (Million) Forecast, by Application 2019 & 2032
- Table 8: Canada Complex Event Processing Industry Revenue (Million) Forecast, by Application 2019 & 2032
- Table 9: Mexico Complex Event Processing Industry Revenue (Million) Forecast, by Application 2019 & 2032
- Table 10: Global Complex Event Processing Industry Revenue Million Forecast, by Country 2019 & 2032
- Table 11: Germany Complex Event Processing Industry Revenue (Million) Forecast, by Application 2019 & 2032
- Table 12: United Kingdom Complex Event Processing Industry Revenue (Million) Forecast, by Application 2019 & 2032
- Table 13: France Complex Event Processing Industry Revenue (Million) Forecast, by Application 2019 & 2032
- Table 14: Spain Complex Event Processing Industry Revenue (Million) Forecast, by Application 2019 & 2032
- Table 15: Italy Complex Event Processing Industry Revenue (Million) Forecast, by Application 2019 & 2032
- Table 16: Spain Complex Event Processing Industry Revenue (Million) Forecast, by Application 2019 & 2032
- Table 17: Belgium Complex Event Processing Industry Revenue (Million) Forecast, by Application 2019 & 2032
- Table 18: Netherland Complex Event Processing Industry Revenue (Million) Forecast, by Application 2019 & 2032
- Table 19: Nordics Complex Event Processing Industry Revenue (Million) Forecast, by Application 2019 & 2032
- Table 20: Rest of Europe Complex Event Processing Industry Revenue (Million) Forecast, by Application 2019 & 2032
- Table 21: Global Complex Event Processing Industry Revenue Million Forecast, by Country 2019 & 2032
- Table 22: China Complex Event Processing Industry Revenue (Million) Forecast, by Application 2019 & 2032
- Table 23: Japan Complex Event Processing Industry Revenue (Million) Forecast, by Application 2019 & 2032
- Table 24: India Complex Event Processing Industry Revenue (Million) Forecast, by Application 2019 & 2032
- Table 25: South Korea Complex Event Processing Industry Revenue (Million) Forecast, by Application 2019 & 2032
- Table 26: Southeast Asia Complex Event Processing Industry Revenue (Million) Forecast, by Application 2019 & 2032
- Table 27: Australia Complex Event Processing Industry Revenue (Million) Forecast, by Application 2019 & 2032
- Table 28: Indonesia Complex Event Processing Industry Revenue (Million) Forecast, by Application 2019 & 2032
- Table 29: Phillipes Complex Event Processing Industry Revenue (Million) Forecast, by Application 2019 & 2032
- Table 30: Singapore Complex Event Processing Industry Revenue (Million) Forecast, by Application 2019 & 2032
- Table 31: Thailandc Complex Event Processing Industry Revenue (Million) Forecast, by Application 2019 & 2032
- Table 32: Rest of Asia Pacific Complex Event Processing Industry Revenue (Million) Forecast, by Application 2019 & 2032
- Table 33: Global Complex Event Processing Industry Revenue Million Forecast, by Country 2019 & 2032
- Table 34: Brazil Complex Event Processing Industry Revenue (Million) Forecast, by Application 2019 & 2032
- Table 35: Argentina Complex Event Processing Industry Revenue (Million) Forecast, by Application 2019 & 2032
- Table 36: Peru Complex Event Processing Industry Revenue (Million) Forecast, by Application 2019 & 2032
- Table 37: Chile Complex Event Processing Industry Revenue (Million) Forecast, by Application 2019 & 2032
- Table 38: Colombia Complex Event Processing Industry Revenue (Million) Forecast, by Application 2019 & 2032
- Table 39: Ecuador Complex Event Processing Industry Revenue (Million) Forecast, by Application 2019 & 2032
- Table 40: Venezuela Complex Event Processing Industry Revenue (Million) Forecast, by Application 2019 & 2032
- Table 41: Rest of South America Complex Event Processing Industry Revenue (Million) Forecast, by Application 2019 & 2032
- Table 42: Global Complex Event Processing Industry Revenue Million Forecast, by Country 2019 & 2032
- Table 43: United States Complex Event Processing Industry Revenue (Million) Forecast, by Application 2019 & 2032
- Table 44: Canada Complex Event Processing Industry Revenue (Million) Forecast, by Application 2019 & 2032
- Table 45: Mexico Complex Event Processing Industry Revenue (Million) Forecast, by Application 2019 & 2032
- Table 46: Global Complex Event Processing Industry Revenue Million Forecast, by Country 2019 & 2032
- Table 47: United Arab Emirates Complex Event Processing Industry Revenue (Million) Forecast, by Application 2019 & 2032
- Table 48: Saudi Arabia Complex Event Processing Industry Revenue (Million) Forecast, by Application 2019 & 2032
- Table 49: South Africa Complex Event Processing Industry Revenue (Million) Forecast, by Application 2019 & 2032
- Table 50: Rest of Middle East and Africa Complex Event Processing Industry Revenue (Million) Forecast, by Application 2019 & 2032
- Table 51: Global Complex Event Processing Industry Revenue Million Forecast, by Type 2019 & 2032
- Table 52: Global Complex Event Processing Industry Revenue Million Forecast, by Enterprise Type 2019 & 2032
- Table 53: Global Complex Event Processing Industry Revenue Million Forecast, by End-user Vertical 2019 & 2032
- Table 54: Global Complex Event Processing Industry Revenue Million Forecast, by Country 2019 & 2032
- Table 55: Global Complex Event Processing Industry Revenue Million Forecast, by Type 2019 & 2032
- Table 56: Global Complex Event Processing Industry Revenue Million Forecast, by Enterprise Type 2019 & 2032
- Table 57: Global Complex Event Processing Industry Revenue Million Forecast, by End-user Vertical 2019 & 2032
- Table 58: Global Complex Event Processing Industry Revenue Million Forecast, by Country 2019 & 2032
- Table 59: Global Complex Event Processing Industry Revenue Million Forecast, by Type 2019 & 2032
- Table 60: Global Complex Event Processing Industry Revenue Million Forecast, by Enterprise Type 2019 & 2032
- Table 61: Global Complex Event Processing Industry Revenue Million Forecast, by End-user Vertical 2019 & 2032
- Table 62: Global Complex Event Processing Industry Revenue Million Forecast, by Country 2019 & 2032
- Table 63: Global Complex Event Processing Industry Revenue Million Forecast, by Type 2019 & 2032
- Table 64: Global Complex Event Processing Industry Revenue Million Forecast, by Enterprise Type 2019 & 2032
- Table 65: Global Complex Event Processing Industry Revenue Million Forecast, by End-user Vertical 2019 & 2032
- Table 66: Global Complex Event Processing Industry Revenue Million Forecast, by Country 2019 & 2032
- Table 67: Global Complex Event Processing Industry Revenue Million Forecast, by Type 2019 & 2032
- Table 68: Global Complex Event Processing Industry Revenue Million Forecast, by Enterprise Type 2019 & 2032
- Table 69: Global Complex Event Processing Industry Revenue Million Forecast, by End-user Vertical 2019 & 2032
- Table 70: Global Complex Event Processing Industry Revenue Million Forecast, by Country 2019 & 2032
- Table 71: Global Complex Event Processing Industry Revenue Million Forecast, by Type 2019 & 2032
- Table 72: Global Complex Event Processing Industry Revenue Million Forecast, by Enterprise Type 2019 & 2032
- Table 73: Global Complex Event Processing Industry Revenue Million Forecast, by End-user Vertical 2019 & 2032
- Table 74: Global Complex Event Processing Industry Revenue Million Forecast, by Country 2019 & 2032
Frequently Asked Questions
1. What is the projected Compound Annual Growth Rate (CAGR) of the Complex Event Processing Industry?
The projected CAGR is approximately 23.76%.
2. Which companies are prominent players in the Complex Event Processing Industry?
Key companies in the market include SAS Institute Inc, Nastel Technologies Inc, Tibco Software Inc, Red Lambda Inc *List Not Exhaustive, IBM Corporation, Software AG, Cisco Systems Inc, Espertech Inc, Oracle Corporation, Informatica Corporation, SAP SE.
3. What are the main segments of the Complex Event Processing Industry?
The market segments include Type, Enterprise Type, End-user Vertical.
4. Can you provide details about the market size?
The market size is estimated to be USD 5.27 Million as of 2022.
5. What are some drivers contributing to market growth?
Development in the Field of Machine Learning and Data Analytics; Growing Need for Real-time Analytics.
6. What are the notable trends driving market growth?
BFSI End-user Segment to Grow Significantly.
7. Are there any restraints impacting market growth?
Lack of Consistency in Results.
8. Can you provide examples of recent developments in the market?
June 2023 - Cisco said it is reimagining how people interact with the new, advanced artificial intelligence technologies. In order to help organizations achieve productivity and simplicity in their workforce, Cisco will take advantage of major language models for Collaboration and Security across its portfolio.
9. What pricing options are available for accessing the report?
Pricing options include single-user, multi-user, and enterprise licenses priced at USD 4750, USD 5250, and USD 8750 respectively.
10. Is the market size provided in terms of value or volume?
The market size is provided in terms of value, measured in Million.
11. Are there any specific market keywords associated with the report?
Yes, the market keyword associated with the report is "Complex Event Processing Industry," which aids in identifying and referencing the specific market segment covered.
12. How do I determine which pricing option suits my needs best?
The pricing options vary based on user requirements and access needs. Individual users may opt for single-user licenses, while businesses requiring broader access may choose multi-user or enterprise licenses for cost-effective access to the report.
13. Are there any additional resources or data provided in the Complex Event Processing Industry report?
While the report offers comprehensive insights, it's advisable to review the specific contents or supplementary materials provided to ascertain if additional resources or data are available.
14. How can I stay updated on further developments or reports in the Complex Event Processing Industry?
To stay informed about further developments, trends, and reports in the Complex Event Processing Industry, consider subscribing to industry newsletters, following relevant companies and organizations, or regularly checking reputable industry news sources and publications.
Methodology
Step 1 - Identification of Relevant Samples Size from Population Database


Step 2 - Approaches for Defining Global Market Size (Value, Volume* & Price*)

Note*: In applicable scenarios
Step 3 - Data Sources
Primary Research
- Web Analytics
- Survey Reports
- Research Institute
- Latest Research Reports
- Opinion Leaders
Secondary Research
- Annual Reports
- White Paper
- Latest Press Release
- Industry Association
- Paid Database
- Investor Presentations

Step 4 - Data Triangulation
Involves using different sources of information in order to increase the validity of a study
These sources are likely to be stakeholders in a program - participants, other researchers, program staff, other community members, and so on.
Then we put all data in single framework & apply various statistical tools to find out the dynamic on the market.
During the analysis stage, feedback from the stakeholder groups would be compared to determine areas of agreement as well as areas of divergence


