
Key Insights
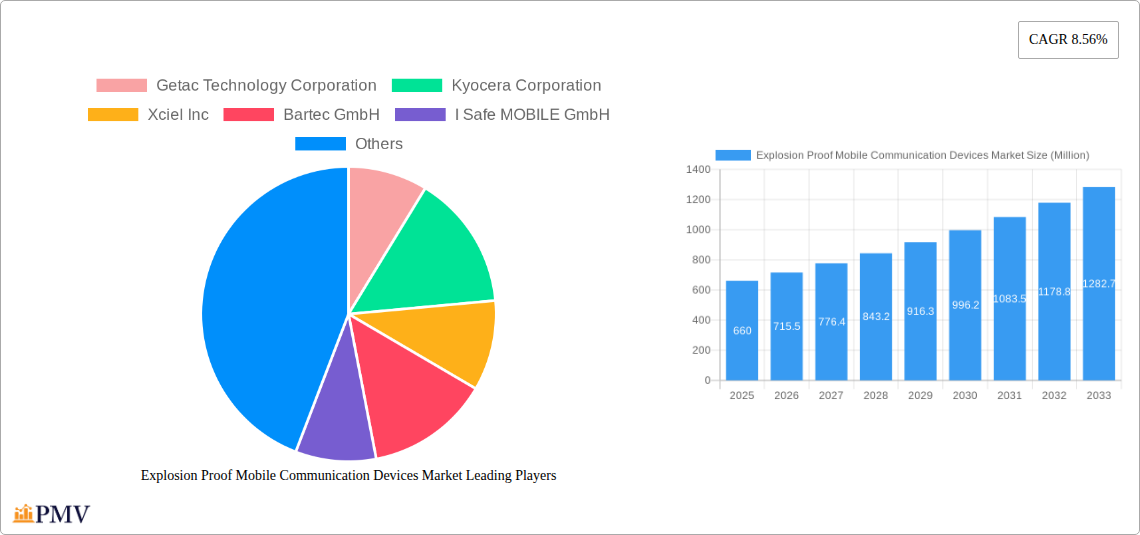
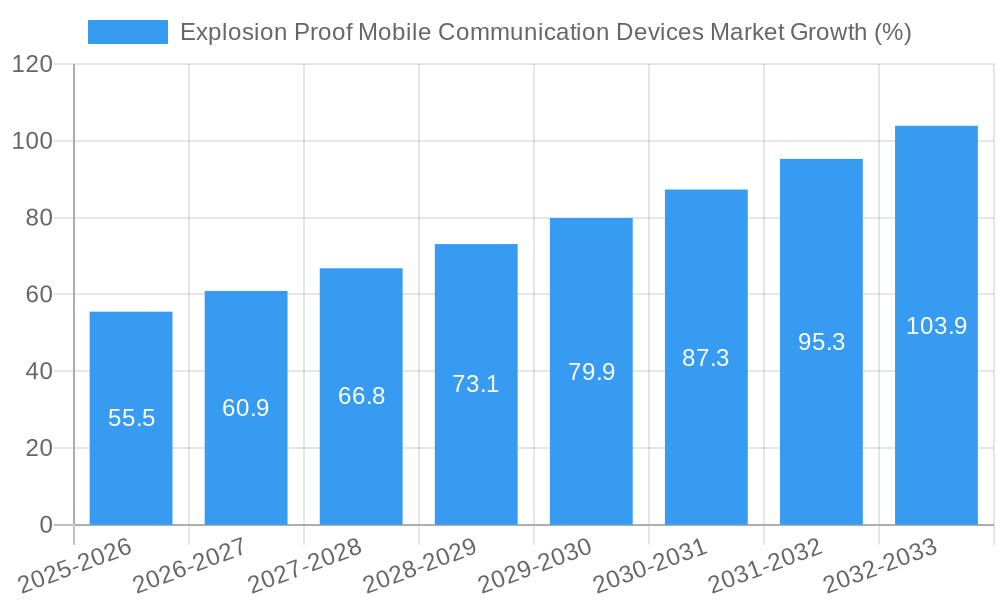
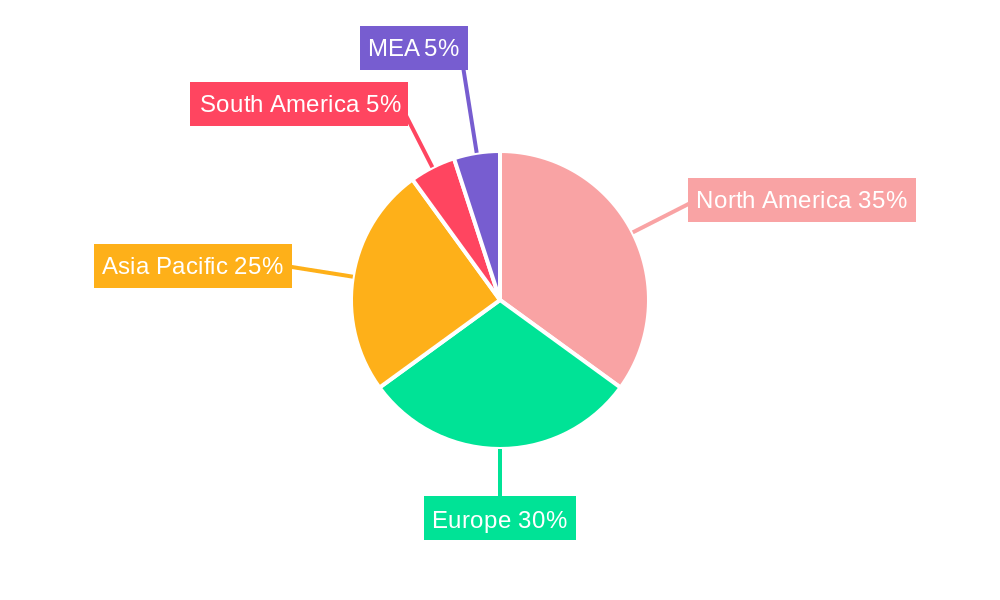
The Explosion Proof Mobile Communication Devices market, valued at $660 million in 2025, is projected to experience robust growth, driven by increasing demand across hazardous industries. The market's Compound Annual Growth Rate (CAGR) of 8.56% from 2025 to 2033 indicates a significant expansion, fueled by several key factors. Stringent safety regulations in sectors like oil and gas, mining, and manufacturing necessitate the adoption of explosion-proof communication devices, ensuring worker safety and operational efficiency in hazardous environments. Technological advancements, such as improved battery life, enhanced durability, and integration of advanced features like GPS and real-time data transmission, are further driving market growth. The rising adoption of Industry 4.0 and the Internet of Things (IoT) in these industries also contributes to the demand, as connected devices are crucial for efficient monitoring and control in hazardous settings. Smartphones and cellphones constitute a significant portion of the market, followed by two-way radios and handheld PCs. North America and Europe currently hold substantial market shares, but the Asia-Pacific region is expected to witness faster growth due to increasing industrialization and infrastructure development.
Competition in the market is intense, with established players like Getac Technology Corporation, Kyocera Corporation, and Zebra Technologies competing alongside specialized providers like Sonim Technologies and Aegex Technologies. The market's growth, however, is subject to certain restraints, primarily the high initial investment cost associated with explosion-proof devices. Moreover, the relatively shorter lifespan of these devices compared to standard communication equipment can also hinder widespread adoption. Nevertheless, the increasing awareness of safety standards and the long-term benefits of improved communication in hazardous environments are expected to outweigh these challenges, leading to sustained market expansion in the forecast period. Future growth will likely be driven by innovations focusing on affordability, enhanced features, and improved device longevity.
Explosion Proof Mobile Communication Devices Market: A Comprehensive Report (2019-2033)
This in-depth report provides a comprehensive analysis of the global Explosion Proof Mobile Communication Devices Market, offering valuable insights for stakeholders across the value chain. The study covers the period 2019-2033, with 2025 serving as the base year and estimated year. The forecast period spans from 2025 to 2033, while the historical period encompasses 2019-2024. This report is crucial for businesses seeking to understand market dynamics, identify growth opportunities, and make strategic decisions in this rapidly evolving sector.
Explosion Proof Mobile Communication Devices Market Market Structure & Competitive Dynamics
The Explosion Proof Mobile Communication Devices market exhibits a moderately concentrated structure, with several key players holding significant market share. The market is characterized by a dynamic innovation ecosystem, driven by continuous advancements in communication technologies and safety regulations. Stringent safety standards, particularly in hazardous environments like oil and gas and mining, significantly influence market dynamics. Product substitutes, while limited, include alternative communication systems designed for hazardous areas. End-user trends, such as increasing demand for enhanced connectivity and data security, are shaping market growth. Mergers and acquisitions (M&A) activities have been moderate, with deal values averaging xx Million in the recent past. Key players are actively pursuing strategic partnerships and collaborations to expand their market reach and enhance their product offerings. For instance, a recent M&A deal involved the acquisition of [Company A] by [Company B] for an estimated xx Million, strengthening the acquirer's position in the [specific segment] market. The market share of the top five players is estimated at xx%, indicating a moderate level of concentration.
Explosion Proof Mobile Communication Devices Market Industry Trends & Insights
The Explosion Proof Mobile Communication Devices market is experiencing robust growth, projected to reach xx Million by 2033, with a Compound Annual Growth Rate (CAGR) of xx% during the forecast period. This growth is primarily fueled by increasing demand from industries operating in hazardous environments, stringent safety regulations driving adoption of explosion-proof devices, and advancements in communication technologies leading to enhanced features and performance. Technological disruptions, such as the integration of 5G and improved battery technologies, are further accelerating market expansion. Consumer preferences are shifting toward more durable, reliable, and feature-rich devices. Competitive dynamics are intense, with key players focusing on product innovation, strategic partnerships, and expansion into new geographic markets. Market penetration is relatively high in developed regions, but significant growth opportunities exist in emerging economies, particularly in the oil & gas and mining sectors where safety standards are being increasingly enforced.
Dominant Markets & Segments in Explosion Proof Mobile Communication Devices Market
The Oil and Gas sector currently dominates the Explosion Proof Mobile Communication Devices market, accounting for approximately xx% of the total market value in 2025. This dominance is primarily attributed to stringent safety regulations and the inherent risk of explosions in oil and gas operations. The North American region holds a significant market share, driven by robust infrastructure development, stringent safety standards, and high levels of technological adoption.
Key Drivers in the Oil & Gas Segment:
- Stringent safety regulations
- High demand for reliable communication in hazardous environments
- Increasing exploration and production activities.
- Growing investments in automation and digitalization.
Key Drivers in North America:
- Strong regulatory framework
- High technological adoption rate
- Robust infrastructure
Within product segments, Two-way Radios currently hold the largest market share followed by Smartphones and Cellphones, owing to their simplicity, reliability, and wide acceptance in hazardous work environments. The Handheld PC segment is expected to witness significant growth due to increasing demand for data management and remote monitoring applications. The detailed dominance analysis highlights the influence of factors such as regulatory policies, infrastructure investment, and technological advancements on the growth of specific segments and regions.
Explosion Proof Mobile Communication Devices Market Product Innovations
Recent product innovations focus on enhancing durability, improving communication capabilities (e.g., incorporating 5G technology), and integrating advanced safety features. Manufacturers are incorporating features like enhanced battery life, improved ruggedness, and advanced encryption for data security to meet the demanding requirements of hazardous environments. These technological advancements ensure better communication reliability, improved safety, and enhanced data management capabilities, catering to the specific needs of various end-user industries.
Report Segmentation & Scope
This report segments the Explosion Proof Mobile Communication Devices market based on product type and end-user industry.
Product: Smartphones and Cellphones, Two-way Radios, Handheld PC, Headsets, Tablets, Other Products. Each segment showcases unique growth projections and competitive dynamics, based on product features, functionality, and target market. For example, the Two-way Radios segment is expected to experience steady growth due to their inherent robustness and reliability.
End-User Industry: Oil and Gas, Mining, Manufacturing and Processing, Chemical and Pharmaceutical, Defense, Other End-user Industries. The segmentation by end-user industry provides insights into the specific application requirements and market size within each sector. The Oil and Gas industry, due to its inherent hazardous nature, represents a significant market segment.
Key Drivers of Explosion Proof Mobile Communication Devices Market Growth
The growth of the Explosion Proof Mobile Communication Devices market is primarily driven by increasing safety concerns in hazardous industries, stringent government regulations mandating the use of explosion-proof equipment, and the rising adoption of advanced communication technologies to improve operational efficiency and worker safety. The increasing demand for robust and reliable communication systems in remote and hazardous environments and the growing investment in infrastructure development and automation across various sectors also play significant roles.
Challenges in the Explosion Proof Mobile Communication Devices Market Sector
Key challenges include the high cost of explosion-proof devices, the complexity of integrating these devices into existing communication systems, and the limited availability of skilled personnel for installation and maintenance. Supply chain disruptions, particularly those concerning specialized components, also pose a significant challenge. Moreover, intense competition and the need for continuous innovation to meet evolving industry standards present further hurdles to market growth. These factors can impact profitability and overall market expansion.
Leading Players in the Explosion Proof Mobile Communication Devices Market Market
- Getac Technology Corporation
- Kyocera Corporation
- Xciel Inc
- Bartec GmbH
- I Safe MOBILE GmbH
- Caterpillar Inc
- Airacom Limited
- Sonim Technologies Inc
- Aegex Technologies LLC
- RugGear
- Panasonic Corporation
- Zebra Technologies Corporation (Xplore Technologies Corp)
Key Developments in Explosion Proof Mobile Communication Devices Market Sector
- January 2023: Getac launched a new rugged tablet with enhanced communication capabilities.
- June 2022: Sonim Technologies partnered with a major telecommunications provider to expand its market reach.
- November 2021: A significant merger between two key players reshaped the competitive landscape. (Specifics redacted for confidentiality)
- March 2020: New safety regulations were introduced in the European Union impacting the market.
Strategic Explosion Proof Mobile Communication Devices Market Market Outlook
The future of the Explosion Proof Mobile Communication Devices market looks promising, driven by continuous technological advancements, increasing demand from diverse industries, and supportive regulatory frameworks. The market presents significant growth opportunities for companies focusing on product innovation, strategic partnerships, and expanding into emerging markets. Companies that can effectively address the challenges related to cost, complexity, and supply chain management will be well-positioned to capture a larger market share and achieve sustainable growth in the coming years. Focus on integrating advanced features, such as improved battery life, enhanced data security, and seamless connectivity, will be crucial for success.
Explosion Proof Mobile Communication Devices Market Segmentation
-
1. Product
- 1.1. Smartphones and Cellphones
- 1.2. Two-way Radios
- 1.3. Handheld PC
- 1.4. Headsets
- 1.5. Tablets
- 1.6. Other Products
-
2. End-User Industry
- 2.1. Oil and Gas
- 2.2. Mining
- 2.3. Manufacturing and Processing
- 2.4. Chemical and Pharmaceutical
- 2.5. Defense
- 2.6. Other End-user Industries
Explosion Proof Mobile Communication Devices Market Segmentation By Geography
- 1. North America
- 2. Europe
- 3. Asia Pacific
- 4. Latin America
- 5. Middle East
Explosion Proof Mobile Communication Devices Market REPORT HIGHLIGHTS
| Aspects | Details |
|---|---|
| Study Period | 2019-2033 |
| Base Year | 2024 |
| Estimated Year | 2025 |
| Forecast Period | 2025-2033 |
| Historical Period | 2019-2024 |
| Growth Rate | CAGR of 8.56% from 2019-2033 |
| Segmentation |
|
Table of Contents
- 1. Introduction
- 1.1. Research Scope
- 1.2. Market Segmentation
- 1.3. Research Methodology
- 1.4. Definitions and Assumptions
- 2. Executive Summary
- 2.1. Introduction
- 3. Market Dynamics
- 3.1. Introduction
- 3.2. Market Drivers
- 3.2.1 ; Need for Fast and Seamless Voice
- 3.2.2 Image
- 3.2.3 and Data Transfer in Industries; Government Rules and Regulations on the Use of Safe Equipment in Hazardous Places
- 3.3. Market Restrains
- 3.3.1. ; Safety Regulations Vary Across Different Regions
- 3.4. Market Trends
- 3.4.1. Oil and Gas Industry Expected to Show Significant Growth
- 4. Market Factor Analysis
- 4.1. Porters Five Forces
- 4.2. Supply/Value Chain
- 4.3. PESTEL analysis
- 4.4. Market Entropy
- 4.5. Patent/Trademark Analysis
- 5. Global Explosion Proof Mobile Communication Devices Market Analysis, Insights and Forecast, 2019-2031
- 5.1. Market Analysis, Insights and Forecast - by Product
- 5.1.1. Smartphones and Cellphones
- 5.1.2. Two-way Radios
- 5.1.3. Handheld PC
- 5.1.4. Headsets
- 5.1.5. Tablets
- 5.1.6. Other Products
- 5.2. Market Analysis, Insights and Forecast - by End-User Industry
- 5.2.1. Oil and Gas
- 5.2.2. Mining
- 5.2.3. Manufacturing and Processing
- 5.2.4. Chemical and Pharmaceutical
- 5.2.5. Defense
- 5.2.6. Other End-user Industries
- 5.3. Market Analysis, Insights and Forecast - by Region
- 5.3.1. North America
- 5.3.2. Europe
- 5.3.3. Asia Pacific
- 5.3.4. Latin America
- 5.3.5. Middle East
- 5.1. Market Analysis, Insights and Forecast - by Product
- 6. North America Explosion Proof Mobile Communication Devices Market Analysis, Insights and Forecast, 2019-2031
- 6.1. Market Analysis, Insights and Forecast - by Product
- 6.1.1. Smartphones and Cellphones
- 6.1.2. Two-way Radios
- 6.1.3. Handheld PC
- 6.1.4. Headsets
- 6.1.5. Tablets
- 6.1.6. Other Products
- 6.2. Market Analysis, Insights and Forecast - by End-User Industry
- 6.2.1. Oil and Gas
- 6.2.2. Mining
- 6.2.3. Manufacturing and Processing
- 6.2.4. Chemical and Pharmaceutical
- 6.2.5. Defense
- 6.2.6. Other End-user Industries
- 6.1. Market Analysis, Insights and Forecast - by Product
- 7. Europe Explosion Proof Mobile Communication Devices Market Analysis, Insights and Forecast, 2019-2031
- 7.1. Market Analysis, Insights and Forecast - by Product
- 7.1.1. Smartphones and Cellphones
- 7.1.2. Two-way Radios
- 7.1.3. Handheld PC
- 7.1.4. Headsets
- 7.1.5. Tablets
- 7.1.6. Other Products
- 7.2. Market Analysis, Insights and Forecast - by End-User Industry
- 7.2.1. Oil and Gas
- 7.2.2. Mining
- 7.2.3. Manufacturing and Processing
- 7.2.4. Chemical and Pharmaceutical
- 7.2.5. Defense
- 7.2.6. Other End-user Industries
- 7.1. Market Analysis, Insights and Forecast - by Product
- 8. Asia Pacific Explosion Proof Mobile Communication Devices Market Analysis, Insights and Forecast, 2019-2031
- 8.1. Market Analysis, Insights and Forecast - by Product
- 8.1.1. Smartphones and Cellphones
- 8.1.2. Two-way Radios
- 8.1.3. Handheld PC
- 8.1.4. Headsets
- 8.1.5. Tablets
- 8.1.6. Other Products
- 8.2. Market Analysis, Insights and Forecast - by End-User Industry
- 8.2.1. Oil and Gas
- 8.2.2. Mining
- 8.2.3. Manufacturing and Processing
- 8.2.4. Chemical and Pharmaceutical
- 8.2.5. Defense
- 8.2.6. Other End-user Industries
- 8.1. Market Analysis, Insights and Forecast - by Product
- 9. Latin America Explosion Proof Mobile Communication Devices Market Analysis, Insights and Forecast, 2019-2031
- 9.1. Market Analysis, Insights and Forecast - by Product
- 9.1.1. Smartphones and Cellphones
- 9.1.2. Two-way Radios
- 9.1.3. Handheld PC
- 9.1.4. Headsets
- 9.1.5. Tablets
- 9.1.6. Other Products
- 9.2. Market Analysis, Insights and Forecast - by End-User Industry
- 9.2.1. Oil and Gas
- 9.2.2. Mining
- 9.2.3. Manufacturing and Processing
- 9.2.4. Chemical and Pharmaceutical
- 9.2.5. Defense
- 9.2.6. Other End-user Industries
- 9.1. Market Analysis, Insights and Forecast - by Product
- 10. Middle East Explosion Proof Mobile Communication Devices Market Analysis, Insights and Forecast, 2019-2031
- 10.1. Market Analysis, Insights and Forecast - by Product
- 10.1.1. Smartphones and Cellphones
- 10.1.2. Two-way Radios
- 10.1.3. Handheld PC
- 10.1.4. Headsets
- 10.1.5. Tablets
- 10.1.6. Other Products
- 10.2. Market Analysis, Insights and Forecast - by End-User Industry
- 10.2.1. Oil and Gas
- 10.2.2. Mining
- 10.2.3. Manufacturing and Processing
- 10.2.4. Chemical and Pharmaceutical
- 10.2.5. Defense
- 10.2.6. Other End-user Industries
- 10.1. Market Analysis, Insights and Forecast - by Product
- 11. North America Explosion Proof Mobile Communication Devices Market Analysis, Insights and Forecast, 2019-2031
- 11.1. Market Analysis, Insights and Forecast - By Country/Sub-region
- 11.1.1 United States
- 11.1.2 Canada
- 11.1.3 Mexico
- 12. Europe Explosion Proof Mobile Communication Devices Market Analysis, Insights and Forecast, 2019-2031
- 12.1. Market Analysis, Insights and Forecast - By Country/Sub-region
- 12.1.1 Germany
- 12.1.2 United Kingdom
- 12.1.3 France
- 12.1.4 Spain
- 12.1.5 Italy
- 12.1.6 Spain
- 12.1.7 Belgium
- 12.1.8 Netherland
- 12.1.9 Nordics
- 12.1.10 Rest of Europe
- 13. Asia Pacific Explosion Proof Mobile Communication Devices Market Analysis, Insights and Forecast, 2019-2031
- 13.1. Market Analysis, Insights and Forecast - By Country/Sub-region
- 13.1.1 China
- 13.1.2 Japan
- 13.1.3 India
- 13.1.4 South Korea
- 13.1.5 Southeast Asia
- 13.1.6 Australia
- 13.1.7 Indonesia
- 13.1.8 Phillipes
- 13.1.9 Singapore
- 13.1.10 Thailandc
- 13.1.11 Rest of Asia Pacific
- 14. South America Explosion Proof Mobile Communication Devices Market Analysis, Insights and Forecast, 2019-2031
- 14.1. Market Analysis, Insights and Forecast - By Country/Sub-region
- 14.1.1 Brazil
- 14.1.2 Argentina
- 14.1.3 Peru
- 14.1.4 Chile
- 14.1.5 Colombia
- 14.1.6 Ecuador
- 14.1.7 Venezuela
- 14.1.8 Rest of South America
- 15. North America Explosion Proof Mobile Communication Devices Market Analysis, Insights and Forecast, 2019-2031
- 15.1. Market Analysis, Insights and Forecast - By Country/Sub-region
- 15.1.1 United States
- 15.1.2 Canada
- 15.1.3 Mexico
- 16. MEA Explosion Proof Mobile Communication Devices Market Analysis, Insights and Forecast, 2019-2031
- 16.1. Market Analysis, Insights and Forecast - By Country/Sub-region
- 16.1.1 United Arab Emirates
- 16.1.2 Saudi Arabia
- 16.1.3 South Africa
- 16.1.4 Rest of Middle East and Africa
- 17. Competitive Analysis
- 17.1. Global Market Share Analysis 2024
- 17.2. Company Profiles
- 17.2.1 Getac Technology Corporation
- 17.2.1.1. Overview
- 17.2.1.2. Products
- 17.2.1.3. SWOT Analysis
- 17.2.1.4. Recent Developments
- 17.2.1.5. Financials (Based on Availability)
- 17.2.2 Kyocera Corporation
- 17.2.2.1. Overview
- 17.2.2.2. Products
- 17.2.2.3. SWOT Analysis
- 17.2.2.4. Recent Developments
- 17.2.2.5. Financials (Based on Availability)
- 17.2.3 Xciel Inc
- 17.2.3.1. Overview
- 17.2.3.2. Products
- 17.2.3.3. SWOT Analysis
- 17.2.3.4. Recent Developments
- 17.2.3.5. Financials (Based on Availability)
- 17.2.4 Bartec GmbH
- 17.2.4.1. Overview
- 17.2.4.2. Products
- 17.2.4.3. SWOT Analysis
- 17.2.4.4. Recent Developments
- 17.2.4.5. Financials (Based on Availability)
- 17.2.5 I Safe MOBILE GmbH
- 17.2.5.1. Overview
- 17.2.5.2. Products
- 17.2.5.3. SWOT Analysis
- 17.2.5.4. Recent Developments
- 17.2.5.5. Financials (Based on Availability)
- 17.2.6 Caterpillar Inc
- 17.2.6.1. Overview
- 17.2.6.2. Products
- 17.2.6.3. SWOT Analysis
- 17.2.6.4. Recent Developments
- 17.2.6.5. Financials (Based on Availability)
- 17.2.7 Airacom Limited
- 17.2.7.1. Overview
- 17.2.7.2. Products
- 17.2.7.3. SWOT Analysis
- 17.2.7.4. Recent Developments
- 17.2.7.5. Financials (Based on Availability)
- 17.2.8 Sonim Technologies Inc
- 17.2.8.1. Overview
- 17.2.8.2. Products
- 17.2.8.3. SWOT Analysis
- 17.2.8.4. Recent Developments
- 17.2.8.5. Financials (Based on Availability)
- 17.2.9 Aegex Technologies LLC
- 17.2.9.1. Overview
- 17.2.9.2. Products
- 17.2.9.3. SWOT Analysis
- 17.2.9.4. Recent Developments
- 17.2.9.5. Financials (Based on Availability)
- 17.2.10 RugGear
- 17.2.10.1. Overview
- 17.2.10.2. Products
- 17.2.10.3. SWOT Analysis
- 17.2.10.4. Recent Developments
- 17.2.10.5. Financials (Based on Availability)
- 17.2.11 Panasonic Corporation
- 17.2.11.1. Overview
- 17.2.11.2. Products
- 17.2.11.3. SWOT Analysis
- 17.2.11.4. Recent Developments
- 17.2.11.5. Financials (Based on Availability)
- 17.2.12 Zebra Technologies Corporation (Xplore Technologies Corp )
- 17.2.12.1. Overview
- 17.2.12.2. Products
- 17.2.12.3. SWOT Analysis
- 17.2.12.4. Recent Developments
- 17.2.12.5. Financials (Based on Availability)
- 17.2.1 Getac Technology Corporation
List of Figures
- Figure 1: Global Explosion Proof Mobile Communication Devices Market Revenue Breakdown (Million, %) by Region 2024 & 2032
- Figure 2: Global Explosion Proof Mobile Communication Devices Market Volume Breakdown (K Unit, %) by Region 2024 & 2032
- Figure 3: North America Explosion Proof Mobile Communication Devices Market Revenue (Million), by Country 2024 & 2032
- Figure 4: North America Explosion Proof Mobile Communication Devices Market Volume (K Unit), by Country 2024 & 2032
- Figure 5: North America Explosion Proof Mobile Communication Devices Market Revenue Share (%), by Country 2024 & 2032
- Figure 6: North America Explosion Proof Mobile Communication Devices Market Volume Share (%), by Country 2024 & 2032
- Figure 7: Europe Explosion Proof Mobile Communication Devices Market Revenue (Million), by Country 2024 & 2032
- Figure 8: Europe Explosion Proof Mobile Communication Devices Market Volume (K Unit), by Country 2024 & 2032
- Figure 9: Europe Explosion Proof Mobile Communication Devices Market Revenue Share (%), by Country 2024 & 2032
- Figure 10: Europe Explosion Proof Mobile Communication Devices Market Volume Share (%), by Country 2024 & 2032
- Figure 11: Asia Pacific Explosion Proof Mobile Communication Devices Market Revenue (Million), by Country 2024 & 2032
- Figure 12: Asia Pacific Explosion Proof Mobile Communication Devices Market Volume (K Unit), by Country 2024 & 2032
- Figure 13: Asia Pacific Explosion Proof Mobile Communication Devices Market Revenue Share (%), by Country 2024 & 2032
- Figure 14: Asia Pacific Explosion Proof Mobile Communication Devices Market Volume Share (%), by Country 2024 & 2032
- Figure 15: South America Explosion Proof Mobile Communication Devices Market Revenue (Million), by Country 2024 & 2032
- Figure 16: South America Explosion Proof Mobile Communication Devices Market Volume (K Unit), by Country 2024 & 2032
- Figure 17: South America Explosion Proof Mobile Communication Devices Market Revenue Share (%), by Country 2024 & 2032
- Figure 18: South America Explosion Proof Mobile Communication Devices Market Volume Share (%), by Country 2024 & 2032
- Figure 19: North America Explosion Proof Mobile Communication Devices Market Revenue (Million), by Country 2024 & 2032
- Figure 20: North America Explosion Proof Mobile Communication Devices Market Volume (K Unit), by Country 2024 & 2032
- Figure 21: North America Explosion Proof Mobile Communication Devices Market Revenue Share (%), by Country 2024 & 2032
- Figure 22: North America Explosion Proof Mobile Communication Devices Market Volume Share (%), by Country 2024 & 2032
- Figure 23: MEA Explosion Proof Mobile Communication Devices Market Revenue (Million), by Country 2024 & 2032
- Figure 24: MEA Explosion Proof Mobile Communication Devices Market Volume (K Unit), by Country 2024 & 2032
- Figure 25: MEA Explosion Proof Mobile Communication Devices Market Revenue Share (%), by Country 2024 & 2032
- Figure 26: MEA Explosion Proof Mobile Communication Devices Market Volume Share (%), by Country 2024 & 2032
- Figure 27: North America Explosion Proof Mobile Communication Devices Market Revenue (Million), by Product 2024 & 2032
- Figure 28: North America Explosion Proof Mobile Communication Devices Market Volume (K Unit), by Product 2024 & 2032
- Figure 29: North America Explosion Proof Mobile Communication Devices Market Revenue Share (%), by Product 2024 & 2032
- Figure 30: North America Explosion Proof Mobile Communication Devices Market Volume Share (%), by Product 2024 & 2032
- Figure 31: North America Explosion Proof Mobile Communication Devices Market Revenue (Million), by End-User Industry 2024 & 2032
- Figure 32: North America Explosion Proof Mobile Communication Devices Market Volume (K Unit), by End-User Industry 2024 & 2032
- Figure 33: North America Explosion Proof Mobile Communication Devices Market Revenue Share (%), by End-User Industry 2024 & 2032
- Figure 34: North America Explosion Proof Mobile Communication Devices Market Volume Share (%), by End-User Industry 2024 & 2032
- Figure 35: North America Explosion Proof Mobile Communication Devices Market Revenue (Million), by Country 2024 & 2032
- Figure 36: North America Explosion Proof Mobile Communication Devices Market Volume (K Unit), by Country 2024 & 2032
- Figure 37: North America Explosion Proof Mobile Communication Devices Market Revenue Share (%), by Country 2024 & 2032
- Figure 38: North America Explosion Proof Mobile Communication Devices Market Volume Share (%), by Country 2024 & 2032
- Figure 39: Europe Explosion Proof Mobile Communication Devices Market Revenue (Million), by Product 2024 & 2032
- Figure 40: Europe Explosion Proof Mobile Communication Devices Market Volume (K Unit), by Product 2024 & 2032
- Figure 41: Europe Explosion Proof Mobile Communication Devices Market Revenue Share (%), by Product 2024 & 2032
- Figure 42: Europe Explosion Proof Mobile Communication Devices Market Volume Share (%), by Product 2024 & 2032
- Figure 43: Europe Explosion Proof Mobile Communication Devices Market Revenue (Million), by End-User Industry 2024 & 2032
- Figure 44: Europe Explosion Proof Mobile Communication Devices Market Volume (K Unit), by End-User Industry 2024 & 2032
- Figure 45: Europe Explosion Proof Mobile Communication Devices Market Revenue Share (%), by End-User Industry 2024 & 2032
- Figure 46: Europe Explosion Proof Mobile Communication Devices Market Volume Share (%), by End-User Industry 2024 & 2032
- Figure 47: Europe Explosion Proof Mobile Communication Devices Market Revenue (Million), by Country 2024 & 2032
- Figure 48: Europe Explosion Proof Mobile Communication Devices Market Volume (K Unit), by Country 2024 & 2032
- Figure 49: Europe Explosion Proof Mobile Communication Devices Market Revenue Share (%), by Country 2024 & 2032
- Figure 50: Europe Explosion Proof Mobile Communication Devices Market Volume Share (%), by Country 2024 & 2032
- Figure 51: Asia Pacific Explosion Proof Mobile Communication Devices Market Revenue (Million), by Product 2024 & 2032
- Figure 52: Asia Pacific Explosion Proof Mobile Communication Devices Market Volume (K Unit), by Product 2024 & 2032
- Figure 53: Asia Pacific Explosion Proof Mobile Communication Devices Market Revenue Share (%), by Product 2024 & 2032
- Figure 54: Asia Pacific Explosion Proof Mobile Communication Devices Market Volume Share (%), by Product 2024 & 2032
- Figure 55: Asia Pacific Explosion Proof Mobile Communication Devices Market Revenue (Million), by End-User Industry 2024 & 2032
- Figure 56: Asia Pacific Explosion Proof Mobile Communication Devices Market Volume (K Unit), by End-User Industry 2024 & 2032
- Figure 57: Asia Pacific Explosion Proof Mobile Communication Devices Market Revenue Share (%), by End-User Industry 2024 & 2032
- Figure 58: Asia Pacific Explosion Proof Mobile Communication Devices Market Volume Share (%), by End-User Industry 2024 & 2032
- Figure 59: Asia Pacific Explosion Proof Mobile Communication Devices Market Revenue (Million), by Country 2024 & 2032
- Figure 60: Asia Pacific Explosion Proof Mobile Communication Devices Market Volume (K Unit), by Country 2024 & 2032
- Figure 61: Asia Pacific Explosion Proof Mobile Communication Devices Market Revenue Share (%), by Country 2024 & 2032
- Figure 62: Asia Pacific Explosion Proof Mobile Communication Devices Market Volume Share (%), by Country 2024 & 2032
- Figure 63: Latin America Explosion Proof Mobile Communication Devices Market Revenue (Million), by Product 2024 & 2032
- Figure 64: Latin America Explosion Proof Mobile Communication Devices Market Volume (K Unit), by Product 2024 & 2032
- Figure 65: Latin America Explosion Proof Mobile Communication Devices Market Revenue Share (%), by Product 2024 & 2032
- Figure 66: Latin America Explosion Proof Mobile Communication Devices Market Volume Share (%), by Product 2024 & 2032
- Figure 67: Latin America Explosion Proof Mobile Communication Devices Market Revenue (Million), by End-User Industry 2024 & 2032
- Figure 68: Latin America Explosion Proof Mobile Communication Devices Market Volume (K Unit), by End-User Industry 2024 & 2032
- Figure 69: Latin America Explosion Proof Mobile Communication Devices Market Revenue Share (%), by End-User Industry 2024 & 2032
- Figure 70: Latin America Explosion Proof Mobile Communication Devices Market Volume Share (%), by End-User Industry 2024 & 2032
- Figure 71: Latin America Explosion Proof Mobile Communication Devices Market Revenue (Million), by Country 2024 & 2032
- Figure 72: Latin America Explosion Proof Mobile Communication Devices Market Volume (K Unit), by Country 2024 & 2032
- Figure 73: Latin America Explosion Proof Mobile Communication Devices Market Revenue Share (%), by Country 2024 & 2032
- Figure 74: Latin America Explosion Proof Mobile Communication Devices Market Volume Share (%), by Country 2024 & 2032
- Figure 75: Middle East Explosion Proof Mobile Communication Devices Market Revenue (Million), by Product 2024 & 2032
- Figure 76: Middle East Explosion Proof Mobile Communication Devices Market Volume (K Unit), by Product 2024 & 2032
- Figure 77: Middle East Explosion Proof Mobile Communication Devices Market Revenue Share (%), by Product 2024 & 2032
- Figure 78: Middle East Explosion Proof Mobile Communication Devices Market Volume Share (%), by Product 2024 & 2032
- Figure 79: Middle East Explosion Proof Mobile Communication Devices Market Revenue (Million), by End-User Industry 2024 & 2032
- Figure 80: Middle East Explosion Proof Mobile Communication Devices Market Volume (K Unit), by End-User Industry 2024 & 2032
- Figure 81: Middle East Explosion Proof Mobile Communication Devices Market Revenue Share (%), by End-User Industry 2024 & 2032
- Figure 82: Middle East Explosion Proof Mobile Communication Devices Market Volume Share (%), by End-User Industry 2024 & 2032
- Figure 83: Middle East Explosion Proof Mobile Communication Devices Market Revenue (Million), by Country 2024 & 2032
- Figure 84: Middle East Explosion Proof Mobile Communication Devices Market Volume (K Unit), by Country 2024 & 2032
- Figure 85: Middle East Explosion Proof Mobile Communication Devices Market Revenue Share (%), by Country 2024 & 2032
- Figure 86: Middle East Explosion Proof Mobile Communication Devices Market Volume Share (%), by Country 2024 & 2032
List of Tables
- Table 1: Global Explosion Proof Mobile Communication Devices Market Revenue Million Forecast, by Region 2019 & 2032
- Table 2: Global Explosion Proof Mobile Communication Devices Market Volume K Unit Forecast, by Region 2019 & 2032
- Table 3: Global Explosion Proof Mobile Communication Devices Market Revenue Million Forecast, by Product 2019 & 2032
- Table 4: Global Explosion Proof Mobile Communication Devices Market Volume K Unit Forecast, by Product 2019 & 2032
- Table 5: Global Explosion Proof Mobile Communication Devices Market Revenue Million Forecast, by End-User Industry 2019 & 2032
- Table 6: Global Explosion Proof Mobile Communication Devices Market Volume K Unit Forecast, by End-User Industry 2019 & 2032
- Table 7: Global Explosion Proof Mobile Communication Devices Market Revenue Million Forecast, by Region 2019 & 2032
- Table 8: Global Explosion Proof Mobile Communication Devices Market Volume K Unit Forecast, by Region 2019 & 2032
- Table 9: Global Explosion Proof Mobile Communication Devices Market Revenue Million Forecast, by Country 2019 & 2032
- Table 10: Global Explosion Proof Mobile Communication Devices Market Volume K Unit Forecast, by Country 2019 & 2032
- Table 11: United States Explosion Proof Mobile Communication Devices Market Revenue (Million) Forecast, by Application 2019 & 2032
- Table 12: United States Explosion Proof Mobile Communication Devices Market Volume (K Unit) Forecast, by Application 2019 & 2032
- Table 13: Canada Explosion Proof Mobile Communication Devices Market Revenue (Million) Forecast, by Application 2019 & 2032
- Table 14: Canada Explosion Proof Mobile Communication Devices Market Volume (K Unit) Forecast, by Application 2019 & 2032
- Table 15: Mexico Explosion Proof Mobile Communication Devices Market Revenue (Million) Forecast, by Application 2019 & 2032
- Table 16: Mexico Explosion Proof Mobile Communication Devices Market Volume (K Unit) Forecast, by Application 2019 & 2032
- Table 17: Global Explosion Proof Mobile Communication Devices Market Revenue Million Forecast, by Country 2019 & 2032
- Table 18: Global Explosion Proof Mobile Communication Devices Market Volume K Unit Forecast, by Country 2019 & 2032
- Table 19: Germany Explosion Proof Mobile Communication Devices Market Revenue (Million) Forecast, by Application 2019 & 2032
- Table 20: Germany Explosion Proof Mobile Communication Devices Market Volume (K Unit) Forecast, by Application 2019 & 2032
- Table 21: United Kingdom Explosion Proof Mobile Communication Devices Market Revenue (Million) Forecast, by Application 2019 & 2032
- Table 22: United Kingdom Explosion Proof Mobile Communication Devices Market Volume (K Unit) Forecast, by Application 2019 & 2032
- Table 23: France Explosion Proof Mobile Communication Devices Market Revenue (Million) Forecast, by Application 2019 & 2032
- Table 24: France Explosion Proof Mobile Communication Devices Market Volume (K Unit) Forecast, by Application 2019 & 2032
- Table 25: Spain Explosion Proof Mobile Communication Devices Market Revenue (Million) Forecast, by Application 2019 & 2032
- Table 26: Spain Explosion Proof Mobile Communication Devices Market Volume (K Unit) Forecast, by Application 2019 & 2032
- Table 27: Italy Explosion Proof Mobile Communication Devices Market Revenue (Million) Forecast, by Application 2019 & 2032
- Table 28: Italy Explosion Proof Mobile Communication Devices Market Volume (K Unit) Forecast, by Application 2019 & 2032
- Table 29: Spain Explosion Proof Mobile Communication Devices Market Revenue (Million) Forecast, by Application 2019 & 2032
- Table 30: Spain Explosion Proof Mobile Communication Devices Market Volume (K Unit) Forecast, by Application 2019 & 2032
- Table 31: Belgium Explosion Proof Mobile Communication Devices Market Revenue (Million) Forecast, by Application 2019 & 2032
- Table 32: Belgium Explosion Proof Mobile Communication Devices Market Volume (K Unit) Forecast, by Application 2019 & 2032
- Table 33: Netherland Explosion Proof Mobile Communication Devices Market Revenue (Million) Forecast, by Application 2019 & 2032
- Table 34: Netherland Explosion Proof Mobile Communication Devices Market Volume (K Unit) Forecast, by Application 2019 & 2032
- Table 35: Nordics Explosion Proof Mobile Communication Devices Market Revenue (Million) Forecast, by Application 2019 & 2032
- Table 36: Nordics Explosion Proof Mobile Communication Devices Market Volume (K Unit) Forecast, by Application 2019 & 2032
- Table 37: Rest of Europe Explosion Proof Mobile Communication Devices Market Revenue (Million) Forecast, by Application 2019 & 2032
- Table 38: Rest of Europe Explosion Proof Mobile Communication Devices Market Volume (K Unit) Forecast, by Application 2019 & 2032
- Table 39: Global Explosion Proof Mobile Communication Devices Market Revenue Million Forecast, by Country 2019 & 2032
- Table 40: Global Explosion Proof Mobile Communication Devices Market Volume K Unit Forecast, by Country 2019 & 2032
- Table 41: China Explosion Proof Mobile Communication Devices Market Revenue (Million) Forecast, by Application 2019 & 2032
- Table 42: China Explosion Proof Mobile Communication Devices Market Volume (K Unit) Forecast, by Application 2019 & 2032
- Table 43: Japan Explosion Proof Mobile Communication Devices Market Revenue (Million) Forecast, by Application 2019 & 2032
- Table 44: Japan Explosion Proof Mobile Communication Devices Market Volume (K Unit) Forecast, by Application 2019 & 2032
- Table 45: India Explosion Proof Mobile Communication Devices Market Revenue (Million) Forecast, by Application 2019 & 2032
- Table 46: India Explosion Proof Mobile Communication Devices Market Volume (K Unit) Forecast, by Application 2019 & 2032
- Table 47: South Korea Explosion Proof Mobile Communication Devices Market Revenue (Million) Forecast, by Application 2019 & 2032
- Table 48: South Korea Explosion Proof Mobile Communication Devices Market Volume (K Unit) Forecast, by Application 2019 & 2032
- Table 49: Southeast Asia Explosion Proof Mobile Communication Devices Market Revenue (Million) Forecast, by Application 2019 & 2032
- Table 50: Southeast Asia Explosion Proof Mobile Communication Devices Market Volume (K Unit) Forecast, by Application 2019 & 2032
- Table 51: Australia Explosion Proof Mobile Communication Devices Market Revenue (Million) Forecast, by Application 2019 & 2032
- Table 52: Australia Explosion Proof Mobile Communication Devices Market Volume (K Unit) Forecast, by Application 2019 & 2032
- Table 53: Indonesia Explosion Proof Mobile Communication Devices Market Revenue (Million) Forecast, by Application 2019 & 2032
- Table 54: Indonesia Explosion Proof Mobile Communication Devices Market Volume (K Unit) Forecast, by Application 2019 & 2032
- Table 55: Phillipes Explosion Proof Mobile Communication Devices Market Revenue (Million) Forecast, by Application 2019 & 2032
- Table 56: Phillipes Explosion Proof Mobile Communication Devices Market Volume (K Unit) Forecast, by Application 2019 & 2032
- Table 57: Singapore Explosion Proof Mobile Communication Devices Market Revenue (Million) Forecast, by Application 2019 & 2032
- Table 58: Singapore Explosion Proof Mobile Communication Devices Market Volume (K Unit) Forecast, by Application 2019 & 2032
- Table 59: Thailandc Explosion Proof Mobile Communication Devices Market Revenue (Million) Forecast, by Application 2019 & 2032
- Table 60: Thailandc Explosion Proof Mobile Communication Devices Market Volume (K Unit) Forecast, by Application 2019 & 2032
- Table 61: Rest of Asia Pacific Explosion Proof Mobile Communication Devices Market Revenue (Million) Forecast, by Application 2019 & 2032
- Table 62: Rest of Asia Pacific Explosion Proof Mobile Communication Devices Market Volume (K Unit) Forecast, by Application 2019 & 2032
- Table 63: Global Explosion Proof Mobile Communication Devices Market Revenue Million Forecast, by Country 2019 & 2032
- Table 64: Global Explosion Proof Mobile Communication Devices Market Volume K Unit Forecast, by Country 2019 & 2032
- Table 65: Brazil Explosion Proof Mobile Communication Devices Market Revenue (Million) Forecast, by Application 2019 & 2032
- Table 66: Brazil Explosion Proof Mobile Communication Devices Market Volume (K Unit) Forecast, by Application 2019 & 2032
- Table 67: Argentina Explosion Proof Mobile Communication Devices Market Revenue (Million) Forecast, by Application 2019 & 2032
- Table 68: Argentina Explosion Proof Mobile Communication Devices Market Volume (K Unit) Forecast, by Application 2019 & 2032
- Table 69: Peru Explosion Proof Mobile Communication Devices Market Revenue (Million) Forecast, by Application 2019 & 2032
- Table 70: Peru Explosion Proof Mobile Communication Devices Market Volume (K Unit) Forecast, by Application 2019 & 2032
- Table 71: Chile Explosion Proof Mobile Communication Devices Market Revenue (Million) Forecast, by Application 2019 & 2032
- Table 72: Chile Explosion Proof Mobile Communication Devices Market Volume (K Unit) Forecast, by Application 2019 & 2032
- Table 73: Colombia Explosion Proof Mobile Communication Devices Market Revenue (Million) Forecast, by Application 2019 & 2032
- Table 74: Colombia Explosion Proof Mobile Communication Devices Market Volume (K Unit) Forecast, by Application 2019 & 2032
- Table 75: Ecuador Explosion Proof Mobile Communication Devices Market Revenue (Million) Forecast, by Application 2019 & 2032
- Table 76: Ecuador Explosion Proof Mobile Communication Devices Market Volume (K Unit) Forecast, by Application 2019 & 2032
- Table 77: Venezuela Explosion Proof Mobile Communication Devices Market Revenue (Million) Forecast, by Application 2019 & 2032
- Table 78: Venezuela Explosion Proof Mobile Communication Devices Market Volume (K Unit) Forecast, by Application 2019 & 2032
- Table 79: Rest of South America Explosion Proof Mobile Communication Devices Market Revenue (Million) Forecast, by Application 2019 & 2032
- Table 80: Rest of South America Explosion Proof Mobile Communication Devices Market Volume (K Unit) Forecast, by Application 2019 & 2032
- Table 81: Global Explosion Proof Mobile Communication Devices Market Revenue Million Forecast, by Country 2019 & 2032
- Table 82: Global Explosion Proof Mobile Communication Devices Market Volume K Unit Forecast, by Country 2019 & 2032
- Table 83: United States Explosion Proof Mobile Communication Devices Market Revenue (Million) Forecast, by Application 2019 & 2032
- Table 84: United States Explosion Proof Mobile Communication Devices Market Volume (K Unit) Forecast, by Application 2019 & 2032
- Table 85: Canada Explosion Proof Mobile Communication Devices Market Revenue (Million) Forecast, by Application 2019 & 2032
- Table 86: Canada Explosion Proof Mobile Communication Devices Market Volume (K Unit) Forecast, by Application 2019 & 2032
- Table 87: Mexico Explosion Proof Mobile Communication Devices Market Revenue (Million) Forecast, by Application 2019 & 2032
- Table 88: Mexico Explosion Proof Mobile Communication Devices Market Volume (K Unit) Forecast, by Application 2019 & 2032
- Table 89: Global Explosion Proof Mobile Communication Devices Market Revenue Million Forecast, by Country 2019 & 2032
- Table 90: Global Explosion Proof Mobile Communication Devices Market Volume K Unit Forecast, by Country 2019 & 2032
- Table 91: United Arab Emirates Explosion Proof Mobile Communication Devices Market Revenue (Million) Forecast, by Application 2019 & 2032
- Table 92: United Arab Emirates Explosion Proof Mobile Communication Devices Market Volume (K Unit) Forecast, by Application 2019 & 2032
- Table 93: Saudi Arabia Explosion Proof Mobile Communication Devices Market Revenue (Million) Forecast, by Application 2019 & 2032
- Table 94: Saudi Arabia Explosion Proof Mobile Communication Devices Market Volume (K Unit) Forecast, by Application 2019 & 2032
- Table 95: South Africa Explosion Proof Mobile Communication Devices Market Revenue (Million) Forecast, by Application 2019 & 2032
- Table 96: South Africa Explosion Proof Mobile Communication Devices Market Volume (K Unit) Forecast, by Application 2019 & 2032
- Table 97: Rest of Middle East and Africa Explosion Proof Mobile Communication Devices Market Revenue (Million) Forecast, by Application 2019 & 2032
- Table 98: Rest of Middle East and Africa Explosion Proof Mobile Communication Devices Market Volume (K Unit) Forecast, by Application 2019 & 2032
- Table 99: Global Explosion Proof Mobile Communication Devices Market Revenue Million Forecast, by Product 2019 & 2032
- Table 100: Global Explosion Proof Mobile Communication Devices Market Volume K Unit Forecast, by Product 2019 & 2032
- Table 101: Global Explosion Proof Mobile Communication Devices Market Revenue Million Forecast, by End-User Industry 2019 & 2032
- Table 102: Global Explosion Proof Mobile Communication Devices Market Volume K Unit Forecast, by End-User Industry 2019 & 2032
- Table 103: Global Explosion Proof Mobile Communication Devices Market Revenue Million Forecast, by Country 2019 & 2032
- Table 104: Global Explosion Proof Mobile Communication Devices Market Volume K Unit Forecast, by Country 2019 & 2032
- Table 105: Global Explosion Proof Mobile Communication Devices Market Revenue Million Forecast, by Product 2019 & 2032
- Table 106: Global Explosion Proof Mobile Communication Devices Market Volume K Unit Forecast, by Product 2019 & 2032
- Table 107: Global Explosion Proof Mobile Communication Devices Market Revenue Million Forecast, by End-User Industry 2019 & 2032
- Table 108: Global Explosion Proof Mobile Communication Devices Market Volume K Unit Forecast, by End-User Industry 2019 & 2032
- Table 109: Global Explosion Proof Mobile Communication Devices Market Revenue Million Forecast, by Country 2019 & 2032
- Table 110: Global Explosion Proof Mobile Communication Devices Market Volume K Unit Forecast, by Country 2019 & 2032
- Table 111: Global Explosion Proof Mobile Communication Devices Market Revenue Million Forecast, by Product 2019 & 2032
- Table 112: Global Explosion Proof Mobile Communication Devices Market Volume K Unit Forecast, by Product 2019 & 2032
- Table 113: Global Explosion Proof Mobile Communication Devices Market Revenue Million Forecast, by End-User Industry 2019 & 2032
- Table 114: Global Explosion Proof Mobile Communication Devices Market Volume K Unit Forecast, by End-User Industry 2019 & 2032
- Table 115: Global Explosion Proof Mobile Communication Devices Market Revenue Million Forecast, by Country 2019 & 2032
- Table 116: Global Explosion Proof Mobile Communication Devices Market Volume K Unit Forecast, by Country 2019 & 2032
- Table 117: Global Explosion Proof Mobile Communication Devices Market Revenue Million Forecast, by Product 2019 & 2032
- Table 118: Global Explosion Proof Mobile Communication Devices Market Volume K Unit Forecast, by Product 2019 & 2032
- Table 119: Global Explosion Proof Mobile Communication Devices Market Revenue Million Forecast, by End-User Industry 2019 & 2032
- Table 120: Global Explosion Proof Mobile Communication Devices Market Volume K Unit Forecast, by End-User Industry 2019 & 2032
- Table 121: Global Explosion Proof Mobile Communication Devices Market Revenue Million Forecast, by Country 2019 & 2032
- Table 122: Global Explosion Proof Mobile Communication Devices Market Volume K Unit Forecast, by Country 2019 & 2032
- Table 123: Global Explosion Proof Mobile Communication Devices Market Revenue Million Forecast, by Product 2019 & 2032
- Table 124: Global Explosion Proof Mobile Communication Devices Market Volume K Unit Forecast, by Product 2019 & 2032
- Table 125: Global Explosion Proof Mobile Communication Devices Market Revenue Million Forecast, by End-User Industry 2019 & 2032
- Table 126: Global Explosion Proof Mobile Communication Devices Market Volume K Unit Forecast, by End-User Industry 2019 & 2032
- Table 127: Global Explosion Proof Mobile Communication Devices Market Revenue Million Forecast, by Country 2019 & 2032
- Table 128: Global Explosion Proof Mobile Communication Devices Market Volume K Unit Forecast, by Country 2019 & 2032
Frequently Asked Questions
1. What is the projected Compound Annual Growth Rate (CAGR) of the Explosion Proof Mobile Communication Devices Market?
The projected CAGR is approximately 8.56%.
2. Which companies are prominent players in the Explosion Proof Mobile Communication Devices Market?
Key companies in the market include Getac Technology Corporation, Kyocera Corporation, Xciel Inc, Bartec GmbH, I Safe MOBILE GmbH, Caterpillar Inc, Airacom Limited, Sonim Technologies Inc, Aegex Technologies LLC, RugGear, Panasonic Corporation, Zebra Technologies Corporation (Xplore Technologies Corp ).
3. What are the main segments of the Explosion Proof Mobile Communication Devices Market?
The market segments include Product, End-User Industry.
4. Can you provide details about the market size?
The market size is estimated to be USD 660.00 Million as of 2022.
5. What are some drivers contributing to market growth?
; Need for Fast and Seamless Voice. Image. and Data Transfer in Industries; Government Rules and Regulations on the Use of Safe Equipment in Hazardous Places.
6. What are the notable trends driving market growth?
Oil and Gas Industry Expected to Show Significant Growth.
7. Are there any restraints impacting market growth?
; Safety Regulations Vary Across Different Regions.
8. Can you provide examples of recent developments in the market?
N/A
9. What pricing options are available for accessing the report?
Pricing options include single-user, multi-user, and enterprise licenses priced at USD 4750, USD 5250, and USD 8750 respectively.
10. Is the market size provided in terms of value or volume?
The market size is provided in terms of value, measured in Million and volume, measured in K Unit.
11. Are there any specific market keywords associated with the report?
Yes, the market keyword associated with the report is "Explosion Proof Mobile Communication Devices Market," which aids in identifying and referencing the specific market segment covered.
12. How do I determine which pricing option suits my needs best?
The pricing options vary based on user requirements and access needs. Individual users may opt for single-user licenses, while businesses requiring broader access may choose multi-user or enterprise licenses for cost-effective access to the report.
13. Are there any additional resources or data provided in the Explosion Proof Mobile Communication Devices Market report?
While the report offers comprehensive insights, it's advisable to review the specific contents or supplementary materials provided to ascertain if additional resources or data are available.
14. How can I stay updated on further developments or reports in the Explosion Proof Mobile Communication Devices Market?
To stay informed about further developments, trends, and reports in the Explosion Proof Mobile Communication Devices Market, consider subscribing to industry newsletters, following relevant companies and organizations, or regularly checking reputable industry news sources and publications.
Methodology
Step 1 - Identification of Relevant Samples Size from Population Database


Step 2 - Approaches for Defining Global Market Size (Value, Volume* & Price*)

Note*: In applicable scenarios
Step 3 - Data Sources
Primary Research
- Web Analytics
- Survey Reports
- Research Institute
- Latest Research Reports
- Opinion Leaders
Secondary Research
- Annual Reports
- White Paper
- Latest Press Release
- Industry Association
- Paid Database
- Investor Presentations

Step 4 - Data Triangulation
Involves using different sources of information in order to increase the validity of a study
These sources are likely to be stakeholders in a program - participants, other researchers, program staff, other community members, and so on.
Then we put all data in single framework & apply various statistical tools to find out the dynamic on the market.
During the analysis stage, feedback from the stakeholder groups would be compared to determine areas of agreement as well as areas of divergence


