
Key Insights
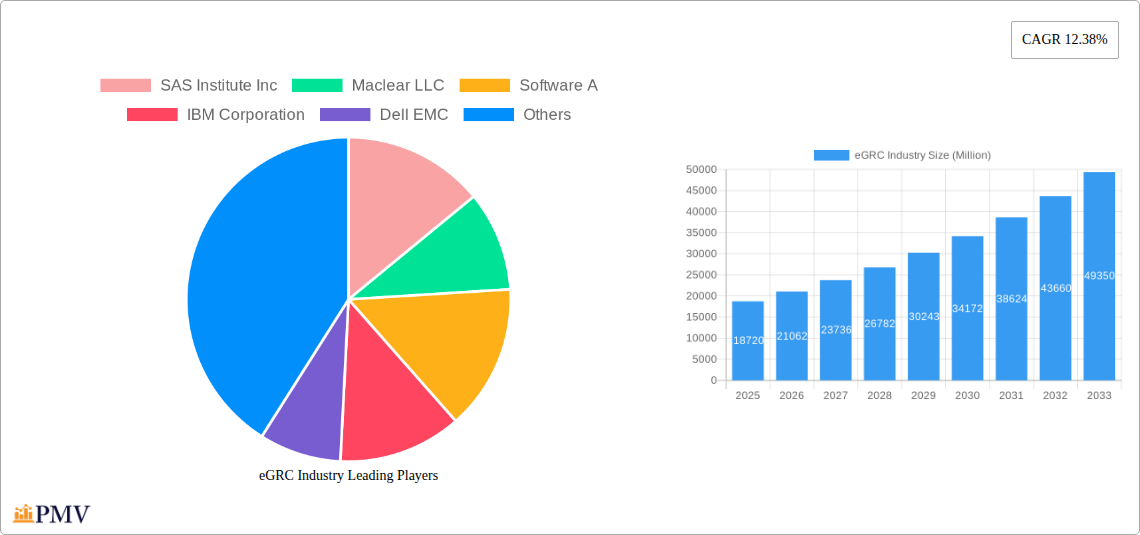
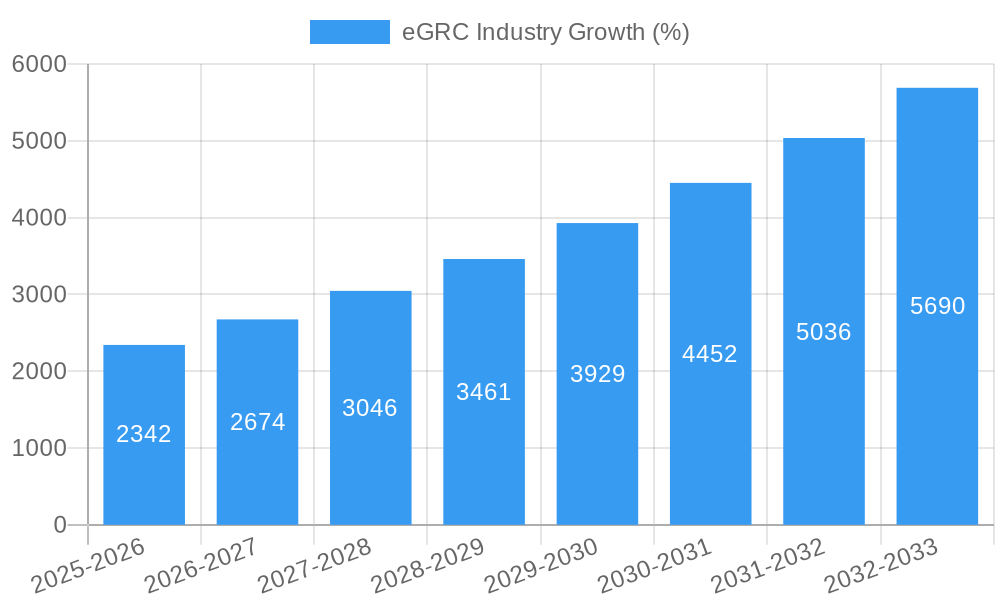
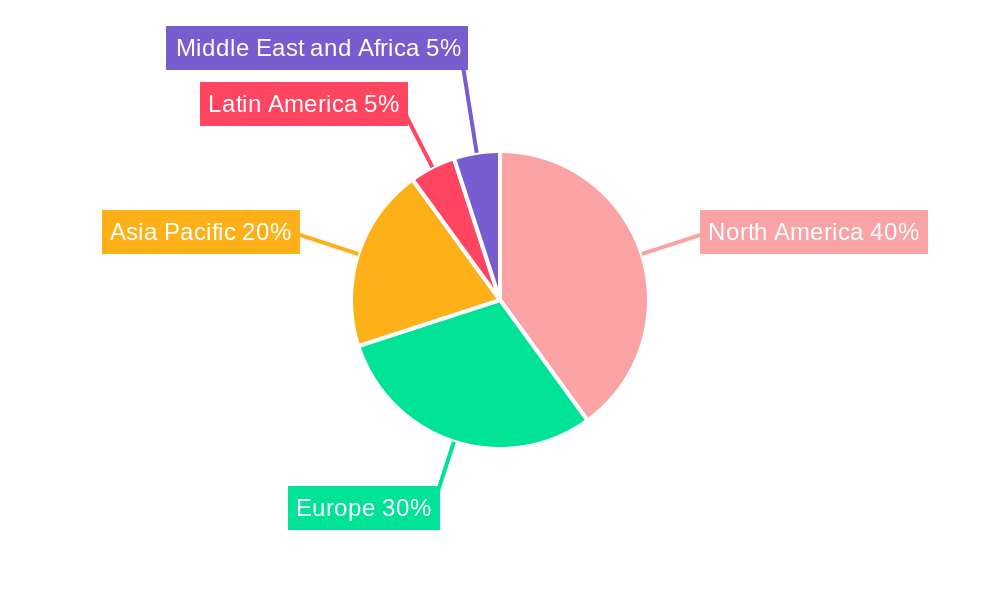
The global Enterprise Governance, Risk, and Compliance (eGRC) market is experiencing robust growth, projected to reach $18.72 billion in 2025 and exhibiting a Compound Annual Growth Rate (CAGR) of 12.38% from 2025 to 2033. This expansion is driven by several key factors. Increasing regulatory scrutiny across various industries, particularly BFSI (Banking, Financial Services, and Insurance), healthcare, and manufacturing, necessitates robust eGRC solutions for compliance and risk mitigation. The rising adoption of cloud-based solutions offers enhanced scalability and accessibility, further fueling market growth. Furthermore, the growing awareness of cybersecurity threats and the need for proactive risk management are compelling organizations of all sizes—from small and medium enterprises (SMEs) to large enterprises—to invest in comprehensive eGRC strategies. The software segment currently dominates the market, offering advanced functionalities and integration capabilities. However, the services segment is also experiencing significant growth, driven by the increasing demand for expert consulting and implementation support. Geographically, North America and Europe currently hold the largest market share, but the Asia-Pacific region is anticipated to witness substantial growth in the coming years due to increasing digitalization and rising adoption of advanced technologies.
The competitive landscape is characterized by a mix of established players like SAS Institute Inc., IBM Corporation, and Oracle Corporation, and specialized eGRC vendors like MetricStream Inc. and Maclear LLC. These companies are constantly innovating to offer advanced solutions encompassing areas like risk assessment, compliance management, and audit management. Future growth will likely depend on the ability of vendors to integrate artificial intelligence (AI) and machine learning (ML) capabilities to enhance risk prediction and automation, thereby offering more sophisticated and efficient solutions to address evolving regulatory requirements and cybersecurity threats. The market will also continue to see consolidation as larger players acquire smaller companies to expand their product portfolios and market reach. The continued focus on data privacy regulations like GDPR and CCPA will further drive demand for robust and compliant eGRC solutions.
eGRC Industry Market Report: 2019-2033 Forecast
This comprehensive report provides a detailed analysis of the Enterprise Governance, Risk, and Compliance (eGRC) industry, offering actionable insights for stakeholders across the value chain. The report covers the period 2019-2033, with a focus on the forecast period 2025-2033 and a base year of 2025. The market is valued at $XX Million in 2025 and is projected to reach $XX Million by 2033, exhibiting a CAGR of XX%. This report includes detailed segmentation by type (Software, Services), enterprise size (Small & Medium Enterprises, Large Enterprises), and end-user industry (BFSI, Healthcare, Manufacturing, IT & Telecom, Other).
eGRC Industry Market Structure & Competitive Dynamics
The eGRC market is characterized by a moderately concentrated structure with several key players holding significant market share. The top 10 companies, including SAS Institute Inc, Maclear LLC, Software A, IBM Corporation, Dell EMC, MetricStream Inc, Wolters Kluwer, Oracle Corporation, Future Shield Inc, and SAP SE, collectively account for approximately XX% of the market. However, the presence of numerous smaller players and ongoing innovation fosters a dynamic competitive landscape.
Market share fluctuations are influenced by factors including product innovation, strategic partnerships, mergers & acquisitions (M&A), and regulatory changes. Significant M&A activity has been observed in recent years, with deals valued at over $XX Million annually. These activities often lead to increased market concentration and reshaping the competitive landscape.
- Market Concentration: High (XX%), driven by leading vendors.
- Innovation Ecosystems: Collaborative, with partnerships impacting product development.
- Regulatory Frameworks: Stringent regulations drive market growth, particularly in BFSI and Healthcare.
- Product Substitutes: Limited; inherent need for robust GRC solutions.
- End-User Trends: Increasing adoption of cloud-based solutions and automation.
- M&A Activity: Significant, impacting market share and competitiveness; average deal value of $XX Million.
eGRC Industry Trends & Insights
The eGRC market is experiencing robust growth, driven by several key factors. The rising frequency and severity of cyberattacks are compelling organizations to enhance their risk management capabilities. Moreover, stringent regulatory compliance requirements across various industries are mandating the implementation of comprehensive eGRC solutions. Technological advancements, such as the adoption of Artificial Intelligence (AI) and Machine Learning (ML) in risk assessment and mitigation, are further fueling market expansion. Increased adoption of cloud-based eGRC solutions is simplifying deployment and improving scalability for enterprises of all sizes. The market penetration of eGRC solutions is expanding, particularly within large enterprises, where complex regulatory compliance and operational risks necessitate robust eGRC frameworks. The preference is shifting towards integrated solutions offering a holistic approach to governance, risk, and compliance. The market is also witnessing an increasing demand for specialized eGRC solutions tailored to specific industry verticals.
Dominant Markets & Segments in eGRC Industry
The North American region dominates the eGRC market, driven by factors such as robust technological infrastructure, high levels of regulatory compliance, and early adoption of advanced technologies. Within the segments:
- Type: Software is the dominant segment, accounting for XX% of the market share, due to its scalability and ease of integration.
- Enterprise Size: Large enterprises contribute the most to the market revenue (XX%), owing to their greater resource allocation for comprehensive risk management.
- End-User Industry: The BFSI sector holds the largest share (XX%), driven by strict regulatory requirements and the increasing need to protect sensitive customer data.
Key Drivers:
- North America: Strong regulatory environment, advanced technological infrastructure, high adoption rates.
- Large Enterprises: Higher budgets, greater need for complex GRC solutions.
- BFSI: Stringent regulatory compliance, need for robust data security.
eGRC Industry Product Innovations
Recent innovations in the eGRC space focus on automating risk assessment and mitigation processes, enhancing data analytics capabilities for better risk visibility, and integrating AI/ML for predictive risk modeling. The market is shifting towards cloud-based, integrated solutions offering a comprehensive view of risk across all organizational functions. This is further complemented by the increasing adoption of mobile-friendly interfaces, thus improving accessibility for end users. These advancements are driving greater market adoption and improving overall efficacy for risk management.
Report Segmentation & Scope
This report segments the eGRC market comprehensively across various parameters:
- By Type: Software and Services, outlining market size and growth projections for each segment. The software segment is characterized by strong competition among established players, while the services segment sees a mix of specialized providers and system integrators.
- By Enterprise Size: Small and Medium Enterprises (SMEs) and Large Enterprises, detailing the unique needs and challenges of each group and their contribution to market size.
- By End-User Industry: BFSI, Healthcare, Manufacturing, IT and Telecom, and Other, focusing on the specific risk profiles and regulatory needs of each sector.
Key Drivers of eGRC Industry Growth
Several factors are driving the growth of the eGRC market: increasing cybersecurity threats, stringent regulatory compliance mandates (e.g., GDPR, CCPA), growing awareness of risk management importance, and advancements in technology such as AI and ML for enhanced risk assessment and mitigation. Economic growth and increasing digital transformation across industries also contribute to this growth.
Challenges in the eGRC Industry Sector
The eGRC industry faces challenges including integrating various GRC systems, data silos that hinder a holistic view of risk, the high cost of implementation and maintenance, and the ongoing need for skilled professionals. Competition is intense, requiring continuous innovation and adaptation to maintain market share. Maintaining data security and ensuring compliance with evolving regulations are ongoing concerns.
Leading Players in the eGRC Industry Market
- SAS Institute Inc
- Maclear LLC
- Software A
- IBM Corporation
- Dell EMC
- MetricStream Inc
- Wolters Kluwer
- Oracle Corporation
- Future Shield Inc
- SAP SE
Key Developments in eGRC Industry Sector
- October 2023: Pathlock launched its new Application Access Governance (AAG) product, enhancing automation in risk and compliance management. This strengthens the competitive landscape by offering improved solutions for application access governance.
- June 2023: Federal bank regulatory agencies issued joint guidance on managing third-party risks, particularly for financial technology companies. This regulatory development emphasizes the importance of robust eGRC solutions in the BFSI sector and drives demand for compliance-focused offerings.
Strategic eGRC Industry Market Outlook
The eGRC market presents significant growth opportunities fueled by rising cyber threats, intensified regulatory pressure, and the accelerating adoption of cloud-based solutions. Strategic partnerships, technological advancements (like AI/ML integration), and expansion into new geographical markets will be crucial for success. Focus on providing specialized solutions for various industry verticals and offering seamless integration with existing enterprise systems will be key differentiators.
eGRC Industry Segmentation
-
1. Type
- 1.1. Software
- 1.2. Services
-
2. Size of the Enterprise
- 2.1. Small and Medium Enterprise
- 2.2. Large Enterprise
-
3. End-User Industry
- 3.1. BFSI
- 3.2. Healthcare
- 3.3. Manufacturing
- 3.4. IT and Telecom
- 3.5. Other End-User Vertical
eGRC Industry Segmentation By Geography
- 1. North America
- 2. Europe
- 3. Asia Pacific
- 4. Latin America
- 5. Middle East and Africa
eGRC Industry REPORT HIGHLIGHTS
| Aspects | Details |
|---|---|
| Study Period | 2019-2033 |
| Base Year | 2024 |
| Estimated Year | 2025 |
| Forecast Period | 2025-2033 |
| Historical Period | 2019-2024 |
| Growth Rate | CAGR of 12.38% from 2019-2033 |
| Segmentation |
|
Table of Contents
- 1. Introduction
- 1.1. Research Scope
- 1.2. Market Segmentation
- 1.3. Research Methodology
- 1.4. Definitions and Assumptions
- 2. Executive Summary
- 2.1. Introduction
- 3. Market Dynamics
- 3.1. Introduction
- 3.2. Market Drivers
- 3.2.1. Stringent Government Regulations and Mandates; Cyber Security Threat Owing to Digitalization
- 3.3. Market Restrains
- 3.3.1. Lack of Awareness
- 3.4. Market Trends
- 3.4.1. Demand from BFSI segment is expected to Witness Significant Growth
- 4. Market Factor Analysis
- 4.1. Porters Five Forces
- 4.2. Supply/Value Chain
- 4.3. PESTEL analysis
- 4.4. Market Entropy
- 4.5. Patent/Trademark Analysis
- 5. Global eGRC Industry Analysis, Insights and Forecast, 2019-2031
- 5.1. Market Analysis, Insights and Forecast - by Type
- 5.1.1. Software
- 5.1.2. Services
- 5.2. Market Analysis, Insights and Forecast - by Size of the Enterprise
- 5.2.1. Small and Medium Enterprise
- 5.2.2. Large Enterprise
- 5.3. Market Analysis, Insights and Forecast - by End-User Industry
- 5.3.1. BFSI
- 5.3.2. Healthcare
- 5.3.3. Manufacturing
- 5.3.4. IT and Telecom
- 5.3.5. Other End-User Vertical
- 5.4. Market Analysis, Insights and Forecast - by Region
- 5.4.1. North America
- 5.4.2. Europe
- 5.4.3. Asia Pacific
- 5.4.4. Latin America
- 5.4.5. Middle East and Africa
- 5.1. Market Analysis, Insights and Forecast - by Type
- 6. North America eGRC Industry Analysis, Insights and Forecast, 2019-2031
- 6.1. Market Analysis, Insights and Forecast - by Type
- 6.1.1. Software
- 6.1.2. Services
- 6.2. Market Analysis, Insights and Forecast - by Size of the Enterprise
- 6.2.1. Small and Medium Enterprise
- 6.2.2. Large Enterprise
- 6.3. Market Analysis, Insights and Forecast - by End-User Industry
- 6.3.1. BFSI
- 6.3.2. Healthcare
- 6.3.3. Manufacturing
- 6.3.4. IT and Telecom
- 6.3.5. Other End-User Vertical
- 6.1. Market Analysis, Insights and Forecast - by Type
- 7. Europe eGRC Industry Analysis, Insights and Forecast, 2019-2031
- 7.1. Market Analysis, Insights and Forecast - by Type
- 7.1.1. Software
- 7.1.2. Services
- 7.2. Market Analysis, Insights and Forecast - by Size of the Enterprise
- 7.2.1. Small and Medium Enterprise
- 7.2.2. Large Enterprise
- 7.3. Market Analysis, Insights and Forecast - by End-User Industry
- 7.3.1. BFSI
- 7.3.2. Healthcare
- 7.3.3. Manufacturing
- 7.3.4. IT and Telecom
- 7.3.5. Other End-User Vertical
- 7.1. Market Analysis, Insights and Forecast - by Type
- 8. Asia Pacific eGRC Industry Analysis, Insights and Forecast, 2019-2031
- 8.1. Market Analysis, Insights and Forecast - by Type
- 8.1.1. Software
- 8.1.2. Services
- 8.2. Market Analysis, Insights and Forecast - by Size of the Enterprise
- 8.2.1. Small and Medium Enterprise
- 8.2.2. Large Enterprise
- 8.3. Market Analysis, Insights and Forecast - by End-User Industry
- 8.3.1. BFSI
- 8.3.2. Healthcare
- 8.3.3. Manufacturing
- 8.3.4. IT and Telecom
- 8.3.5. Other End-User Vertical
- 8.1. Market Analysis, Insights and Forecast - by Type
- 9. Latin America eGRC Industry Analysis, Insights and Forecast, 2019-2031
- 9.1. Market Analysis, Insights and Forecast - by Type
- 9.1.1. Software
- 9.1.2. Services
- 9.2. Market Analysis, Insights and Forecast - by Size of the Enterprise
- 9.2.1. Small and Medium Enterprise
- 9.2.2. Large Enterprise
- 9.3. Market Analysis, Insights and Forecast - by End-User Industry
- 9.3.1. BFSI
- 9.3.2. Healthcare
- 9.3.3. Manufacturing
- 9.3.4. IT and Telecom
- 9.3.5. Other End-User Vertical
- 9.1. Market Analysis, Insights and Forecast - by Type
- 10. Middle East and Africa eGRC Industry Analysis, Insights and Forecast, 2019-2031
- 10.1. Market Analysis, Insights and Forecast - by Type
- 10.1.1. Software
- 10.1.2. Services
- 10.2. Market Analysis, Insights and Forecast - by Size of the Enterprise
- 10.2.1. Small and Medium Enterprise
- 10.2.2. Large Enterprise
- 10.3. Market Analysis, Insights and Forecast - by End-User Industry
- 10.3.1. BFSI
- 10.3.2. Healthcare
- 10.3.3. Manufacturing
- 10.3.4. IT and Telecom
- 10.3.5. Other End-User Vertical
- 10.1. Market Analysis, Insights and Forecast - by Type
- 11. North America eGRC Industry Analysis, Insights and Forecast, 2019-2031
- 11.1. Market Analysis, Insights and Forecast - By Country/Sub-region
- 11.1.1.
- 12. Europe eGRC Industry Analysis, Insights and Forecast, 2019-2031
- 12.1. Market Analysis, Insights and Forecast - By Country/Sub-region
- 12.1.1.
- 13. Asia Pacific eGRC Industry Analysis, Insights and Forecast, 2019-2031
- 13.1. Market Analysis, Insights and Forecast - By Country/Sub-region
- 13.1.1.
- 14. Latin America eGRC Industry Analysis, Insights and Forecast, 2019-2031
- 14.1. Market Analysis, Insights and Forecast - By Country/Sub-region
- 14.1.1.
- 15. Middle East and Africa eGRC Industry Analysis, Insights and Forecast, 2019-2031
- 15.1. Market Analysis, Insights and Forecast - By Country/Sub-region
- 15.1.1.
- 16. Competitive Analysis
- 16.1. Global Market Share Analysis 2024
- 16.2. Company Profiles
- 16.2.1 SAS Institute Inc
- 16.2.1.1. Overview
- 16.2.1.2. Products
- 16.2.1.3. SWOT Analysis
- 16.2.1.4. Recent Developments
- 16.2.1.5. Financials (Based on Availability)
- 16.2.2 Maclear LLC
- 16.2.2.1. Overview
- 16.2.2.2. Products
- 16.2.2.3. SWOT Analysis
- 16.2.2.4. Recent Developments
- 16.2.2.5. Financials (Based on Availability)
- 16.2.3 Software A
- 16.2.3.1. Overview
- 16.2.3.2. Products
- 16.2.3.3. SWOT Analysis
- 16.2.3.4. Recent Developments
- 16.2.3.5. Financials (Based on Availability)
- 16.2.4 IBM Corporation
- 16.2.4.1. Overview
- 16.2.4.2. Products
- 16.2.4.3. SWOT Analysis
- 16.2.4.4. Recent Developments
- 16.2.4.5. Financials (Based on Availability)
- 16.2.5 Dell EMC
- 16.2.5.1. Overview
- 16.2.5.2. Products
- 16.2.5.3. SWOT Analysis
- 16.2.5.4. Recent Developments
- 16.2.5.5. Financials (Based on Availability)
- 16.2.6 MetricStream Inc
- 16.2.6.1. Overview
- 16.2.6.2. Products
- 16.2.6.3. SWOT Analysis
- 16.2.6.4. Recent Developments
- 16.2.6.5. Financials (Based on Availability)
- 16.2.7 Wolters Kluwer
- 16.2.7.1. Overview
- 16.2.7.2. Products
- 16.2.7.3. SWOT Analysis
- 16.2.7.4. Recent Developments
- 16.2.7.5. Financials (Based on Availability)
- 16.2.8 Oracle Corporation
- 16.2.8.1. Overview
- 16.2.8.2. Products
- 16.2.8.3. SWOT Analysis
- 16.2.8.4. Recent Developments
- 16.2.8.5. Financials (Based on Availability)
- 16.2.9 Future Shield Inc
- 16.2.9.1. Overview
- 16.2.9.2. Products
- 16.2.9.3. SWOT Analysis
- 16.2.9.4. Recent Developments
- 16.2.9.5. Financials (Based on Availability)
- 16.2.10 SAP SE
- 16.2.10.1. Overview
- 16.2.10.2. Products
- 16.2.10.3. SWOT Analysis
- 16.2.10.4. Recent Developments
- 16.2.10.5. Financials (Based on Availability)
- 16.2.1 SAS Institute Inc
List of Figures
- Figure 1: Global eGRC Industry Revenue Breakdown (Million, %) by Region 2024 & 2032
- Figure 2: North America eGRC Industry Revenue (Million), by Country 2024 & 2032
- Figure 3: North America eGRC Industry Revenue Share (%), by Country 2024 & 2032
- Figure 4: Europe eGRC Industry Revenue (Million), by Country 2024 & 2032
- Figure 5: Europe eGRC Industry Revenue Share (%), by Country 2024 & 2032
- Figure 6: Asia Pacific eGRC Industry Revenue (Million), by Country 2024 & 2032
- Figure 7: Asia Pacific eGRC Industry Revenue Share (%), by Country 2024 & 2032
- Figure 8: Latin America eGRC Industry Revenue (Million), by Country 2024 & 2032
- Figure 9: Latin America eGRC Industry Revenue Share (%), by Country 2024 & 2032
- Figure 10: Middle East and Africa eGRC Industry Revenue (Million), by Country 2024 & 2032
- Figure 11: Middle East and Africa eGRC Industry Revenue Share (%), by Country 2024 & 2032
- Figure 12: North America eGRC Industry Revenue (Million), by Type 2024 & 2032
- Figure 13: North America eGRC Industry Revenue Share (%), by Type 2024 & 2032
- Figure 14: North America eGRC Industry Revenue (Million), by Size of the Enterprise 2024 & 2032
- Figure 15: North America eGRC Industry Revenue Share (%), by Size of the Enterprise 2024 & 2032
- Figure 16: North America eGRC Industry Revenue (Million), by End-User Industry 2024 & 2032
- Figure 17: North America eGRC Industry Revenue Share (%), by End-User Industry 2024 & 2032
- Figure 18: North America eGRC Industry Revenue (Million), by Country 2024 & 2032
- Figure 19: North America eGRC Industry Revenue Share (%), by Country 2024 & 2032
- Figure 20: Europe eGRC Industry Revenue (Million), by Type 2024 & 2032
- Figure 21: Europe eGRC Industry Revenue Share (%), by Type 2024 & 2032
- Figure 22: Europe eGRC Industry Revenue (Million), by Size of the Enterprise 2024 & 2032
- Figure 23: Europe eGRC Industry Revenue Share (%), by Size of the Enterprise 2024 & 2032
- Figure 24: Europe eGRC Industry Revenue (Million), by End-User Industry 2024 & 2032
- Figure 25: Europe eGRC Industry Revenue Share (%), by End-User Industry 2024 & 2032
- Figure 26: Europe eGRC Industry Revenue (Million), by Country 2024 & 2032
- Figure 27: Europe eGRC Industry Revenue Share (%), by Country 2024 & 2032
- Figure 28: Asia Pacific eGRC Industry Revenue (Million), by Type 2024 & 2032
- Figure 29: Asia Pacific eGRC Industry Revenue Share (%), by Type 2024 & 2032
- Figure 30: Asia Pacific eGRC Industry Revenue (Million), by Size of the Enterprise 2024 & 2032
- Figure 31: Asia Pacific eGRC Industry Revenue Share (%), by Size of the Enterprise 2024 & 2032
- Figure 32: Asia Pacific eGRC Industry Revenue (Million), by End-User Industry 2024 & 2032
- Figure 33: Asia Pacific eGRC Industry Revenue Share (%), by End-User Industry 2024 & 2032
- Figure 34: Asia Pacific eGRC Industry Revenue (Million), by Country 2024 & 2032
- Figure 35: Asia Pacific eGRC Industry Revenue Share (%), by Country 2024 & 2032
- Figure 36: Latin America eGRC Industry Revenue (Million), by Type 2024 & 2032
- Figure 37: Latin America eGRC Industry Revenue Share (%), by Type 2024 & 2032
- Figure 38: Latin America eGRC Industry Revenue (Million), by Size of the Enterprise 2024 & 2032
- Figure 39: Latin America eGRC Industry Revenue Share (%), by Size of the Enterprise 2024 & 2032
- Figure 40: Latin America eGRC Industry Revenue (Million), by End-User Industry 2024 & 2032
- Figure 41: Latin America eGRC Industry Revenue Share (%), by End-User Industry 2024 & 2032
- Figure 42: Latin America eGRC Industry Revenue (Million), by Country 2024 & 2032
- Figure 43: Latin America eGRC Industry Revenue Share (%), by Country 2024 & 2032
- Figure 44: Middle East and Africa eGRC Industry Revenue (Million), by Type 2024 & 2032
- Figure 45: Middle East and Africa eGRC Industry Revenue Share (%), by Type 2024 & 2032
- Figure 46: Middle East and Africa eGRC Industry Revenue (Million), by Size of the Enterprise 2024 & 2032
- Figure 47: Middle East and Africa eGRC Industry Revenue Share (%), by Size of the Enterprise 2024 & 2032
- Figure 48: Middle East and Africa eGRC Industry Revenue (Million), by End-User Industry 2024 & 2032
- Figure 49: Middle East and Africa eGRC Industry Revenue Share (%), by End-User Industry 2024 & 2032
- Figure 50: Middle East and Africa eGRC Industry Revenue (Million), by Country 2024 & 2032
- Figure 51: Middle East and Africa eGRC Industry Revenue Share (%), by Country 2024 & 2032
List of Tables
- Table 1: Global eGRC Industry Revenue Million Forecast, by Region 2019 & 2032
- Table 2: Global eGRC Industry Revenue Million Forecast, by Type 2019 & 2032
- Table 3: Global eGRC Industry Revenue Million Forecast, by Size of the Enterprise 2019 & 2032
- Table 4: Global eGRC Industry Revenue Million Forecast, by End-User Industry 2019 & 2032
- Table 5: Global eGRC Industry Revenue Million Forecast, by Region 2019 & 2032
- Table 6: Global eGRC Industry Revenue Million Forecast, by Country 2019 & 2032
- Table 7: eGRC Industry Revenue (Million) Forecast, by Application 2019 & 2032
- Table 8: Global eGRC Industry Revenue Million Forecast, by Country 2019 & 2032
- Table 9: eGRC Industry Revenue (Million) Forecast, by Application 2019 & 2032
- Table 10: Global eGRC Industry Revenue Million Forecast, by Country 2019 & 2032
- Table 11: eGRC Industry Revenue (Million) Forecast, by Application 2019 & 2032
- Table 12: Global eGRC Industry Revenue Million Forecast, by Country 2019 & 2032
- Table 13: eGRC Industry Revenue (Million) Forecast, by Application 2019 & 2032
- Table 14: Global eGRC Industry Revenue Million Forecast, by Country 2019 & 2032
- Table 15: eGRC Industry Revenue (Million) Forecast, by Application 2019 & 2032
- Table 16: Global eGRC Industry Revenue Million Forecast, by Type 2019 & 2032
- Table 17: Global eGRC Industry Revenue Million Forecast, by Size of the Enterprise 2019 & 2032
- Table 18: Global eGRC Industry Revenue Million Forecast, by End-User Industry 2019 & 2032
- Table 19: Global eGRC Industry Revenue Million Forecast, by Country 2019 & 2032
- Table 20: Global eGRC Industry Revenue Million Forecast, by Type 2019 & 2032
- Table 21: Global eGRC Industry Revenue Million Forecast, by Size of the Enterprise 2019 & 2032
- Table 22: Global eGRC Industry Revenue Million Forecast, by End-User Industry 2019 & 2032
- Table 23: Global eGRC Industry Revenue Million Forecast, by Country 2019 & 2032
- Table 24: Global eGRC Industry Revenue Million Forecast, by Type 2019 & 2032
- Table 25: Global eGRC Industry Revenue Million Forecast, by Size of the Enterprise 2019 & 2032
- Table 26: Global eGRC Industry Revenue Million Forecast, by End-User Industry 2019 & 2032
- Table 27: Global eGRC Industry Revenue Million Forecast, by Country 2019 & 2032
- Table 28: Global eGRC Industry Revenue Million Forecast, by Type 2019 & 2032
- Table 29: Global eGRC Industry Revenue Million Forecast, by Size of the Enterprise 2019 & 2032
- Table 30: Global eGRC Industry Revenue Million Forecast, by End-User Industry 2019 & 2032
- Table 31: Global eGRC Industry Revenue Million Forecast, by Country 2019 & 2032
- Table 32: Global eGRC Industry Revenue Million Forecast, by Type 2019 & 2032
- Table 33: Global eGRC Industry Revenue Million Forecast, by Size of the Enterprise 2019 & 2032
- Table 34: Global eGRC Industry Revenue Million Forecast, by End-User Industry 2019 & 2032
- Table 35: Global eGRC Industry Revenue Million Forecast, by Country 2019 & 2032
Frequently Asked Questions
1. What is the projected Compound Annual Growth Rate (CAGR) of the eGRC Industry?
The projected CAGR is approximately 12.38%.
2. Which companies are prominent players in the eGRC Industry?
Key companies in the market include SAS Institute Inc, Maclear LLC, Software A, IBM Corporation, Dell EMC, MetricStream Inc, Wolters Kluwer, Oracle Corporation, Future Shield Inc, SAP SE.
3. What are the main segments of the eGRC Industry?
The market segments include Type, Size of the Enterprise, End-User Industry.
4. Can you provide details about the market size?
The market size is estimated to be USD 18.72 Million as of 2022.
5. What are some drivers contributing to market growth?
Stringent Government Regulations and Mandates; Cyber Security Threat Owing to Digitalization.
6. What are the notable trends driving market growth?
Demand from BFSI segment is expected to Witness Significant Growth.
7. Are there any restraints impacting market growth?
Lack of Awareness.
8. Can you provide examples of recent developments in the market?
October 2023 - Pathlock, the provider of application governance, risk, and compliance (GRC), launched a new release of its Application Access Governance (AAG) product within the company's risk and compliance platform, Pathlock Cloud. It is mainly a risk and compliance management platform that automates the controls testing and enforcement for various business applications and enterprise resource planning (ERP). ThePathlock AAG also automates the broad majority of manual processes needed to minimize the risks associated with application access throughout critical business systems.
9. What pricing options are available for accessing the report?
Pricing options include single-user, multi-user, and enterprise licenses priced at USD 4750, USD 5250, and USD 8750 respectively.
10. Is the market size provided in terms of value or volume?
The market size is provided in terms of value, measured in Million.
11. Are there any specific market keywords associated with the report?
Yes, the market keyword associated with the report is "eGRC Industry," which aids in identifying and referencing the specific market segment covered.
12. How do I determine which pricing option suits my needs best?
The pricing options vary based on user requirements and access needs. Individual users may opt for single-user licenses, while businesses requiring broader access may choose multi-user or enterprise licenses for cost-effective access to the report.
13. Are there any additional resources or data provided in the eGRC Industry report?
While the report offers comprehensive insights, it's advisable to review the specific contents or supplementary materials provided to ascertain if additional resources or data are available.
14. How can I stay updated on further developments or reports in the eGRC Industry?
To stay informed about further developments, trends, and reports in the eGRC Industry, consider subscribing to industry newsletters, following relevant companies and organizations, or regularly checking reputable industry news sources and publications.
Methodology
Step 1 - Identification of Relevant Samples Size from Population Database


Step 2 - Approaches for Defining Global Market Size (Value, Volume* & Price*)

Note*: In applicable scenarios
Step 3 - Data Sources
Primary Research
- Web Analytics
- Survey Reports
- Research Institute
- Latest Research Reports
- Opinion Leaders
Secondary Research
- Annual Reports
- White Paper
- Latest Press Release
- Industry Association
- Paid Database
- Investor Presentations

Step 4 - Data Triangulation
Involves using different sources of information in order to increase the validity of a study
These sources are likely to be stakeholders in a program - participants, other researchers, program staff, other community members, and so on.
Then we put all data in single framework & apply various statistical tools to find out the dynamic on the market.
During the analysis stage, feedback from the stakeholder groups would be compared to determine areas of agreement as well as areas of divergence


