
Key Insights
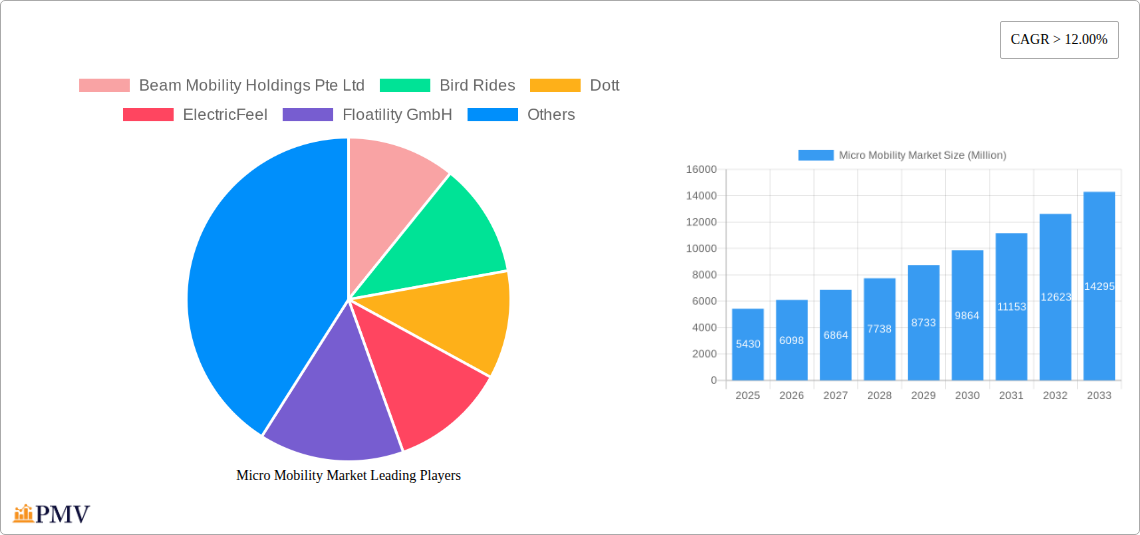
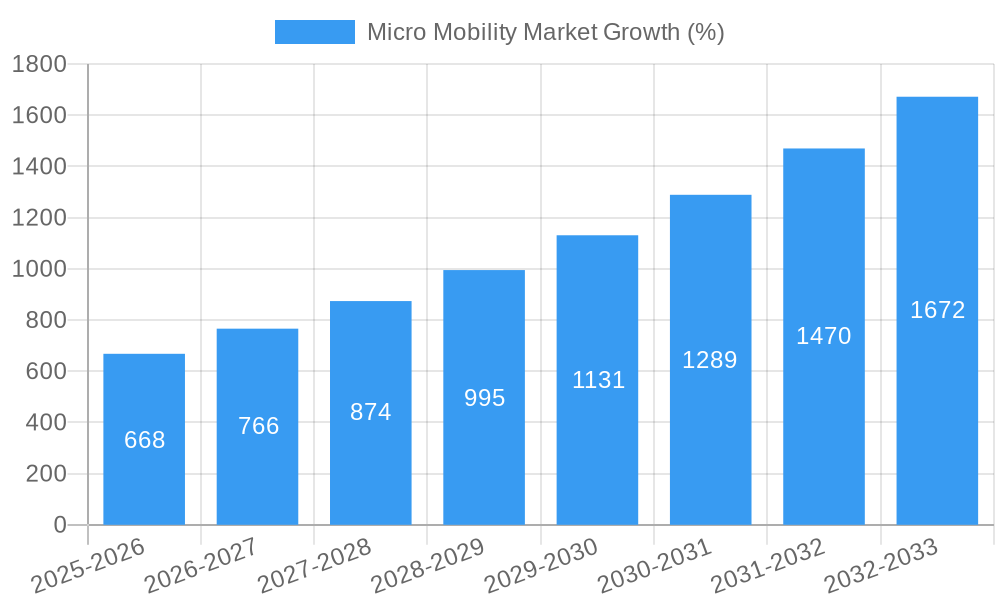
The micro-mobility market, encompassing shared e-scooters, e-bikes, and other similar personal electric vehicles, is experiencing robust growth. With a 2025 market size of $5.43 billion and a Compound Annual Growth Rate (CAGR) exceeding 12%, the market is projected to reach significant scale by 2033. This expansion is driven by several factors, including increasing urbanization and traffic congestion in major cities globally, a growing preference for sustainable and eco-friendly transportation options, and the increasing affordability and accessibility of micro-mobility vehicles. Government initiatives promoting sustainable transport and the integration of micro-mobility solutions into existing public transit systems are further fueling market growth. Technological advancements, such as improved battery technology leading to longer ranges and faster charging times, and the development of smarter, more user-friendly applications for vehicle access and management, contribute to the market's dynamism.
However, the market also faces challenges. Regulatory hurdles, including licensing requirements, parking regulations, and safety concerns related to rider behavior and infrastructure, pose significant restraints. Competition among numerous players, including both established companies like Lime and Bird, and emerging startups, is intense, leading to price wars and pressure on profitability. Furthermore, seasonal variations in demand and potential safety issues, such as accidents and theft, require careful management to sustain market growth. The successful companies will likely be those that effectively navigate regulatory landscapes, build strong partnerships with cities, and focus on technological innovation to offer safer and more reliable services. The geographic distribution of market share will largely depend on the adoption rates in various regions, driven by factors such as urban density, public transport infrastructure, and government policies.
Micro Mobility Market: A Comprehensive Report (2019-2033)
This in-depth report provides a comprehensive analysis of the global Micro Mobility Market, offering invaluable insights for stakeholders across the industry. With a study period spanning 2019-2033, a base year of 2025, and a forecast period of 2025-2033, this report offers a detailed understanding of historical trends (2019-2024) and future projections. The market is segmented by various factors, and leading players like Beam Mobility Holdings Pte Ltd, Bird Rides, Dott, ElectricFeel, Floatility GmbH, Lime, Yulu Bikes Pvt Ltd, Voi, and Superpedestrian Inc. are analyzed in detail. The report’s quantitative data is presented in Millions (USD).
Micro Mobility Market Market Structure & Competitive Dynamics
The micro-mobility market is characterized by a dynamic competitive landscape with varying degrees of market concentration across different regions. While some areas show dominance by a few key players, others exhibit a more fragmented structure. The market is highly susceptible to technological innovation, with companies constantly striving for differentiation through improved battery technology, enhanced safety features, and smart connectivity options. Regulatory frameworks play a significant role, influencing operational costs and market access, often varying significantly between countries and cities. The emergence of alternative transportation solutions, such as improved public transit and ride-sharing services, acts as a constraint. End-user trends, heavily influenced by factors like environmental concerns and urban congestion, continue to shape the demand for micro-mobility options. Mergers and acquisitions (M&A) are common, with larger players strategically acquiring smaller companies to expand their geographical footprint and technological capabilities. For instance, the acquisition of Spin by Bird Rides in 2023 signifies the consolidation happening in the sector. Estimates indicate a total M&A deal value of approximately xx Million in 2024. Market share analysis reveals that the top 5 players collectively hold approximately xx% of the global market share.
Micro Mobility Market Industry Trends & Insights
The micro-mobility market is witnessing robust growth, driven by several key factors. The increasing urbanization and traffic congestion in major cities are fueling the demand for convenient and eco-friendly transportation alternatives. Technological advancements, particularly in battery technology and smart features, are improving the user experience and extending the range of e-scooters and e-bikes, further boosting adoption. Consumer preferences are increasingly shifting towards shared mobility solutions, promoting the popularity of rental services. The CAGR for the micro-mobility market during the forecast period (2025-2033) is estimated to be xx%. Market penetration is also expected to grow significantly, reaching an estimated xx% by 2033. However, competitive dynamics remain intense, with companies continuously innovating to improve their offerings and gain market share. Challenges remain, such as regulatory hurdles and safety concerns, that need to be addressed to ensure sustainable market growth.
Dominant Markets & Segments in Micro Mobility Market
The North American market currently holds a dominant position within the global micro-mobility landscape, driven by factors such as high consumer adoption rates and supportive regulatory environments in certain cities. Europe also exhibits significant market potential, though regulatory frameworks vary considerably across countries. Key drivers for market dominance include:
- Favorable Government Policies: Several regions have implemented policies promoting the use of sustainable transportation solutions, such as tax breaks or dedicated lanes for e-scooters.
- Developed Urban Infrastructure: Well-developed public transport networks and cycling infrastructure often complement the use of micro-mobility vehicles, increasing their appeal.
- High Smartphone Penetration: The widespread adoption of smartphones facilitates seamless access to micro-mobility rental services, enhancing convenience.
However, significant growth is also anticipated in Asia-Pacific regions, particularly in densely populated urban centers with burgeoning middle classes. While the e-scooter segment currently holds the largest market share, e-bikes are also witnessing strong growth due to their wider applicability and longer range. A detailed analysis reveals that the North American region contributed approximately xx Million to the market in 2024, projected to reach xx Million by 2033.
Micro Mobility Market Product Innovations
Recent innovations in the micro-mobility sector include advancements in battery technology resulting in extended ranges and faster charging times. Smart features like integrated GPS tracking, anti-theft systems, and improved braking mechanisms are enhancing safety and user experience. Companies are also exploring innovative designs, such as foldable e-scooters and e-bikes for improved portability and storage. The integration of smart features offers competitive advantages, enabling companies to collect data on usage patterns to optimize fleet management and improve service delivery.
Report Segmentation & Scope
This report segments the micro-mobility market by vehicle type (e-scooters, e-bikes, e-skateboards), rental model (shared, owned), and geography (North America, Europe, Asia-Pacific, etc.). Growth projections vary across segments, with e-scooters maintaining a dominant position but e-bikes experiencing rapid growth due to their practical advantages and longer-range capabilities. Shared rental models continue to drive market growth, as they cater to the growing preference for on-demand transportation solutions.
Key Drivers of Micro Mobility Market Growth
Technological advancements, particularly in battery technology and smart features, are a major driver. Favorable government policies promoting sustainable transportation and easing regulatory hurdles also contribute significantly. Urbanization and traffic congestion are also factors, driving demand for efficient, eco-friendly alternatives to cars. The growth of the sharing economy, with its focus on convenient, on-demand services, is also a key driver.
Challenges in the Micro Mobility Market Sector
Regulatory uncertainty and varying regulations across different cities and countries present significant challenges. Concerns around rider safety and accidents are also impacting market growth. Supply chain issues, particularly concerning battery components, can affect production and availability. Intense competition also puts pressure on profit margins and necessitates continuous innovation. The estimated impact of regulatory hurdles on market growth in 2024 was approximately xx Million.
Leading Players in the Micro Mobility Market Market
- Beam Mobility Holdings Pte Ltd
- Bird Rides
- Dott
- ElectricFeel
- Floatility GmbH
- Lime
- Yulu Bikes Pvt Ltd
- Voi
- Superpedestrian Inc
Key Developments in Micro Mobility Market Sector
- March 2023: Voi Technology secured an additional USD 22.8 Million in funding to expand its e-scooter services across Europe.
- September 2023: Bird Rides acquired Spin from Tier Mobility for USD 19 Million, expanding its market presence.
Strategic Micro Mobility Market Market Outlook
The micro-mobility market is poised for significant growth in the coming years, driven by continued technological advancements, supportive government policies, and increasing urbanization. Strategic opportunities exist for companies that can effectively navigate regulatory landscapes, innovate to meet evolving consumer preferences, and establish efficient fleet management systems. The market's future hinges on addressing safety concerns and fostering sustainable practices within the industry.
Micro Mobility Market Segmentation
-
1. Vehicle Type
- 1.1. Electric Kick Scooters
- 1.2. Electric Mopeds
- 1.3. Electric Bicycles
-
2. Battery
- 2.1. Sealed Lead Acid
- 2.2. NiMH
- 2.3. Li-ion
-
3. Voltage
- 3.1. Below 24V
- 3.2. 36V
- 3.3. 48V
- 3.4. Greater than 48V
-
4. Sharing Type
- 4.1. Docked
- 4.2. Dockless
Micro Mobility Market Segmentation By Geography
-
1. North America
- 1.1. United States
- 1.2. Canada
- 1.3. Rest of North America
-
2. Europe
- 2.1. Germany
- 2.2. United Kingdom
- 2.3. France
- 2.4. Italy
- 2.5. Spain
- 2.6. Rest of Europe
-
3. Asia Pacific
- 3.1. China
- 3.2. Japan
- 3.3. India
- 3.4. South Korea
- 3.5. Rest of Asia Pacific
-
4. Rest of the World
- 4.1. South America
- 4.2. Middle East and Africa

Micro Mobility Market REPORT HIGHLIGHTS
| Aspects | Details |
|---|---|
| Study Period | 2019-2033 |
| Base Year | 2024 |
| Estimated Year | 2025 |
| Forecast Period | 2025-2033 |
| Historical Period | 2019-2024 |
| Growth Rate | CAGR of > 12.00% from 2019-2033 |
| Segmentation |
|
Table of Contents
- 1. Introduction
- 1.1. Research Scope
- 1.2. Market Segmentation
- 1.3. Research Methodology
- 1.4. Definitions and Assumptions
- 2. Executive Summary
- 2.1. Introduction
- 3. Market Dynamics
- 3.1. Introduction
- 3.2. Market Drivers
- 3.2.1. Increasing Urban Congestion and a Shift Toward Sustainable Transportation Solutions to Drive Market Growth
- 3.3. Market Restrains
- 3.3.1. Increasing Urban Congestion and a Shift Toward Sustainable Transportation Solutions to Drive Market Growth
- 3.4. Market Trends
- 3.4.1. Docked Micromobility Paving the Way for Sustainable Urban Transportation
- 4. Market Factor Analysis
- 4.1. Porters Five Forces
- 4.2. Supply/Value Chain
- 4.3. PESTEL analysis
- 4.4. Market Entropy
- 4.5. Patent/Trademark Analysis
- 5. Global Micro Mobility Market Analysis, Insights and Forecast, 2019-2031
- 5.1. Market Analysis, Insights and Forecast - by Vehicle Type
- 5.1.1. Electric Kick Scooters
- 5.1.2. Electric Mopeds
- 5.1.3. Electric Bicycles
- 5.2. Market Analysis, Insights and Forecast - by Battery
- 5.2.1. Sealed Lead Acid
- 5.2.2. NiMH
- 5.2.3. Li-ion
- 5.3. Market Analysis, Insights and Forecast - by Voltage
- 5.3.1. Below 24V
- 5.3.2. 36V
- 5.3.3. 48V
- 5.3.4. Greater than 48V
- 5.4. Market Analysis, Insights and Forecast - by Sharing Type
- 5.4.1. Docked
- 5.4.2. Dockless
- 5.5. Market Analysis, Insights and Forecast - by Region
- 5.5.1. North America
- 5.5.2. Europe
- 5.5.3. Asia Pacific
- 5.5.4. Rest of the World
- 5.1. Market Analysis, Insights and Forecast - by Vehicle Type
- 6. North America Micro Mobility Market Analysis, Insights and Forecast, 2019-2031
- 6.1. Market Analysis, Insights and Forecast - by Vehicle Type
- 6.1.1. Electric Kick Scooters
- 6.1.2. Electric Mopeds
- 6.1.3. Electric Bicycles
- 6.2. Market Analysis, Insights and Forecast - by Battery
- 6.2.1. Sealed Lead Acid
- 6.2.2. NiMH
- 6.2.3. Li-ion
- 6.3. Market Analysis, Insights and Forecast - by Voltage
- 6.3.1. Below 24V
- 6.3.2. 36V
- 6.3.3. 48V
- 6.3.4. Greater than 48V
- 6.4. Market Analysis, Insights and Forecast - by Sharing Type
- 6.4.1. Docked
- 6.4.2. Dockless
- 6.1. Market Analysis, Insights and Forecast - by Vehicle Type
- 7. Europe Micro Mobility Market Analysis, Insights and Forecast, 2019-2031
- 7.1. Market Analysis, Insights and Forecast - by Vehicle Type
- 7.1.1. Electric Kick Scooters
- 7.1.2. Electric Mopeds
- 7.1.3. Electric Bicycles
- 7.2. Market Analysis, Insights and Forecast - by Battery
- 7.2.1. Sealed Lead Acid
- 7.2.2. NiMH
- 7.2.3. Li-ion
- 7.3. Market Analysis, Insights and Forecast - by Voltage
- 7.3.1. Below 24V
- 7.3.2. 36V
- 7.3.3. 48V
- 7.3.4. Greater than 48V
- 7.4. Market Analysis, Insights and Forecast - by Sharing Type
- 7.4.1. Docked
- 7.4.2. Dockless
- 7.1. Market Analysis, Insights and Forecast - by Vehicle Type
- 8. Asia Pacific Micro Mobility Market Analysis, Insights and Forecast, 2019-2031
- 8.1. Market Analysis, Insights and Forecast - by Vehicle Type
- 8.1.1. Electric Kick Scooters
- 8.1.2. Electric Mopeds
- 8.1.3. Electric Bicycles
- 8.2. Market Analysis, Insights and Forecast - by Battery
- 8.2.1. Sealed Lead Acid
- 8.2.2. NiMH
- 8.2.3. Li-ion
- 8.3. Market Analysis, Insights and Forecast - by Voltage
- 8.3.1. Below 24V
- 8.3.2. 36V
- 8.3.3. 48V
- 8.3.4. Greater than 48V
- 8.4. Market Analysis, Insights and Forecast - by Sharing Type
- 8.4.1. Docked
- 8.4.2. Dockless
- 8.1. Market Analysis, Insights and Forecast - by Vehicle Type
- 9. Rest of the World Micro Mobility Market Analysis, Insights and Forecast, 2019-2031
- 9.1. Market Analysis, Insights and Forecast - by Vehicle Type
- 9.1.1. Electric Kick Scooters
- 9.1.2. Electric Mopeds
- 9.1.3. Electric Bicycles
- 9.2. Market Analysis, Insights and Forecast - by Battery
- 9.2.1. Sealed Lead Acid
- 9.2.2. NiMH
- 9.2.3. Li-ion
- 9.3. Market Analysis, Insights and Forecast - by Voltage
- 9.3.1. Below 24V
- 9.3.2. 36V
- 9.3.3. 48V
- 9.3.4. Greater than 48V
- 9.4. Market Analysis, Insights and Forecast - by Sharing Type
- 9.4.1. Docked
- 9.4.2. Dockless
- 9.1. Market Analysis, Insights and Forecast - by Vehicle Type
- 10. Competitive Analysis
- 10.1. Global Market Share Analysis 2024
- 10.2. Company Profiles
- 10.2.1 Beam Mobility Holdings Pte Ltd
- 10.2.1.1. Overview
- 10.2.1.2. Products
- 10.2.1.3. SWOT Analysis
- 10.2.1.4. Recent Developments
- 10.2.1.5. Financials (Based on Availability)
- 10.2.2 Bird Rides
- 10.2.2.1. Overview
- 10.2.2.2. Products
- 10.2.2.3. SWOT Analysis
- 10.2.2.4. Recent Developments
- 10.2.2.5. Financials (Based on Availability)
- 10.2.3 Dott
- 10.2.3.1. Overview
- 10.2.3.2. Products
- 10.2.3.3. SWOT Analysis
- 10.2.3.4. Recent Developments
- 10.2.3.5. Financials (Based on Availability)
- 10.2.4 ElectricFeel
- 10.2.4.1. Overview
- 10.2.4.2. Products
- 10.2.4.3. SWOT Analysis
- 10.2.4.4. Recent Developments
- 10.2.4.5. Financials (Based on Availability)
- 10.2.5 Floatility GmbH
- 10.2.5.1. Overview
- 10.2.5.2. Products
- 10.2.5.3. SWOT Analysis
- 10.2.5.4. Recent Developments
- 10.2.5.5. Financials (Based on Availability)
- 10.2.6 Lime
- 10.2.6.1. Overview
- 10.2.6.2. Products
- 10.2.6.3. SWOT Analysis
- 10.2.6.4. Recent Developments
- 10.2.6.5. Financials (Based on Availability)
- 10.2.7 Yulu Bikes Pvt Ltd
- 10.2.7.1. Overview
- 10.2.7.2. Products
- 10.2.7.3. SWOT Analysis
- 10.2.7.4. Recent Developments
- 10.2.7.5. Financials (Based on Availability)
- 10.2.8 Voi
- 10.2.8.1. Overview
- 10.2.8.2. Products
- 10.2.8.3. SWOT Analysis
- 10.2.8.4. Recent Developments
- 10.2.8.5. Financials (Based on Availability)
- 10.2.9 Superpedestrian Inc
- 10.2.9.1. Overview
- 10.2.9.2. Products
- 10.2.9.3. SWOT Analysis
- 10.2.9.4. Recent Developments
- 10.2.9.5. Financials (Based on Availability)
- 10.2.1 Beam Mobility Holdings Pte Ltd
List of Figures
- Figure 1: Global Micro Mobility Market Revenue Breakdown (Million, %) by Region 2024 & 2032
- Figure 2: Global Micro Mobility Market Volume Breakdown (Billion, %) by Region 2024 & 2032
- Figure 3: North America Micro Mobility Market Revenue (Million), by Vehicle Type 2024 & 2032
- Figure 4: North America Micro Mobility Market Volume (Billion), by Vehicle Type 2024 & 2032
- Figure 5: North America Micro Mobility Market Revenue Share (%), by Vehicle Type 2024 & 2032
- Figure 6: North America Micro Mobility Market Volume Share (%), by Vehicle Type 2024 & 2032
- Figure 7: North America Micro Mobility Market Revenue (Million), by Battery 2024 & 2032
- Figure 8: North America Micro Mobility Market Volume (Billion), by Battery 2024 & 2032
- Figure 9: North America Micro Mobility Market Revenue Share (%), by Battery 2024 & 2032
- Figure 10: North America Micro Mobility Market Volume Share (%), by Battery 2024 & 2032
- Figure 11: North America Micro Mobility Market Revenue (Million), by Voltage 2024 & 2032
- Figure 12: North America Micro Mobility Market Volume (Billion), by Voltage 2024 & 2032
- Figure 13: North America Micro Mobility Market Revenue Share (%), by Voltage 2024 & 2032
- Figure 14: North America Micro Mobility Market Volume Share (%), by Voltage 2024 & 2032
- Figure 15: North America Micro Mobility Market Revenue (Million), by Sharing Type 2024 & 2032
- Figure 16: North America Micro Mobility Market Volume (Billion), by Sharing Type 2024 & 2032
- Figure 17: North America Micro Mobility Market Revenue Share (%), by Sharing Type 2024 & 2032
- Figure 18: North America Micro Mobility Market Volume Share (%), by Sharing Type 2024 & 2032
- Figure 19: North America Micro Mobility Market Revenue (Million), by Country 2024 & 2032
- Figure 20: North America Micro Mobility Market Volume (Billion), by Country 2024 & 2032
- Figure 21: North America Micro Mobility Market Revenue Share (%), by Country 2024 & 2032
- Figure 22: North America Micro Mobility Market Volume Share (%), by Country 2024 & 2032
- Figure 23: Europe Micro Mobility Market Revenue (Million), by Vehicle Type 2024 & 2032
- Figure 24: Europe Micro Mobility Market Volume (Billion), by Vehicle Type 2024 & 2032
- Figure 25: Europe Micro Mobility Market Revenue Share (%), by Vehicle Type 2024 & 2032
- Figure 26: Europe Micro Mobility Market Volume Share (%), by Vehicle Type 2024 & 2032
- Figure 27: Europe Micro Mobility Market Revenue (Million), by Battery 2024 & 2032
- Figure 28: Europe Micro Mobility Market Volume (Billion), by Battery 2024 & 2032
- Figure 29: Europe Micro Mobility Market Revenue Share (%), by Battery 2024 & 2032
- Figure 30: Europe Micro Mobility Market Volume Share (%), by Battery 2024 & 2032
- Figure 31: Europe Micro Mobility Market Revenue (Million), by Voltage 2024 & 2032
- Figure 32: Europe Micro Mobility Market Volume (Billion), by Voltage 2024 & 2032
- Figure 33: Europe Micro Mobility Market Revenue Share (%), by Voltage 2024 & 2032
- Figure 34: Europe Micro Mobility Market Volume Share (%), by Voltage 2024 & 2032
- Figure 35: Europe Micro Mobility Market Revenue (Million), by Sharing Type 2024 & 2032
- Figure 36: Europe Micro Mobility Market Volume (Billion), by Sharing Type 2024 & 2032
- Figure 37: Europe Micro Mobility Market Revenue Share (%), by Sharing Type 2024 & 2032
- Figure 38: Europe Micro Mobility Market Volume Share (%), by Sharing Type 2024 & 2032
- Figure 39: Europe Micro Mobility Market Revenue (Million), by Country 2024 & 2032
- Figure 40: Europe Micro Mobility Market Volume (Billion), by Country 2024 & 2032
- Figure 41: Europe Micro Mobility Market Revenue Share (%), by Country 2024 & 2032
- Figure 42: Europe Micro Mobility Market Volume Share (%), by Country 2024 & 2032
- Figure 43: Asia Pacific Micro Mobility Market Revenue (Million), by Vehicle Type 2024 & 2032
- Figure 44: Asia Pacific Micro Mobility Market Volume (Billion), by Vehicle Type 2024 & 2032
- Figure 45: Asia Pacific Micro Mobility Market Revenue Share (%), by Vehicle Type 2024 & 2032
- Figure 46: Asia Pacific Micro Mobility Market Volume Share (%), by Vehicle Type 2024 & 2032
- Figure 47: Asia Pacific Micro Mobility Market Revenue (Million), by Battery 2024 & 2032
- Figure 48: Asia Pacific Micro Mobility Market Volume (Billion), by Battery 2024 & 2032
- Figure 49: Asia Pacific Micro Mobility Market Revenue Share (%), by Battery 2024 & 2032
- Figure 50: Asia Pacific Micro Mobility Market Volume Share (%), by Battery 2024 & 2032
- Figure 51: Asia Pacific Micro Mobility Market Revenue (Million), by Voltage 2024 & 2032
- Figure 52: Asia Pacific Micro Mobility Market Volume (Billion), by Voltage 2024 & 2032
- Figure 53: Asia Pacific Micro Mobility Market Revenue Share (%), by Voltage 2024 & 2032
- Figure 54: Asia Pacific Micro Mobility Market Volume Share (%), by Voltage 2024 & 2032
- Figure 55: Asia Pacific Micro Mobility Market Revenue (Million), by Sharing Type 2024 & 2032
- Figure 56: Asia Pacific Micro Mobility Market Volume (Billion), by Sharing Type 2024 & 2032
- Figure 57: Asia Pacific Micro Mobility Market Revenue Share (%), by Sharing Type 2024 & 2032
- Figure 58: Asia Pacific Micro Mobility Market Volume Share (%), by Sharing Type 2024 & 2032
- Figure 59: Asia Pacific Micro Mobility Market Revenue (Million), by Country 2024 & 2032
- Figure 60: Asia Pacific Micro Mobility Market Volume (Billion), by Country 2024 & 2032
- Figure 61: Asia Pacific Micro Mobility Market Revenue Share (%), by Country 2024 & 2032
- Figure 62: Asia Pacific Micro Mobility Market Volume Share (%), by Country 2024 & 2032
- Figure 63: Rest of the World Micro Mobility Market Revenue (Million), by Vehicle Type 2024 & 2032
- Figure 64: Rest of the World Micro Mobility Market Volume (Billion), by Vehicle Type 2024 & 2032
- Figure 65: Rest of the World Micro Mobility Market Revenue Share (%), by Vehicle Type 2024 & 2032
- Figure 66: Rest of the World Micro Mobility Market Volume Share (%), by Vehicle Type 2024 & 2032
- Figure 67: Rest of the World Micro Mobility Market Revenue (Million), by Battery 2024 & 2032
- Figure 68: Rest of the World Micro Mobility Market Volume (Billion), by Battery 2024 & 2032
- Figure 69: Rest of the World Micro Mobility Market Revenue Share (%), by Battery 2024 & 2032
- Figure 70: Rest of the World Micro Mobility Market Volume Share (%), by Battery 2024 & 2032
- Figure 71: Rest of the World Micro Mobility Market Revenue (Million), by Voltage 2024 & 2032
- Figure 72: Rest of the World Micro Mobility Market Volume (Billion), by Voltage 2024 & 2032
- Figure 73: Rest of the World Micro Mobility Market Revenue Share (%), by Voltage 2024 & 2032
- Figure 74: Rest of the World Micro Mobility Market Volume Share (%), by Voltage 2024 & 2032
- Figure 75: Rest of the World Micro Mobility Market Revenue (Million), by Sharing Type 2024 & 2032
- Figure 76: Rest of the World Micro Mobility Market Volume (Billion), by Sharing Type 2024 & 2032
- Figure 77: Rest of the World Micro Mobility Market Revenue Share (%), by Sharing Type 2024 & 2032
- Figure 78: Rest of the World Micro Mobility Market Volume Share (%), by Sharing Type 2024 & 2032
- Figure 79: Rest of the World Micro Mobility Market Revenue (Million), by Country 2024 & 2032
- Figure 80: Rest of the World Micro Mobility Market Volume (Billion), by Country 2024 & 2032
- Figure 81: Rest of the World Micro Mobility Market Revenue Share (%), by Country 2024 & 2032
- Figure 82: Rest of the World Micro Mobility Market Volume Share (%), by Country 2024 & 2032
List of Tables
- Table 1: Global Micro Mobility Market Revenue Million Forecast, by Region 2019 & 2032
- Table 2: Global Micro Mobility Market Volume Billion Forecast, by Region 2019 & 2032
- Table 3: Global Micro Mobility Market Revenue Million Forecast, by Vehicle Type 2019 & 2032
- Table 4: Global Micro Mobility Market Volume Billion Forecast, by Vehicle Type 2019 & 2032
- Table 5: Global Micro Mobility Market Revenue Million Forecast, by Battery 2019 & 2032
- Table 6: Global Micro Mobility Market Volume Billion Forecast, by Battery 2019 & 2032
- Table 7: Global Micro Mobility Market Revenue Million Forecast, by Voltage 2019 & 2032
- Table 8: Global Micro Mobility Market Volume Billion Forecast, by Voltage 2019 & 2032
- Table 9: Global Micro Mobility Market Revenue Million Forecast, by Sharing Type 2019 & 2032
- Table 10: Global Micro Mobility Market Volume Billion Forecast, by Sharing Type 2019 & 2032
- Table 11: Global Micro Mobility Market Revenue Million Forecast, by Region 2019 & 2032
- Table 12: Global Micro Mobility Market Volume Billion Forecast, by Region 2019 & 2032
- Table 13: Global Micro Mobility Market Revenue Million Forecast, by Vehicle Type 2019 & 2032
- Table 14: Global Micro Mobility Market Volume Billion Forecast, by Vehicle Type 2019 & 2032
- Table 15: Global Micro Mobility Market Revenue Million Forecast, by Battery 2019 & 2032
- Table 16: Global Micro Mobility Market Volume Billion Forecast, by Battery 2019 & 2032
- Table 17: Global Micro Mobility Market Revenue Million Forecast, by Voltage 2019 & 2032
- Table 18: Global Micro Mobility Market Volume Billion Forecast, by Voltage 2019 & 2032
- Table 19: Global Micro Mobility Market Revenue Million Forecast, by Sharing Type 2019 & 2032
- Table 20: Global Micro Mobility Market Volume Billion Forecast, by Sharing Type 2019 & 2032
- Table 21: Global Micro Mobility Market Revenue Million Forecast, by Country 2019 & 2032
- Table 22: Global Micro Mobility Market Volume Billion Forecast, by Country 2019 & 2032
- Table 23: United States Micro Mobility Market Revenue (Million) Forecast, by Application 2019 & 2032
- Table 24: United States Micro Mobility Market Volume (Billion) Forecast, by Application 2019 & 2032
- Table 25: Canada Micro Mobility Market Revenue (Million) Forecast, by Application 2019 & 2032
- Table 26: Canada Micro Mobility Market Volume (Billion) Forecast, by Application 2019 & 2032
- Table 27: Rest of North America Micro Mobility Market Revenue (Million) Forecast, by Application 2019 & 2032
- Table 28: Rest of North America Micro Mobility Market Volume (Billion) Forecast, by Application 2019 & 2032
- Table 29: Global Micro Mobility Market Revenue Million Forecast, by Vehicle Type 2019 & 2032
- Table 30: Global Micro Mobility Market Volume Billion Forecast, by Vehicle Type 2019 & 2032
- Table 31: Global Micro Mobility Market Revenue Million Forecast, by Battery 2019 & 2032
- Table 32: Global Micro Mobility Market Volume Billion Forecast, by Battery 2019 & 2032
- Table 33: Global Micro Mobility Market Revenue Million Forecast, by Voltage 2019 & 2032
- Table 34: Global Micro Mobility Market Volume Billion Forecast, by Voltage 2019 & 2032
- Table 35: Global Micro Mobility Market Revenue Million Forecast, by Sharing Type 2019 & 2032
- Table 36: Global Micro Mobility Market Volume Billion Forecast, by Sharing Type 2019 & 2032
- Table 37: Global Micro Mobility Market Revenue Million Forecast, by Country 2019 & 2032
- Table 38: Global Micro Mobility Market Volume Billion Forecast, by Country 2019 & 2032
- Table 39: Germany Micro Mobility Market Revenue (Million) Forecast, by Application 2019 & 2032
- Table 40: Germany Micro Mobility Market Volume (Billion) Forecast, by Application 2019 & 2032
- Table 41: United Kingdom Micro Mobility Market Revenue (Million) Forecast, by Application 2019 & 2032
- Table 42: United Kingdom Micro Mobility Market Volume (Billion) Forecast, by Application 2019 & 2032
- Table 43: France Micro Mobility Market Revenue (Million) Forecast, by Application 2019 & 2032
- Table 44: France Micro Mobility Market Volume (Billion) Forecast, by Application 2019 & 2032
- Table 45: Italy Micro Mobility Market Revenue (Million) Forecast, by Application 2019 & 2032
- Table 46: Italy Micro Mobility Market Volume (Billion) Forecast, by Application 2019 & 2032
- Table 47: Spain Micro Mobility Market Revenue (Million) Forecast, by Application 2019 & 2032
- Table 48: Spain Micro Mobility Market Volume (Billion) Forecast, by Application 2019 & 2032
- Table 49: Rest of Europe Micro Mobility Market Revenue (Million) Forecast, by Application 2019 & 2032
- Table 50: Rest of Europe Micro Mobility Market Volume (Billion) Forecast, by Application 2019 & 2032
- Table 51: Global Micro Mobility Market Revenue Million Forecast, by Vehicle Type 2019 & 2032
- Table 52: Global Micro Mobility Market Volume Billion Forecast, by Vehicle Type 2019 & 2032
- Table 53: Global Micro Mobility Market Revenue Million Forecast, by Battery 2019 & 2032
- Table 54: Global Micro Mobility Market Volume Billion Forecast, by Battery 2019 & 2032
- Table 55: Global Micro Mobility Market Revenue Million Forecast, by Voltage 2019 & 2032
- Table 56: Global Micro Mobility Market Volume Billion Forecast, by Voltage 2019 & 2032
- Table 57: Global Micro Mobility Market Revenue Million Forecast, by Sharing Type 2019 & 2032
- Table 58: Global Micro Mobility Market Volume Billion Forecast, by Sharing Type 2019 & 2032
- Table 59: Global Micro Mobility Market Revenue Million Forecast, by Country 2019 & 2032
- Table 60: Global Micro Mobility Market Volume Billion Forecast, by Country 2019 & 2032
- Table 61: China Micro Mobility Market Revenue (Million) Forecast, by Application 2019 & 2032
- Table 62: China Micro Mobility Market Volume (Billion) Forecast, by Application 2019 & 2032
- Table 63: Japan Micro Mobility Market Revenue (Million) Forecast, by Application 2019 & 2032
- Table 64: Japan Micro Mobility Market Volume (Billion) Forecast, by Application 2019 & 2032
- Table 65: India Micro Mobility Market Revenue (Million) Forecast, by Application 2019 & 2032
- Table 66: India Micro Mobility Market Volume (Billion) Forecast, by Application 2019 & 2032
- Table 67: South Korea Micro Mobility Market Revenue (Million) Forecast, by Application 2019 & 2032
- Table 68: South Korea Micro Mobility Market Volume (Billion) Forecast, by Application 2019 & 2032
- Table 69: Rest of Asia Pacific Micro Mobility Market Revenue (Million) Forecast, by Application 2019 & 2032
- Table 70: Rest of Asia Pacific Micro Mobility Market Volume (Billion) Forecast, by Application 2019 & 2032
- Table 71: Global Micro Mobility Market Revenue Million Forecast, by Vehicle Type 2019 & 2032
- Table 72: Global Micro Mobility Market Volume Billion Forecast, by Vehicle Type 2019 & 2032
- Table 73: Global Micro Mobility Market Revenue Million Forecast, by Battery 2019 & 2032
- Table 74: Global Micro Mobility Market Volume Billion Forecast, by Battery 2019 & 2032
- Table 75: Global Micro Mobility Market Revenue Million Forecast, by Voltage 2019 & 2032
- Table 76: Global Micro Mobility Market Volume Billion Forecast, by Voltage 2019 & 2032
- Table 77: Global Micro Mobility Market Revenue Million Forecast, by Sharing Type 2019 & 2032
- Table 78: Global Micro Mobility Market Volume Billion Forecast, by Sharing Type 2019 & 2032
- Table 79: Global Micro Mobility Market Revenue Million Forecast, by Country 2019 & 2032
- Table 80: Global Micro Mobility Market Volume Billion Forecast, by Country 2019 & 2032
- Table 81: South America Micro Mobility Market Revenue (Million) Forecast, by Application 2019 & 2032
- Table 82: South America Micro Mobility Market Volume (Billion) Forecast, by Application 2019 & 2032
- Table 83: Middle East and Africa Micro Mobility Market Revenue (Million) Forecast, by Application 2019 & 2032
- Table 84: Middle East and Africa Micro Mobility Market Volume (Billion) Forecast, by Application 2019 & 2032
Frequently Asked Questions
1. What is the projected Compound Annual Growth Rate (CAGR) of the Micro Mobility Market?
The projected CAGR is approximately > 12.00%.
2. Which companies are prominent players in the Micro Mobility Market?
Key companies in the market include Beam Mobility Holdings Pte Ltd, Bird Rides, Dott, ElectricFeel, Floatility GmbH, Lime, Yulu Bikes Pvt Ltd, Voi, Superpedestrian Inc.
3. What are the main segments of the Micro Mobility Market?
The market segments include Vehicle Type, Battery, Voltage, Sharing Type.
4. Can you provide details about the market size?
The market size is estimated to be USD 5.43 Million as of 2022.
5. What are some drivers contributing to market growth?
Increasing Urban Congestion and a Shift Toward Sustainable Transportation Solutions to Drive Market Growth.
6. What are the notable trends driving market growth?
Docked Micromobility Paving the Way for Sustainable Urban Transportation.
7. Are there any restraints impacting market growth?
Increasing Urban Congestion and a Shift Toward Sustainable Transportation Solutions to Drive Market Growth.
8. Can you provide examples of recent developments in the market?
March 2023: Voi Technology secured an additional USD 22.8 million in funding to extend its e-scooter services across Europe. This investment will support Voi's plan to increase its fleet and enhance its offerings in urban mobility solutions.
9. What pricing options are available for accessing the report?
Pricing options include single-user, multi-user, and enterprise licenses priced at USD 4750, USD 5250, and USD 8750 respectively.
10. Is the market size provided in terms of value or volume?
The market size is provided in terms of value, measured in Million and volume, measured in Billion.
11. Are there any specific market keywords associated with the report?
Yes, the market keyword associated with the report is "Micro Mobility Market," which aids in identifying and referencing the specific market segment covered.
12. How do I determine which pricing option suits my needs best?
The pricing options vary based on user requirements and access needs. Individual users may opt for single-user licenses, while businesses requiring broader access may choose multi-user or enterprise licenses for cost-effective access to the report.
13. Are there any additional resources or data provided in the Micro Mobility Market report?
While the report offers comprehensive insights, it's advisable to review the specific contents or supplementary materials provided to ascertain if additional resources or data are available.
14. How can I stay updated on further developments or reports in the Micro Mobility Market?
To stay informed about further developments, trends, and reports in the Micro Mobility Market, consider subscribing to industry newsletters, following relevant companies and organizations, or regularly checking reputable industry news sources and publications.
Methodology
Step 1 - Identification of Relevant Samples Size from Population Database


Step 2 - Approaches for Defining Global Market Size (Value, Volume* & Price*)

Note*: In applicable scenarios
Step 3 - Data Sources
Primary Research
- Web Analytics
- Survey Reports
- Research Institute
- Latest Research Reports
- Opinion Leaders
Secondary Research
- Annual Reports
- White Paper
- Latest Press Release
- Industry Association
- Paid Database
- Investor Presentations

Step 4 - Data Triangulation
Involves using different sources of information in order to increase the validity of a study
These sources are likely to be stakeholders in a program - participants, other researchers, program staff, other community members, and so on.
Then we put all data in single framework & apply various statistical tools to find out the dynamic on the market.
During the analysis stage, feedback from the stakeholder groups would be compared to determine areas of agreement as well as areas of divergence


