
Key Insights
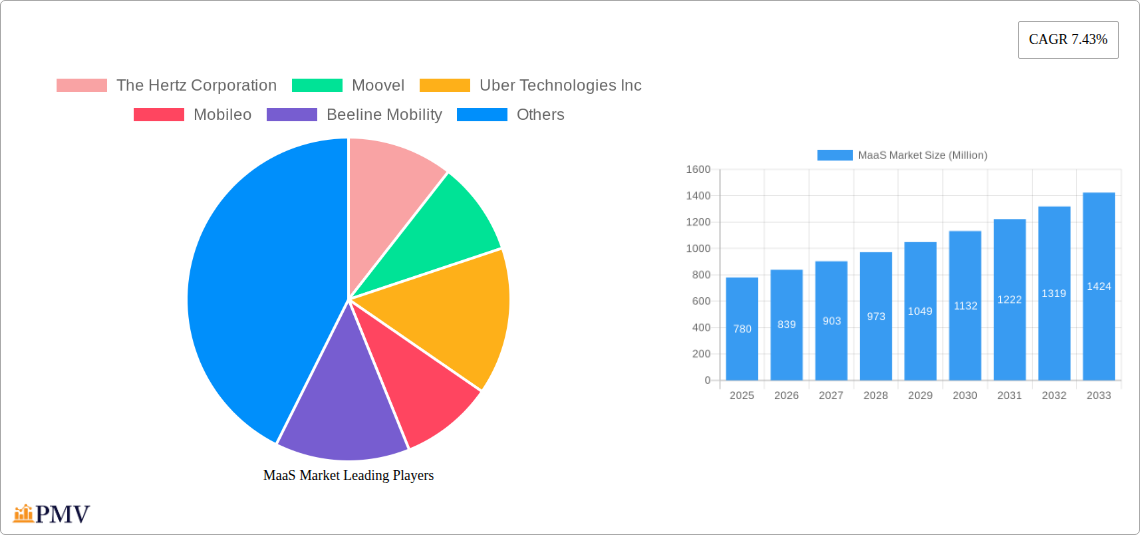
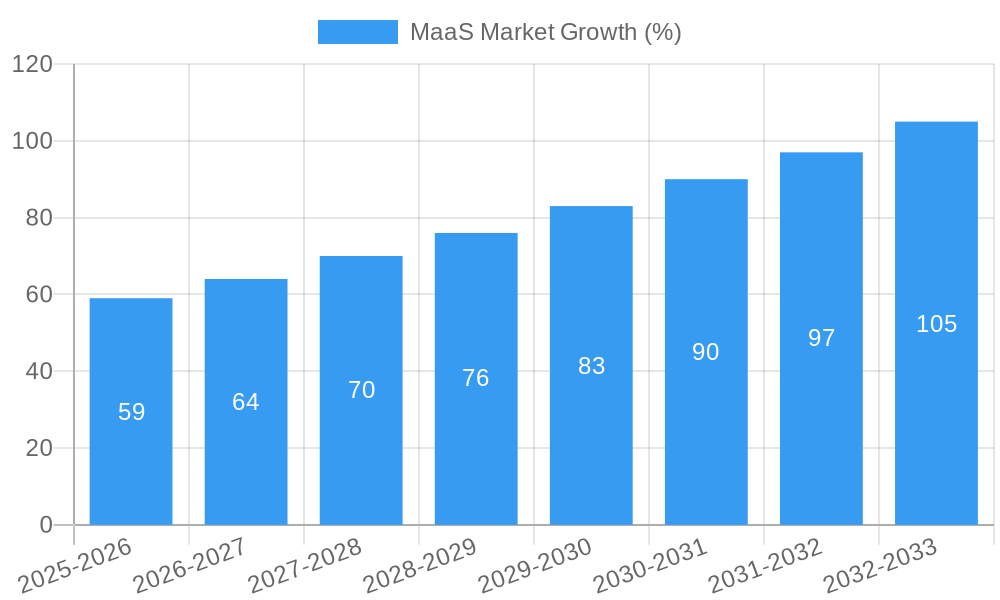
The Mobility as a Service (MaaS) market, valued at $0.78 billion in 2025, is projected to experience robust growth, driven by increasing urbanization, rising fuel costs, and growing environmental concerns. The 7.43% CAGR signifies a considerable expansion throughout the forecast period (2025-2033). Key drivers include the increasing adoption of smartphones and mobile applications facilitating seamless integration of various transportation modes, the expanding availability of high-speed internet, and the development of sophisticated data analytics and artificial intelligence powering optimized routing and personalized travel solutions. Furthermore, the rise in demand for efficient and integrated public transportation networks, coupled with government initiatives promoting sustainable mobility, further propels market growth. Segmentation reveals significant opportunities across service types (car, bus, bike) and transportation types (public, private), with private MaaS solutions currently dominating but experiencing significant competition from increasingly sophisticated public transit integrations. Major players like Uber, Hertz, and others are constantly innovating, creating a dynamic and competitive landscape. Geographic analysis shows strong growth in North America and Europe, although the Asia-Pacific region is expected to witness substantial expansion in the coming years due to rapid urbanization and technological advancements. The restraints to growth include issues surrounding data privacy, the integration of diverse transportation systems and the need for robust technological infrastructure.
The MaaS market presents significant opportunities for companies focused on innovation and collaboration. Successful market entrants will need to prioritize seamless user experiences, robust data security, and strategic partnerships with both public and private transportation providers. Technological advancements, especially in areas like autonomous vehicles and smart city initiatives, are expected to further revolutionize the MaaS landscape. Future success will rely on agility, responsiveness to evolving user preferences, and a proactive approach to addressing regulatory and technological challenges. Focusing on sustainable mobility solutions will attract investors and customers increasingly conscious of environmental impact. Ultimately, the MaaS market is positioned for sustained growth, fueled by evolving consumer demands and the integration of innovative technologies.
MaaS Market: A Comprehensive Report (2019-2033)
This detailed report provides a comprehensive analysis of the Mobility as a Service (MaaS) market, covering its structure, competitive landscape, industry trends, and future outlook. The study period spans from 2019 to 2033, with a base year of 2025 and a forecast period from 2025 to 2033. The report leverages extensive data from the historical period (2019-2024) to provide accurate and insightful predictions. The report segments the MaaS market by service type (car, bus, bike) and transportation type (public, private), offering granular insights into market dynamics and growth opportunities. Key players like Uber Technologies Inc, The Hertz Corporation, and Moovit Inc are analyzed for their market strategies and contributions to the evolving MaaS ecosystem.
MaaS Market Structure & Competitive Dynamics
The MaaS market exhibits a dynamic competitive landscape characterized by a mix of established players and emerging startups. Market concentration is currently moderate, with a few dominant players holding significant market share, while numerous smaller companies compete in niche segments. The industry's innovation ecosystem is vibrant, with continuous advancements in technology, service offerings, and business models. Regulatory frameworks vary across regions, influencing market access and operations. Product substitutes, such as traditional transportation modes, pose ongoing competitive pressure. End-user trends, including increasing demand for integrated and seamless mobility solutions, are shaping market growth. M&A activities have been noteworthy, with deal values exceeding xx Million in recent years, primarily driven by companies seeking to expand their service portfolios and geographic reach.
- Market Share: Uber Technologies Inc. holds an estimated xx% market share, followed by The Hertz Corporation with xx%, and Avis Budget Group with xx%. Other key players collectively account for the remaining xx%. These figures are subject to variation based on the specific geographic area and service type.
- M&A Activity: Recent mergers and acquisitions have focused on consolidating market share and expanding service offerings, with total deal values exceeding xx Million during the period of 2021-2024.
MaaS Market Industry Trends & Insights
The MaaS market is experiencing robust growth, driven by several key factors. Technological advancements, including the development of sophisticated mobile applications, real-time data analytics, and improved payment systems, are significantly enhancing user experience and expanding service capabilities. Consumer preferences are shifting towards convenient, integrated, and cost-effective mobility options, fueling demand for MaaS solutions. The increasing urbanization and the associated challenges of traffic congestion and parking scarcity are driving the adoption of MaaS services. Competitive dynamics are intense, with companies investing heavily in innovation and expansion to gain market share. The market's Compound Annual Growth Rate (CAGR) is projected to be xx% during the forecast period (2025-2033), with market penetration expected to reach xx% by 2033. This growth is being driven by increased smartphone penetration, rising disposable incomes, and government support for sustainable transportation initiatives.
Dominant Markets & Segments in MaaS Market
North America currently holds the largest market share within the MaaS sector, driven by factors including high smartphone penetration, well-developed public transportation infrastructure in certain areas, and a robust technology sector. Within service types, the car segment dominates, reflecting the existing preference for private vehicle usage and the high adaptability of car-sharing and ride-hailing models. In the transportation type segment, the private transportation market currently holds a significant portion of the overall MaaS market.
- Key Drivers of North American Dominance:
- High Smartphone Penetration: Facilitates easy access and adoption of MaaS apps.
- Advanced Technological Infrastructure: Supports the development and deployment of MaaS solutions.
- Strong Venture Capital Investment: Funds innovation and market expansion.
- Key Drivers within Car Service Type:
- Established Ride-Hailing Industry: Creates a strong foundation for MaaS expansion.
- High Vehicle Ownership Rates: Facilitates integration with personal vehicle use.
- Strong Consumer Preference: Maintains a high demand for private transport.
- Key Drivers within Private Transportation Type:
- Convenience and Flexibility: Consumers highly value the freedom offered by private transport.
- High Demand for On-Demand Services: Fuels the growth of ride-hailing and car-sharing options.
- Integration with Personal Vehicles: Expands the appeal to a broader customer base.
MaaS Market Product Innovations
Recent product innovations in the MaaS market focus on enhancing user experience, integrating various transportation modes, and improving data analytics capabilities. Companies are developing sophisticated mobile applications with intuitive interfaces, real-time information on service availability, and seamless payment systems. The integration of multiple transportation modes (e.g., public transit, ride-sharing, bike-sharing) is a key trend, offering users a holistic mobility solution. The use of data analytics to optimize routes, pricing, and resource allocation is also gaining traction, leading to improved efficiency and cost-effectiveness. The market's fit continues to improve as it responds to the changing transportation needs and preferences of increasingly tech-savvy consumers.
Report Segmentation & Scope
This report segments the MaaS market by Service Type: Car, Bus, Bike; and Transportation Type: Public, Private.
By Service Type:
- Car: This segment includes ride-hailing services, car-sharing programs, and autonomous vehicle offerings. The growth projection for this segment is xx% CAGR from 2025-2033 with a projected market size of xx Million by 2033. Competitive dynamics are driven by established players and new entrants using advanced technologies.
- Bus: This segment encompasses bus-based MaaS platforms offering route planning, ticketing, and real-time information. The projected market size for this segment is estimated at xx Million by 2033 with xx% CAGR growth from 2025-2033. Market competitiveness depends upon the efficiency of the platform and the quality of bus infrastructure.
- Bike: This segment involves bike-sharing programs, e-scooter rentals, and other micro-mobility services. The market is projected to be valued at xx Million by 2033, experiencing xx% CAGR growth during the forecast period (2025-2033). Competition is fierce among bike-sharing companies.
By Transportation Type:
- Public: This segment includes integration with public transit systems and multi-modal journey planning. Market growth is expected to be driven by factors like government initiatives to promote public transportation and increasing public awareness.
- Private: This segment encompasses ride-hailing, car-sharing, and other private transportation options. It is expected to witness substantial growth, driven by the growing need for convenient and flexible transport solutions.
Key Drivers of MaaS Market Growth
Several key factors are driving the growth of the MaaS market. Technological advancements, such as the development of sophisticated mobile applications and the rise of autonomous vehicles, are enhancing user experience and efficiency. Economic factors, including rising disposable incomes and increasing urbanization, are driving demand for convenient and affordable transportation options. Government regulations and policies aimed at promoting sustainable transportation and reducing traffic congestion are also playing a significant role in stimulating market growth. For instance, investments in smart city initiatives are creating opportunities for MaaS integration.
Challenges in the MaaS Market Sector
The MaaS market faces several challenges, including regulatory hurdles related to data privacy, safety standards, and competition from traditional transportation modes. Supply chain disruptions can affect the availability of vehicles and other necessary resources. Intense competitive pressure necessitates continuous innovation and efficient cost management to maintain profitability. Furthermore, ensuring the integration of various modes of transportation and overcoming issues related to accessibility and affordability pose additional challenges. The estimated impact of these challenges on market growth is approximately a reduction of xx% by 2033.
Leading Players in the MaaS Market Market
- The Hertz Corporation
- Moovel
- Uber Technologies Inc
- Mobileo
- Beeline Mobility
- Enterprise Holdings Inc
- Avis Budget Group
- Moovit Inc
- Whim (MaaS Global)
- Didi Chuxing
- Bridj Technology Pty Ltd
- Ubigo (via-id)
- Citymapper
Key Developments in MaaS Market Sector
- December 2022: Moovit launches a MaaS pilot program in Tampa, integrating various transportation modes. This enhances multimodal trip planning and improves overall connectivity.
- January 2023: DiDi partners with Jordan Transfer Guidance to integrate taxi dispatch services into a transfer guidance app, supporting Jordan's MaaS and tourism strategy.
- February 2023: Uber collaborates with HSBC to provide a digital payment solution for unbanked drivers in Egypt, ensuring timely access to earnings.
Strategic MaaS Market Outlook
The MaaS market exhibits significant growth potential in the coming years, driven by continued technological innovation, evolving consumer preferences, and supportive government policies. Strategic opportunities abound for companies that can effectively integrate various transportation modes, offer seamless user experiences, and leverage data analytics to optimize operations. The market's future is shaped by the increasing adoption of sustainable transportation solutions and the integration of smart city technologies. The focus on personalization, improved customer service, and effective partnerships will be vital for success in this evolving landscape.
MaaS Market Segmentation
-
1. Service Type
- 1.1. Car
- 1.2. Bus
- 1.3. Bike
-
2. Transportation Type
- 2.1. Public
- 2.2. Private
MaaS Market Segmentation By Geography
-
1. North America
- 1.1. United States
- 1.2. Canada
- 1.3. Rest of North America
-
2. Europe
- 2.1. Germany
- 2.2. United Kingdom
- 2.3. France
- 2.4. Rest of Europe
-
3. Asia Pacific
- 3.1. India
- 3.2. China
- 3.3. Japan
- 3.4. South Korea
- 3.5. Rest of Asia Pacific
-
4. Rest of the World
- 4.1. South America
- 4.2. Middle East and Africa

MaaS Market REPORT HIGHLIGHTS
| Aspects | Details |
|---|---|
| Study Period | 2019-2033 |
| Base Year | 2024 |
| Estimated Year | 2025 |
| Forecast Period | 2025-2033 |
| Historical Period | 2019-2024 |
| Growth Rate | CAGR of 7.43% from 2019-2033 |
| Segmentation |
|
Table of Contents
- 1. Introduction
- 1.1. Research Scope
- 1.2. Market Segmentation
- 1.3. Research Methodology
- 1.4. Definitions and Assumptions
- 2. Executive Summary
- 2.1. Introduction
- 3. Market Dynamics
- 3.1. Introduction
- 3.2. Market Drivers
- 3.2.1. Increasing Vehicle Production; Emphasis on Vehicle Comfort and NVH Reduction
- 3.3. Market Restrains
- 3.3.1. Economic Fluctuations And Uncertainties
- 3.4. Market Trends
- 3.4.1. Increasing Traffic Congestion Drive the Demand in the Market
- 4. Market Factor Analysis
- 4.1. Porters Five Forces
- 4.2. Supply/Value Chain
- 4.3. PESTEL analysis
- 4.4. Market Entropy
- 4.5. Patent/Trademark Analysis
- 5. Global MaaS Market Analysis, Insights and Forecast, 2019-2031
- 5.1. Market Analysis, Insights and Forecast - by Service Type
- 5.1.1. Car
- 5.1.2. Bus
- 5.1.3. Bike
- 5.2. Market Analysis, Insights and Forecast - by Transportation Type
- 5.2.1. Public
- 5.2.2. Private
- 5.3. Market Analysis, Insights and Forecast - by Region
- 5.3.1. North America
- 5.3.2. Europe
- 5.3.3. Asia Pacific
- 5.3.4. Rest of the World
- 5.1. Market Analysis, Insights and Forecast - by Service Type
- 6. North America MaaS Market Analysis, Insights and Forecast, 2019-2031
- 6.1. Market Analysis, Insights and Forecast - by Service Type
- 6.1.1. Car
- 6.1.2. Bus
- 6.1.3. Bike
- 6.2. Market Analysis, Insights and Forecast - by Transportation Type
- 6.2.1. Public
- 6.2.2. Private
- 6.1. Market Analysis, Insights and Forecast - by Service Type
- 7. Europe MaaS Market Analysis, Insights and Forecast, 2019-2031
- 7.1. Market Analysis, Insights and Forecast - by Service Type
- 7.1.1. Car
- 7.1.2. Bus
- 7.1.3. Bike
- 7.2. Market Analysis, Insights and Forecast - by Transportation Type
- 7.2.1. Public
- 7.2.2. Private
- 7.1. Market Analysis, Insights and Forecast - by Service Type
- 8. Asia Pacific MaaS Market Analysis, Insights and Forecast, 2019-2031
- 8.1. Market Analysis, Insights and Forecast - by Service Type
- 8.1.1. Car
- 8.1.2. Bus
- 8.1.3. Bike
- 8.2. Market Analysis, Insights and Forecast - by Transportation Type
- 8.2.1. Public
- 8.2.2. Private
- 8.1. Market Analysis, Insights and Forecast - by Service Type
- 9. Rest of the World MaaS Market Analysis, Insights and Forecast, 2019-2031
- 9.1. Market Analysis, Insights and Forecast - by Service Type
- 9.1.1. Car
- 9.1.2. Bus
- 9.1.3. Bike
- 9.2. Market Analysis, Insights and Forecast - by Transportation Type
- 9.2.1. Public
- 9.2.2. Private
- 9.1. Market Analysis, Insights and Forecast - by Service Type
- 10. North America MaaS Market Analysis, Insights and Forecast, 2019-2031
- 10.1. Market Analysis, Insights and Forecast - By Country/Sub-region
- 10.1.1 United States
- 10.1.2 Canada
- 10.1.3 Rest of North America
- 11. Europe MaaS Market Analysis, Insights and Forecast, 2019-2031
- 11.1. Market Analysis, Insights and Forecast - By Country/Sub-region
- 11.1.1 Germany
- 11.1.2 United Kingdom
- 11.1.3 France
- 11.1.4 Rest of Europe
- 12. Asia Pacific MaaS Market Analysis, Insights and Forecast, 2019-2031
- 12.1. Market Analysis, Insights and Forecast - By Country/Sub-region
- 12.1.1 India
- 12.1.2 China
- 12.1.3 Japan
- 12.1.4 South Korea
- 12.1.5 Rest of Asia Pacific
- 13. Rest of the World MaaS Market Analysis, Insights and Forecast, 2019-2031
- 13.1. Market Analysis, Insights and Forecast - By Country/Sub-region
- 13.1.1 South America
- 13.1.2 Middle East and Africa
- 14. Competitive Analysis
- 14.1. Global Market Share Analysis 2024
- 14.2. Company Profiles
- 14.2.1 The Hertz Corporation
- 14.2.1.1. Overview
- 14.2.1.2. Products
- 14.2.1.3. SWOT Analysis
- 14.2.1.4. Recent Developments
- 14.2.1.5. Financials (Based on Availability)
- 14.2.2 Moovel
- 14.2.2.1. Overview
- 14.2.2.2. Products
- 14.2.2.3. SWOT Analysis
- 14.2.2.4. Recent Developments
- 14.2.2.5. Financials (Based on Availability)
- 14.2.3 Uber Technologies Inc
- 14.2.3.1. Overview
- 14.2.3.2. Products
- 14.2.3.3. SWOT Analysis
- 14.2.3.4. Recent Developments
- 14.2.3.5. Financials (Based on Availability)
- 14.2.4 Mobileo
- 14.2.4.1. Overview
- 14.2.4.2. Products
- 14.2.4.3. SWOT Analysis
- 14.2.4.4. Recent Developments
- 14.2.4.5. Financials (Based on Availability)
- 14.2.5 Beeline Mobility
- 14.2.5.1. Overview
- 14.2.5.2. Products
- 14.2.5.3. SWOT Analysis
- 14.2.5.4. Recent Developments
- 14.2.5.5. Financials (Based on Availability)
- 14.2.6 Enterprise Holdings Inc
- 14.2.6.1. Overview
- 14.2.6.2. Products
- 14.2.6.3. SWOT Analysis
- 14.2.6.4. Recent Developments
- 14.2.6.5. Financials (Based on Availability)
- 14.2.7 Avis Budget Group
- 14.2.7.1. Overview
- 14.2.7.2. Products
- 14.2.7.3. SWOT Analysis
- 14.2.7.4. Recent Developments
- 14.2.7.5. Financials (Based on Availability)
- 14.2.8 Moovit Inc
- 14.2.8.1. Overview
- 14.2.8.2. Products
- 14.2.8.3. SWOT Analysis
- 14.2.8.4. Recent Developments
- 14.2.8.5. Financials (Based on Availability)
- 14.2.9 Whim (Maas Global)
- 14.2.9.1. Overview
- 14.2.9.2. Products
- 14.2.9.3. SWOT Analysis
- 14.2.9.4. Recent Developments
- 14.2.9.5. Financials (Based on Availability)
- 14.2.10 Didi Chuxing
- 14.2.10.1. Overview
- 14.2.10.2. Products
- 14.2.10.3. SWOT Analysis
- 14.2.10.4. Recent Developments
- 14.2.10.5. Financials (Based on Availability)
- 14.2.11 Bridj Technology Pty Ltd
- 14.2.11.1. Overview
- 14.2.11.2. Products
- 14.2.11.3. SWOT Analysis
- 14.2.11.4. Recent Developments
- 14.2.11.5. Financials (Based on Availability)
- 14.2.12 Ubigo (via-id)
- 14.2.12.1. Overview
- 14.2.12.2. Products
- 14.2.12.3. SWOT Analysis
- 14.2.12.4. Recent Developments
- 14.2.12.5. Financials (Based on Availability)
- 14.2.13 Citymapper
- 14.2.13.1. Overview
- 14.2.13.2. Products
- 14.2.13.3. SWOT Analysis
- 14.2.13.4. Recent Developments
- 14.2.13.5. Financials (Based on Availability)
- 14.2.1 The Hertz Corporation
List of Figures
- Figure 1: Global MaaS Market Revenue Breakdown (Million, %) by Region 2024 & 2032
- Figure 2: North America MaaS Market Revenue (Million), by Country 2024 & 2032
- Figure 3: North America MaaS Market Revenue Share (%), by Country 2024 & 2032
- Figure 4: Europe MaaS Market Revenue (Million), by Country 2024 & 2032
- Figure 5: Europe MaaS Market Revenue Share (%), by Country 2024 & 2032
- Figure 6: Asia Pacific MaaS Market Revenue (Million), by Country 2024 & 2032
- Figure 7: Asia Pacific MaaS Market Revenue Share (%), by Country 2024 & 2032
- Figure 8: Rest of the World MaaS Market Revenue (Million), by Country 2024 & 2032
- Figure 9: Rest of the World MaaS Market Revenue Share (%), by Country 2024 & 2032
- Figure 10: North America MaaS Market Revenue (Million), by Service Type 2024 & 2032
- Figure 11: North America MaaS Market Revenue Share (%), by Service Type 2024 & 2032
- Figure 12: North America MaaS Market Revenue (Million), by Transportation Type 2024 & 2032
- Figure 13: North America MaaS Market Revenue Share (%), by Transportation Type 2024 & 2032
- Figure 14: North America MaaS Market Revenue (Million), by Country 2024 & 2032
- Figure 15: North America MaaS Market Revenue Share (%), by Country 2024 & 2032
- Figure 16: Europe MaaS Market Revenue (Million), by Service Type 2024 & 2032
- Figure 17: Europe MaaS Market Revenue Share (%), by Service Type 2024 & 2032
- Figure 18: Europe MaaS Market Revenue (Million), by Transportation Type 2024 & 2032
- Figure 19: Europe MaaS Market Revenue Share (%), by Transportation Type 2024 & 2032
- Figure 20: Europe MaaS Market Revenue (Million), by Country 2024 & 2032
- Figure 21: Europe MaaS Market Revenue Share (%), by Country 2024 & 2032
- Figure 22: Asia Pacific MaaS Market Revenue (Million), by Service Type 2024 & 2032
- Figure 23: Asia Pacific MaaS Market Revenue Share (%), by Service Type 2024 & 2032
- Figure 24: Asia Pacific MaaS Market Revenue (Million), by Transportation Type 2024 & 2032
- Figure 25: Asia Pacific MaaS Market Revenue Share (%), by Transportation Type 2024 & 2032
- Figure 26: Asia Pacific MaaS Market Revenue (Million), by Country 2024 & 2032
- Figure 27: Asia Pacific MaaS Market Revenue Share (%), by Country 2024 & 2032
- Figure 28: Rest of the World MaaS Market Revenue (Million), by Service Type 2024 & 2032
- Figure 29: Rest of the World MaaS Market Revenue Share (%), by Service Type 2024 & 2032
- Figure 30: Rest of the World MaaS Market Revenue (Million), by Transportation Type 2024 & 2032
- Figure 31: Rest of the World MaaS Market Revenue Share (%), by Transportation Type 2024 & 2032
- Figure 32: Rest of the World MaaS Market Revenue (Million), by Country 2024 & 2032
- Figure 33: Rest of the World MaaS Market Revenue Share (%), by Country 2024 & 2032
List of Tables
- Table 1: Global MaaS Market Revenue Million Forecast, by Region 2019 & 2032
- Table 2: Global MaaS Market Revenue Million Forecast, by Service Type 2019 & 2032
- Table 3: Global MaaS Market Revenue Million Forecast, by Transportation Type 2019 & 2032
- Table 4: Global MaaS Market Revenue Million Forecast, by Region 2019 & 2032
- Table 5: Global MaaS Market Revenue Million Forecast, by Country 2019 & 2032
- Table 6: United States MaaS Market Revenue (Million) Forecast, by Application 2019 & 2032
- Table 7: Canada MaaS Market Revenue (Million) Forecast, by Application 2019 & 2032
- Table 8: Rest of North America MaaS Market Revenue (Million) Forecast, by Application 2019 & 2032
- Table 9: Global MaaS Market Revenue Million Forecast, by Country 2019 & 2032
- Table 10: Germany MaaS Market Revenue (Million) Forecast, by Application 2019 & 2032
- Table 11: United Kingdom MaaS Market Revenue (Million) Forecast, by Application 2019 & 2032
- Table 12: France MaaS Market Revenue (Million) Forecast, by Application 2019 & 2032
- Table 13: Rest of Europe MaaS Market Revenue (Million) Forecast, by Application 2019 & 2032
- Table 14: Global MaaS Market Revenue Million Forecast, by Country 2019 & 2032
- Table 15: India MaaS Market Revenue (Million) Forecast, by Application 2019 & 2032
- Table 16: China MaaS Market Revenue (Million) Forecast, by Application 2019 & 2032
- Table 17: Japan MaaS Market Revenue (Million) Forecast, by Application 2019 & 2032
- Table 18: South Korea MaaS Market Revenue (Million) Forecast, by Application 2019 & 2032
- Table 19: Rest of Asia Pacific MaaS Market Revenue (Million) Forecast, by Application 2019 & 2032
- Table 20: Global MaaS Market Revenue Million Forecast, by Country 2019 & 2032
- Table 21: South America MaaS Market Revenue (Million) Forecast, by Application 2019 & 2032
- Table 22: Middle East and Africa MaaS Market Revenue (Million) Forecast, by Application 2019 & 2032
- Table 23: Global MaaS Market Revenue Million Forecast, by Service Type 2019 & 2032
- Table 24: Global MaaS Market Revenue Million Forecast, by Transportation Type 2019 & 2032
- Table 25: Global MaaS Market Revenue Million Forecast, by Country 2019 & 2032
- Table 26: United States MaaS Market Revenue (Million) Forecast, by Application 2019 & 2032
- Table 27: Canada MaaS Market Revenue (Million) Forecast, by Application 2019 & 2032
- Table 28: Rest of North America MaaS Market Revenue (Million) Forecast, by Application 2019 & 2032
- Table 29: Global MaaS Market Revenue Million Forecast, by Service Type 2019 & 2032
- Table 30: Global MaaS Market Revenue Million Forecast, by Transportation Type 2019 & 2032
- Table 31: Global MaaS Market Revenue Million Forecast, by Country 2019 & 2032
- Table 32: Germany MaaS Market Revenue (Million) Forecast, by Application 2019 & 2032
- Table 33: United Kingdom MaaS Market Revenue (Million) Forecast, by Application 2019 & 2032
- Table 34: France MaaS Market Revenue (Million) Forecast, by Application 2019 & 2032
- Table 35: Rest of Europe MaaS Market Revenue (Million) Forecast, by Application 2019 & 2032
- Table 36: Global MaaS Market Revenue Million Forecast, by Service Type 2019 & 2032
- Table 37: Global MaaS Market Revenue Million Forecast, by Transportation Type 2019 & 2032
- Table 38: Global MaaS Market Revenue Million Forecast, by Country 2019 & 2032
- Table 39: India MaaS Market Revenue (Million) Forecast, by Application 2019 & 2032
- Table 40: China MaaS Market Revenue (Million) Forecast, by Application 2019 & 2032
- Table 41: Japan MaaS Market Revenue (Million) Forecast, by Application 2019 & 2032
- Table 42: South Korea MaaS Market Revenue (Million) Forecast, by Application 2019 & 2032
- Table 43: Rest of Asia Pacific MaaS Market Revenue (Million) Forecast, by Application 2019 & 2032
- Table 44: Global MaaS Market Revenue Million Forecast, by Service Type 2019 & 2032
- Table 45: Global MaaS Market Revenue Million Forecast, by Transportation Type 2019 & 2032
- Table 46: Global MaaS Market Revenue Million Forecast, by Country 2019 & 2032
- Table 47: South America MaaS Market Revenue (Million) Forecast, by Application 2019 & 2032
- Table 48: Middle East and Africa MaaS Market Revenue (Million) Forecast, by Application 2019 & 2032
Frequently Asked Questions
1. What is the projected Compound Annual Growth Rate (CAGR) of the MaaS Market?
The projected CAGR is approximately 7.43%.
2. Which companies are prominent players in the MaaS Market?
Key companies in the market include The Hertz Corporation, Moovel, Uber Technologies Inc, Mobileo, Beeline Mobility, Enterprise Holdings Inc, Avis Budget Group, Moovit Inc, Whim (Maas Global), Didi Chuxing, Bridj Technology Pty Ltd, Ubigo (via-id), Citymapper.
3. What are the main segments of the MaaS Market?
The market segments include Service Type, Transportation Type.
4. Can you provide details about the market size?
The market size is estimated to be USD 0.78 Million as of 2022.
5. What are some drivers contributing to market growth?
Increasing Vehicle Production; Emphasis on Vehicle Comfort and NVH Reduction.
6. What are the notable trends driving market growth?
Increasing Traffic Congestion Drive the Demand in the Market.
7. Are there any restraints impacting market growth?
Economic Fluctuations And Uncertainties.
8. Can you provide examples of recent developments in the market?
In February 2023, Uber partnered with financial services firm HSBC to launch a digital payments solution that allows unbanked drivers in Egypt to receive on-demand cash outs into mobile wallets. Through this collaboration, the companies hope to provide Uber platform drivers with access to 100% of their earnings in a timely and convenient manner via HSBC Net's payment solution.
9. What pricing options are available for accessing the report?
Pricing options include single-user, multi-user, and enterprise licenses priced at USD 4750, USD 5250, and USD 8750 respectively.
10. Is the market size provided in terms of value or volume?
The market size is provided in terms of value, measured in Million.
11. Are there any specific market keywords associated with the report?
Yes, the market keyword associated with the report is "MaaS Market," which aids in identifying and referencing the specific market segment covered.
12. How do I determine which pricing option suits my needs best?
The pricing options vary based on user requirements and access needs. Individual users may opt for single-user licenses, while businesses requiring broader access may choose multi-user or enterprise licenses for cost-effective access to the report.
13. Are there any additional resources or data provided in the MaaS Market report?
While the report offers comprehensive insights, it's advisable to review the specific contents or supplementary materials provided to ascertain if additional resources or data are available.
14. How can I stay updated on further developments or reports in the MaaS Market?
To stay informed about further developments, trends, and reports in the MaaS Market, consider subscribing to industry newsletters, following relevant companies and organizations, or regularly checking reputable industry news sources and publications.
Methodology
Step 1 - Identification of Relevant Samples Size from Population Database


Step 2 - Approaches for Defining Global Market Size (Value, Volume* & Price*)

Note*: In applicable scenarios
Step 3 - Data Sources
Primary Research
- Web Analytics
- Survey Reports
- Research Institute
- Latest Research Reports
- Opinion Leaders
Secondary Research
- Annual Reports
- White Paper
- Latest Press Release
- Industry Association
- Paid Database
- Investor Presentations

Step 4 - Data Triangulation
Involves using different sources of information in order to increase the validity of a study
These sources are likely to be stakeholders in a program - participants, other researchers, program staff, other community members, and so on.
Then we put all data in single framework & apply various statistical tools to find out the dynamic on the market.
During the analysis stage, feedback from the stakeholder groups would be compared to determine areas of agreement as well as areas of divergence


