
Key Insights
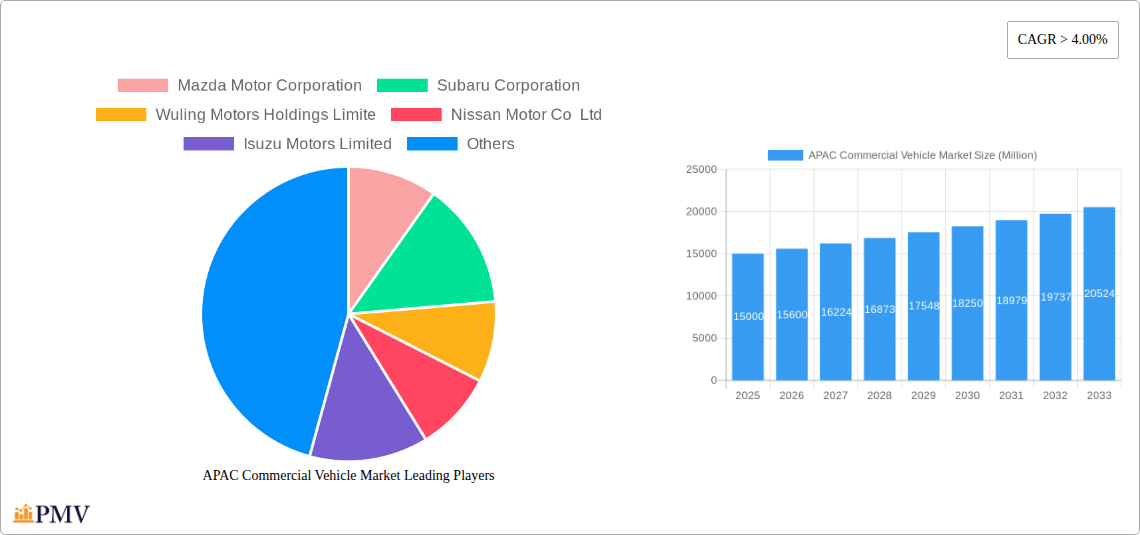
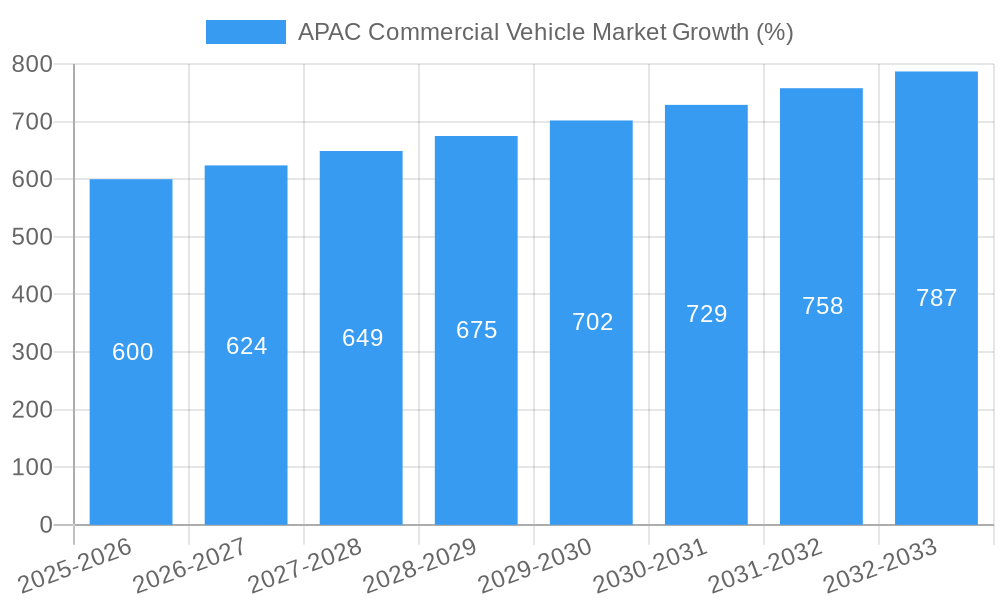
The APAC commercial vehicle market is experiencing robust growth, driven by expanding e-commerce logistics, infrastructure development across the region, and a rising middle class fueling consumer demand. A CAGR exceeding 4% indicates a consistently expanding market, projected to reach significant value by 2033. Key factors propelling this growth include the increasing adoption of hybrid and electric commercial vehicles, spurred by government regulations promoting sustainable transportation and a growing awareness of environmental concerns. The shift towards more efficient and environmentally friendly vehicles is a major trend reshaping the industry landscape. Furthermore, technological advancements in vehicle telematics, autonomous driving features, and improved safety systems are enhancing operational efficiency and driving adoption. While challenges remain, such as fluctuating fuel prices and the initial higher cost of electric and hybrid vehicles, the long-term potential for growth in this segment remains substantial. The market is segmented by fuel type (LPG, hybrid, electric), vehicle type (primarily focusing on commercial vehicles), and across key APAC nations, including Australia, China, India, Indonesia, Japan, Malaysia, South Korea, and Thailand. Leading manufacturers like Toyota, Hyundai, Isuzu, and others are heavily invested in this market, competing through technological innovation and strategic partnerships. The significant market size and consistent growth trajectory signal a promising investment opportunity for stakeholders across the value chain.
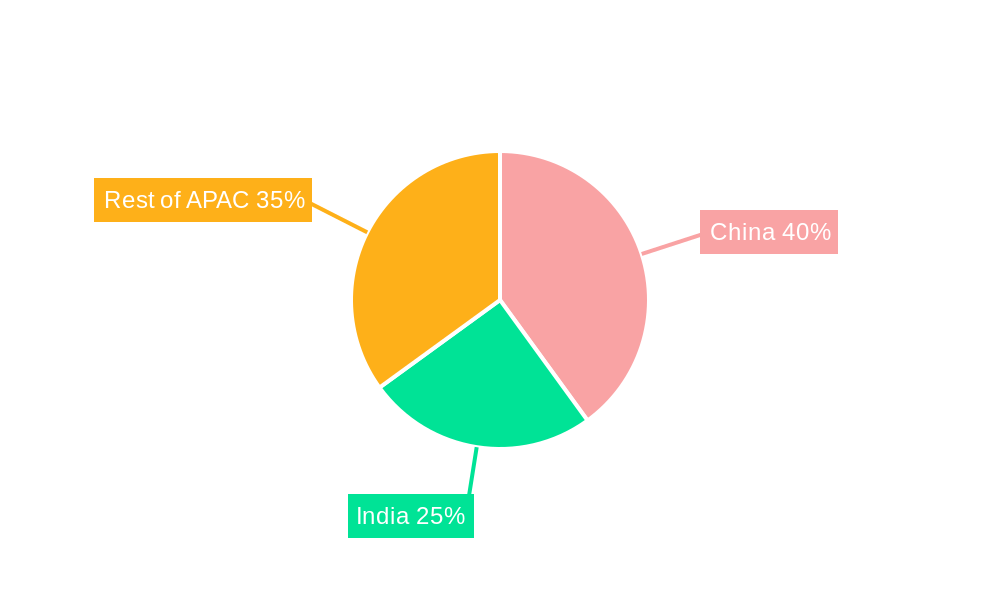
The diverse nature of the APAC market presents both opportunities and challenges. China and India, as the largest economies, will significantly influence overall market growth. Government policies encouraging the adoption of cleaner technologies and investment in infrastructure will play a crucial role in shaping market dynamics. While the adoption rate of electric and hybrid commercial vehicles is still developing, the trend is undeniable. The growth trajectory is strongly linked to economic development within each nation and the corresponding need for efficient and reliable transportation solutions. Further segmentation by vehicle type (e.g., trucks, buses, vans) would provide a more granular understanding of market dynamics. Companies are focusing on localization strategies, catering to specific regional needs and regulatory frameworks to capitalize on the market's full potential. Competition is intense, with both established and emerging players vying for market share through product innovation, pricing strategies, and strategic alliances.
APAC Commercial Vehicle Market: A Comprehensive Report (2019-2033)
This in-depth report provides a comprehensive analysis of the Asia-Pacific (APAC) commercial vehicle market, encompassing historical data (2019-2024), current estimations (2025), and future projections (2025-2033). The study meticulously examines market dynamics, competitive landscapes, and emerging trends across key segments, empowering businesses to make informed strategic decisions. This report is essential for automotive manufacturers, investors, and industry stakeholders seeking to understand the complexities and opportunities within this dynamic market.
APAC Commercial Vehicle Market Structure & Competitive Dynamics
This section delves into the competitive landscape of the APAC commercial vehicle market, analyzing market concentration, innovation ecosystems, regulatory frameworks, product substitutes, end-user trends, and M&A activities. The market is characterized by a mix of established global players and rapidly growing regional manufacturers. Market share is highly fragmented, with the top five players commanding approximately xx% of the total market in 2024.
- Market Concentration: The APAC commercial vehicle market exhibits a moderately concentrated structure, with a Herfindahl-Hirschman Index (HHI) of xx in 2024.
- Innovation Ecosystems: Significant investments in R&D are driving innovation in areas such as electric and hybrid vehicle technologies, autonomous driving systems, and connected vehicle solutions.
- Regulatory Frameworks: Government regulations focusing on emission standards (e.g., Euro VI/BS VI equivalents) and fuel efficiency are significantly influencing vehicle design and production. The implementation of stricter emission norms is driving the adoption of cleaner propulsion technologies.
- Product Substitutes: The rise of alternative transportation solutions, such as railways and public transportation, presents a competitive threat to the commercial vehicle industry.
- End-User Trends: The growing e-commerce sector and the expansion of logistics networks are fueling demand for commercial vehicles, particularly in rapidly developing economies like India and China.
- M&A Activities: The APAC region witnessed xx M&A deals in the commercial vehicle sector between 2019 and 2024, with a total transaction value of approximately xx Million. These mergers and acquisitions are primarily driven by strategic expansion and technology acquisition.
APAC Commercial Vehicle Market Industry Trends & Insights
This section provides a detailed analysis of the key trends shaping the APAC commercial vehicle market. The market is experiencing robust growth driven by factors such as increasing infrastructure development, expanding e-commerce activities, and government initiatives promoting sustainable transportation. However, challenges such as supply chain disruptions and stringent emission regulations also influence market dynamics. The market is projected to register a Compound Annual Growth Rate (CAGR) of xx% during the forecast period (2025-2033), reaching a market value of xx Million by 2033. Market penetration of electric and hybrid commercial vehicles is expected to increase significantly, driven by government incentives and growing environmental concerns. Consumer preferences are shifting towards fuel-efficient and technologically advanced vehicles with enhanced safety features. The competitive landscape is becoming increasingly intense, with major players focusing on product innovation, strategic partnerships, and market expansion.
Dominant Markets & Segments in APAC Commercial Vehicle Market
China remains the dominant market for commercial vehicles in the APAC region, accounting for xx% of the total market share in 2024. India and other Southeast Asian countries are also experiencing significant growth. The hybrid and electric vehicle segment is witnessing rapid expansion, driven by government policies promoting clean energy and environmental sustainability.
- Leading Region: China
- Leading Country: China
- Leading Segment (Propulsion Type): Diesel (currently dominant, but Hybrid and Electric are rapidly growing)
- Leading Segment (Vehicle Type): Light Commercial Vehicles (LCVs)
- Key Drivers for China's Dominance:
- Strong economic growth and infrastructure development.
- Large and expanding logistics sector.
- Government support for the automotive industry.
- Key Drivers for India's Growth:
- Rapid urbanization and infrastructure development.
- Expanding e-commerce and logistics sectors.
- Rising disposable incomes.
Other Key Countries: The growth in countries like Indonesia, Thailand, and South Korea is influenced by factors like expanding industrial sectors, government infrastructure initiatives, and favorable economic conditions. The Rest-of-APAC segment shows promising growth potential, driven by increasing economic activity and improving road networks.
APAC Commercial Vehicle Market Product Innovations
The APAC commercial vehicle market is witnessing significant product innovations, driven by the need for fuel efficiency, emission reduction, and enhanced safety features. Manufacturers are focusing on developing hybrid and electric commercial vehicles, incorporating advanced driver-assistance systems (ADAS), and adopting lightweight materials to improve fuel economy. These innovations are improving the overall performance, reliability, and environmental friendliness of commercial vehicles, contributing to their increased adoption across various segments.
Report Segmentation & Scope
This report segments the APAC commercial vehicle market based on vehicle type (light, medium, and heavy commercial vehicles), propulsion type (diesel, gasoline, hybrid, electric, LPG), and geography (Australia, China, India, Indonesia, Japan, Malaysia, South Korea, Thailand, Rest-of-APAC). Each segment's market size, growth projections, and competitive landscape are analyzed in detail. For example, the electric vehicle segment is projected to experience significant growth driven by government policies and environmental concerns. The China market is expected to continue its dominance due to its large and expanding economy. The LPG segment's growth is expected to remain relatively stable.
Key Drivers of APAC Commercial Vehicle Market Growth
Several factors are driving the growth of the APAC commercial vehicle market, including robust economic growth across the region, increasing urbanization and infrastructure development, the expanding e-commerce sector, and government policies promoting sustainable transportation. Specifically, China's Belt and Road Initiative significantly impacts infrastructure development and related commercial vehicle demand. Government incentives for electric and hybrid vehicles are accelerating the adoption of cleaner technologies. Lastly, the ever-growing need for efficient logistics solutions is further propelling market growth.
Challenges in the APAP Commercial Vehicle Market Sector
The APAC commercial vehicle market faces several challenges, including stringent emission regulations, supply chain disruptions caused by global events (e.g., semiconductor shortages), intense competition, and fluctuating fuel prices. These factors lead to increased production costs and potential delays in vehicle deliveries. Furthermore, the need for continuous technological upgrades to meet evolving consumer expectations poses ongoing challenges for manufacturers.
Leading Players in the APAC Commercial Vehicle Market Market
- Mazda Motor Corporation
- Subaru Corporation
- Wuling Motors Holdings Limite
- Nissan Motor Co Ltd
- Isuzu Motors Limited
- General Motors Company
- Anhui Ankai Automobile Co Ltd
- Dongfeng Motor Corporation
- Daihatsu Motor Co Ltd
- Tata Motors Limited
- Renault-Nissan-Mitsubishi Alliance
- Hyundai Motor Company
- Kia Corporation
- Toyota Motor Corporation
- Honda Motor Co Ltd
- Great Wall Motor Company Ltd (GWM)
- Mitsubishi Motors Corporation
- Suzuki Motor Corporation
- Ford Motor Company
Key Developments in APAC Commercial Vehicle Market Sector
- August 2023: General Motors will launch an all-electric Cadillac Escalade in late 2024. This signals a significant push towards electric vehicles in the luxury segment.
- August 2023: General Motors doubles down on plans for an electric future in the Middle East. This expansion into new markets indicates a strong commitment to electric vehicle technology.
- August 2023: Toyota Kirloskar Motor launched the all-new MPV Vellfire strong hybrid electric vehicle (SHEV) for a starting price of INR 11.99 Million and going to INR 12.99 Million. This launch demonstrates the growing popularity of hybrid vehicles in the APAC market.
Strategic APAC Commercial Vehicle Market Outlook
The APAC commercial vehicle market presents significant growth opportunities, driven by expanding economies, infrastructure development, and the increasing adoption of electric and hybrid vehicles. Strategic partnerships, technological advancements, and a focus on sustainable solutions will be crucial for success in this competitive market. Companies that can adapt to evolving regulatory environments and consumer preferences will be best positioned to capitalize on future growth potential. The market is poised for continued expansion, presenting considerable opportunities for both established players and new entrants.
APAC Commercial Vehicle Market Segmentation
-
1. Vehicle Type
-
1.1. Commercial Vehicles
- 1.1.1. Buses
- 1.1.2. Heavy-duty Commercial Trucks
- 1.1.3. Light Commercial Pick-up Trucks
- 1.1.4. Light Commercial Vans
- 1.1.5. Medium-duty Commercial Trucks
-
1.1. Commercial Vehicles
-
2. Propulsion Type
-
2.1. Hybrid and Electric Vehicles
-
2.1.1. By Fuel Category
- 2.1.1.1. BEV
- 2.1.1.2. FCEV
- 2.1.1.3. HEV
- 2.1.1.4. PHEV
-
2.1.1. By Fuel Category
-
2.2. ICE
- 2.2.1. CNG
- 2.2.2. Diesel
- 2.2.3. Gasoline
- 2.2.4. LPG
-
2.1. Hybrid and Electric Vehicles
APAC Commercial Vehicle Market Segmentation By Geography
-
1. North America
- 1.1. United States
- 1.2. Canada
- 1.3. Mexico
-
2. South America
- 2.1. Brazil
- 2.2. Argentina
- 2.3. Rest of South America
-
3. Europe
- 3.1. United Kingdom
- 3.2. Germany
- 3.3. France
- 3.4. Italy
- 3.5. Spain
- 3.6. Russia
- 3.7. Benelux
- 3.8. Nordics
- 3.9. Rest of Europe
-
4. Middle East & Africa
- 4.1. Turkey
- 4.2. Israel
- 4.3. GCC
- 4.4. North Africa
- 4.5. South Africa
- 4.6. Rest of Middle East & Africa
-
5. Asia Pacific
- 5.1. China
- 5.2. India
- 5.3. Japan
- 5.4. South Korea
- 5.5. ASEAN
- 5.6. Oceania
- 5.7. Rest of Asia Pacific
APAC Commercial Vehicle Market REPORT HIGHLIGHTS
| Aspects | Details |
|---|---|
| Study Period | 2019-2033 |
| Base Year | 2024 |
| Estimated Year | 2025 |
| Forecast Period | 2025-2033 |
| Historical Period | 2019-2024 |
| Growth Rate | CAGR of > 4.00% from 2019-2033 |
| Segmentation |
|
Table of Contents
- 1. Introduction
- 1.1. Research Scope
- 1.2. Market Segmentation
- 1.3. Research Methodology
- 1.4. Definitions and Assumptions
- 2. Executive Summary
- 2.1. Introduction
- 3. Market Dynamics
- 3.1. Introduction
- 3.2. Market Drivers
- 3.2.1. Surge in Trend of Yacht Tourism
- 3.3. Market Restrains
- 3.3.1. Higher Rentals During Peak Season
- 3.4. Market Trends
- 3.4.1. OTHER KEY INDUSTRY TRENDS COVERED IN THE REPORT
- 4. Market Factor Analysis
- 4.1. Porters Five Forces
- 4.2. Supply/Value Chain
- 4.3. PESTEL analysis
- 4.4. Market Entropy
- 4.5. Patent/Trademark Analysis
- 5. Global APAC Commercial Vehicle Market Analysis, Insights and Forecast, 2019-2031
- 5.1. Market Analysis, Insights and Forecast - by Vehicle Type
- 5.1.1. Commercial Vehicles
- 5.1.1.1. Buses
- 5.1.1.2. Heavy-duty Commercial Trucks
- 5.1.1.3. Light Commercial Pick-up Trucks
- 5.1.1.4. Light Commercial Vans
- 5.1.1.5. Medium-duty Commercial Trucks
- 5.1.1. Commercial Vehicles
- 5.2. Market Analysis, Insights and Forecast - by Propulsion Type
- 5.2.1. Hybrid and Electric Vehicles
- 5.2.1.1. By Fuel Category
- 5.2.1.1.1. BEV
- 5.2.1.1.2. FCEV
- 5.2.1.1.3. HEV
- 5.2.1.1.4. PHEV
- 5.2.1.1. By Fuel Category
- 5.2.2. ICE
- 5.2.2.1. CNG
- 5.2.2.2. Diesel
- 5.2.2.3. Gasoline
- 5.2.2.4. LPG
- 5.2.1. Hybrid and Electric Vehicles
- 5.3. Market Analysis, Insights and Forecast - by Region
- 5.3.1. North America
- 5.3.2. South America
- 5.3.3. Europe
- 5.3.4. Middle East & Africa
- 5.3.5. Asia Pacific
- 5.1. Market Analysis, Insights and Forecast - by Vehicle Type
- 6. North America APAC Commercial Vehicle Market Analysis, Insights and Forecast, 2019-2031
- 6.1. Market Analysis, Insights and Forecast - by Vehicle Type
- 6.1.1. Commercial Vehicles
- 6.1.1.1. Buses
- 6.1.1.2. Heavy-duty Commercial Trucks
- 6.1.1.3. Light Commercial Pick-up Trucks
- 6.1.1.4. Light Commercial Vans
- 6.1.1.5. Medium-duty Commercial Trucks
- 6.1.1. Commercial Vehicles
- 6.2. Market Analysis, Insights and Forecast - by Propulsion Type
- 6.2.1. Hybrid and Electric Vehicles
- 6.2.1.1. By Fuel Category
- 6.2.1.1.1. BEV
- 6.2.1.1.2. FCEV
- 6.2.1.1.3. HEV
- 6.2.1.1.4. PHEV
- 6.2.1.1. By Fuel Category
- 6.2.2. ICE
- 6.2.2.1. CNG
- 6.2.2.2. Diesel
- 6.2.2.3. Gasoline
- 6.2.2.4. LPG
- 6.2.1. Hybrid and Electric Vehicles
- 6.1. Market Analysis, Insights and Forecast - by Vehicle Type
- 7. South America APAC Commercial Vehicle Market Analysis, Insights and Forecast, 2019-2031
- 7.1. Market Analysis, Insights and Forecast - by Vehicle Type
- 7.1.1. Commercial Vehicles
- 7.1.1.1. Buses
- 7.1.1.2. Heavy-duty Commercial Trucks
- 7.1.1.3. Light Commercial Pick-up Trucks
- 7.1.1.4. Light Commercial Vans
- 7.1.1.5. Medium-duty Commercial Trucks
- 7.1.1. Commercial Vehicles
- 7.2. Market Analysis, Insights and Forecast - by Propulsion Type
- 7.2.1. Hybrid and Electric Vehicles
- 7.2.1.1. By Fuel Category
- 7.2.1.1.1. BEV
- 7.2.1.1.2. FCEV
- 7.2.1.1.3. HEV
- 7.2.1.1.4. PHEV
- 7.2.1.1. By Fuel Category
- 7.2.2. ICE
- 7.2.2.1. CNG
- 7.2.2.2. Diesel
- 7.2.2.3. Gasoline
- 7.2.2.4. LPG
- 7.2.1. Hybrid and Electric Vehicles
- 7.1. Market Analysis, Insights and Forecast - by Vehicle Type
- 8. Europe APAC Commercial Vehicle Market Analysis, Insights and Forecast, 2019-2031
- 8.1. Market Analysis, Insights and Forecast - by Vehicle Type
- 8.1.1. Commercial Vehicles
- 8.1.1.1. Buses
- 8.1.1.2. Heavy-duty Commercial Trucks
- 8.1.1.3. Light Commercial Pick-up Trucks
- 8.1.1.4. Light Commercial Vans
- 8.1.1.5. Medium-duty Commercial Trucks
- 8.1.1. Commercial Vehicles
- 8.2. Market Analysis, Insights and Forecast - by Propulsion Type
- 8.2.1. Hybrid and Electric Vehicles
- 8.2.1.1. By Fuel Category
- 8.2.1.1.1. BEV
- 8.2.1.1.2. FCEV
- 8.2.1.1.3. HEV
- 8.2.1.1.4. PHEV
- 8.2.1.1. By Fuel Category
- 8.2.2. ICE
- 8.2.2.1. CNG
- 8.2.2.2. Diesel
- 8.2.2.3. Gasoline
- 8.2.2.4. LPG
- 8.2.1. Hybrid and Electric Vehicles
- 8.1. Market Analysis, Insights and Forecast - by Vehicle Type
- 9. Middle East & Africa APAC Commercial Vehicle Market Analysis, Insights and Forecast, 2019-2031
- 9.1. Market Analysis, Insights and Forecast - by Vehicle Type
- 9.1.1. Commercial Vehicles
- 9.1.1.1. Buses
- 9.1.1.2. Heavy-duty Commercial Trucks
- 9.1.1.3. Light Commercial Pick-up Trucks
- 9.1.1.4. Light Commercial Vans
- 9.1.1.5. Medium-duty Commercial Trucks
- 9.1.1. Commercial Vehicles
- 9.2. Market Analysis, Insights and Forecast - by Propulsion Type
- 9.2.1. Hybrid and Electric Vehicles
- 9.2.1.1. By Fuel Category
- 9.2.1.1.1. BEV
- 9.2.1.1.2. FCEV
- 9.2.1.1.3. HEV
- 9.2.1.1.4. PHEV
- 9.2.1.1. By Fuel Category
- 9.2.2. ICE
- 9.2.2.1. CNG
- 9.2.2.2. Diesel
- 9.2.2.3. Gasoline
- 9.2.2.4. LPG
- 9.2.1. Hybrid and Electric Vehicles
- 9.1. Market Analysis, Insights and Forecast - by Vehicle Type
- 10. Asia Pacific APAC Commercial Vehicle Market Analysis, Insights and Forecast, 2019-2031
- 10.1. Market Analysis, Insights and Forecast - by Vehicle Type
- 10.1.1. Commercial Vehicles
- 10.1.1.1. Buses
- 10.1.1.2. Heavy-duty Commercial Trucks
- 10.1.1.3. Light Commercial Pick-up Trucks
- 10.1.1.4. Light Commercial Vans
- 10.1.1.5. Medium-duty Commercial Trucks
- 10.1.1. Commercial Vehicles
- 10.2. Market Analysis, Insights and Forecast - by Propulsion Type
- 10.2.1. Hybrid and Electric Vehicles
- 10.2.1.1. By Fuel Category
- 10.2.1.1.1. BEV
- 10.2.1.1.2. FCEV
- 10.2.1.1.3. HEV
- 10.2.1.1.4. PHEV
- 10.2.1.1. By Fuel Category
- 10.2.2. ICE
- 10.2.2.1. CNG
- 10.2.2.2. Diesel
- 10.2.2.3. Gasoline
- 10.2.2.4. LPG
- 10.2.1. Hybrid and Electric Vehicles
- 10.1. Market Analysis, Insights and Forecast - by Vehicle Type
- 11. Competitive Analysis
- 11.1. Global Market Share Analysis 2024
- 11.2. Company Profiles
- 11.2.1 Mazda Motor Corporation
- 11.2.1.1. Overview
- 11.2.1.2. Products
- 11.2.1.3. SWOT Analysis
- 11.2.1.4. Recent Developments
- 11.2.1.5. Financials (Based on Availability)
- 11.2.2 Subaru Corporation
- 11.2.2.1. Overview
- 11.2.2.2. Products
- 11.2.2.3. SWOT Analysis
- 11.2.2.4. Recent Developments
- 11.2.2.5. Financials (Based on Availability)
- 11.2.3 Wuling Motors Holdings Limite
- 11.2.3.1. Overview
- 11.2.3.2. Products
- 11.2.3.3. SWOT Analysis
- 11.2.3.4. Recent Developments
- 11.2.3.5. Financials (Based on Availability)
- 11.2.4 Nissan Motor Co Ltd
- 11.2.4.1. Overview
- 11.2.4.2. Products
- 11.2.4.3. SWOT Analysis
- 11.2.4.4. Recent Developments
- 11.2.4.5. Financials (Based on Availability)
- 11.2.5 Isuzu Motors Limited
- 11.2.5.1. Overview
- 11.2.5.2. Products
- 11.2.5.3. SWOT Analysis
- 11.2.5.4. Recent Developments
- 11.2.5.5. Financials (Based on Availability)
- 11.2.6 General Motors Company
- 11.2.6.1. Overview
- 11.2.6.2. Products
- 11.2.6.3. SWOT Analysis
- 11.2.6.4. Recent Developments
- 11.2.6.5. Financials (Based on Availability)
- 11.2.7 Anhui Ankai Automobile Co Ltd
- 11.2.7.1. Overview
- 11.2.7.2. Products
- 11.2.7.3. SWOT Analysis
- 11.2.7.4. Recent Developments
- 11.2.7.5. Financials (Based on Availability)
- 11.2.8 Dongfeng Motor Corporation
- 11.2.8.1. Overview
- 11.2.8.2. Products
- 11.2.8.3. SWOT Analysis
- 11.2.8.4. Recent Developments
- 11.2.8.5. Financials (Based on Availability)
- 11.2.9 Daihatsu Motor Co Ltd
- 11.2.9.1. Overview
- 11.2.9.2. Products
- 11.2.9.3. SWOT Analysis
- 11.2.9.4. Recent Developments
- 11.2.9.5. Financials (Based on Availability)
- 11.2.10 Tata Motors Limited
- 11.2.10.1. Overview
- 11.2.10.2. Products
- 11.2.10.3. SWOT Analysis
- 11.2.10.4. Recent Developments
- 11.2.10.5. Financials (Based on Availability)
- 11.2.11 Renault-Nissan-Mitsubishi Alliance
- 11.2.11.1. Overview
- 11.2.11.2. Products
- 11.2.11.3. SWOT Analysis
- 11.2.11.4. Recent Developments
- 11.2.11.5. Financials (Based on Availability)
- 11.2.12 Hyundai Motor Company
- 11.2.12.1. Overview
- 11.2.12.2. Products
- 11.2.12.3. SWOT Analysis
- 11.2.12.4. Recent Developments
- 11.2.12.5. Financials (Based on Availability)
- 11.2.13 Kia Corporation
- 11.2.13.1. Overview
- 11.2.13.2. Products
- 11.2.13.3. SWOT Analysis
- 11.2.13.4. Recent Developments
- 11.2.13.5. Financials (Based on Availability)
- 11.2.14 Toyota Motor Corporation
- 11.2.14.1. Overview
- 11.2.14.2. Products
- 11.2.14.3. SWOT Analysis
- 11.2.14.4. Recent Developments
- 11.2.14.5. Financials (Based on Availability)
- 11.2.15 Honda Motor Co Ltd
- 11.2.15.1. Overview
- 11.2.15.2. Products
- 11.2.15.3. SWOT Analysis
- 11.2.15.4. Recent Developments
- 11.2.15.5. Financials (Based on Availability)
- 11.2.16 Great Wall Motor Company Ltd (GWM)
- 11.2.16.1. Overview
- 11.2.16.2. Products
- 11.2.16.3. SWOT Analysis
- 11.2.16.4. Recent Developments
- 11.2.16.5. Financials (Based on Availability)
- 11.2.17 Mitsubishi Motors Corporation
- 11.2.17.1. Overview
- 11.2.17.2. Products
- 11.2.17.3. SWOT Analysis
- 11.2.17.4. Recent Developments
- 11.2.17.5. Financials (Based on Availability)
- 11.2.18 Suzuki Motor Corporation
- 11.2.18.1. Overview
- 11.2.18.2. Products
- 11.2.18.3. SWOT Analysis
- 11.2.18.4. Recent Developments
- 11.2.18.5. Financials (Based on Availability)
- 11.2.19 Ford Motor Company
- 11.2.19.1. Overview
- 11.2.19.2. Products
- 11.2.19.3. SWOT Analysis
- 11.2.19.4. Recent Developments
- 11.2.19.5. Financials (Based on Availability)
- 11.2.1 Mazda Motor Corporation
List of Figures
- Figure 1: Global APAC Commercial Vehicle Market Revenue Breakdown (Million, %) by Region 2024 & 2032
- Figure 2: North America APAC Commercial Vehicle Market Revenue (Million), by Vehicle Type 2024 & 2032
- Figure 3: North America APAC Commercial Vehicle Market Revenue Share (%), by Vehicle Type 2024 & 2032
- Figure 4: North America APAC Commercial Vehicle Market Revenue (Million), by Propulsion Type 2024 & 2032
- Figure 5: North America APAC Commercial Vehicle Market Revenue Share (%), by Propulsion Type 2024 & 2032
- Figure 6: North America APAC Commercial Vehicle Market Revenue (Million), by Country 2024 & 2032
- Figure 7: North America APAC Commercial Vehicle Market Revenue Share (%), by Country 2024 & 2032
- Figure 8: South America APAC Commercial Vehicle Market Revenue (Million), by Vehicle Type 2024 & 2032
- Figure 9: South America APAC Commercial Vehicle Market Revenue Share (%), by Vehicle Type 2024 & 2032
- Figure 10: South America APAC Commercial Vehicle Market Revenue (Million), by Propulsion Type 2024 & 2032
- Figure 11: South America APAC Commercial Vehicle Market Revenue Share (%), by Propulsion Type 2024 & 2032
- Figure 12: South America APAC Commercial Vehicle Market Revenue (Million), by Country 2024 & 2032
- Figure 13: South America APAC Commercial Vehicle Market Revenue Share (%), by Country 2024 & 2032
- Figure 14: Europe APAC Commercial Vehicle Market Revenue (Million), by Vehicle Type 2024 & 2032
- Figure 15: Europe APAC Commercial Vehicle Market Revenue Share (%), by Vehicle Type 2024 & 2032
- Figure 16: Europe APAC Commercial Vehicle Market Revenue (Million), by Propulsion Type 2024 & 2032
- Figure 17: Europe APAC Commercial Vehicle Market Revenue Share (%), by Propulsion Type 2024 & 2032
- Figure 18: Europe APAC Commercial Vehicle Market Revenue (Million), by Country 2024 & 2032
- Figure 19: Europe APAC Commercial Vehicle Market Revenue Share (%), by Country 2024 & 2032
- Figure 20: Middle East & Africa APAC Commercial Vehicle Market Revenue (Million), by Vehicle Type 2024 & 2032
- Figure 21: Middle East & Africa APAC Commercial Vehicle Market Revenue Share (%), by Vehicle Type 2024 & 2032
- Figure 22: Middle East & Africa APAC Commercial Vehicle Market Revenue (Million), by Propulsion Type 2024 & 2032
- Figure 23: Middle East & Africa APAC Commercial Vehicle Market Revenue Share (%), by Propulsion Type 2024 & 2032
- Figure 24: Middle East & Africa APAC Commercial Vehicle Market Revenue (Million), by Country 2024 & 2032
- Figure 25: Middle East & Africa APAC Commercial Vehicle Market Revenue Share (%), by Country 2024 & 2032
- Figure 26: Asia Pacific APAC Commercial Vehicle Market Revenue (Million), by Vehicle Type 2024 & 2032
- Figure 27: Asia Pacific APAC Commercial Vehicle Market Revenue Share (%), by Vehicle Type 2024 & 2032
- Figure 28: Asia Pacific APAC Commercial Vehicle Market Revenue (Million), by Propulsion Type 2024 & 2032
- Figure 29: Asia Pacific APAC Commercial Vehicle Market Revenue Share (%), by Propulsion Type 2024 & 2032
- Figure 30: Asia Pacific APAC Commercial Vehicle Market Revenue (Million), by Country 2024 & 2032
- Figure 31: Asia Pacific APAC Commercial Vehicle Market Revenue Share (%), by Country 2024 & 2032
List of Tables
- Table 1: Global APAC Commercial Vehicle Market Revenue Million Forecast, by Region 2019 & 2032
- Table 2: Global APAC Commercial Vehicle Market Revenue Million Forecast, by Vehicle Type 2019 & 2032
- Table 3: Global APAC Commercial Vehicle Market Revenue Million Forecast, by Propulsion Type 2019 & 2032
- Table 4: Global APAC Commercial Vehicle Market Revenue Million Forecast, by Region 2019 & 2032
- Table 5: Global APAC Commercial Vehicle Market Revenue Million Forecast, by Vehicle Type 2019 & 2032
- Table 6: Global APAC Commercial Vehicle Market Revenue Million Forecast, by Propulsion Type 2019 & 2032
- Table 7: Global APAC Commercial Vehicle Market Revenue Million Forecast, by Country 2019 & 2032
- Table 8: United States APAC Commercial Vehicle Market Revenue (Million) Forecast, by Application 2019 & 2032
- Table 9: Canada APAC Commercial Vehicle Market Revenue (Million) Forecast, by Application 2019 & 2032
- Table 10: Mexico APAC Commercial Vehicle Market Revenue (Million) Forecast, by Application 2019 & 2032
- Table 11: Global APAC Commercial Vehicle Market Revenue Million Forecast, by Vehicle Type 2019 & 2032
- Table 12: Global APAC Commercial Vehicle Market Revenue Million Forecast, by Propulsion Type 2019 & 2032
- Table 13: Global APAC Commercial Vehicle Market Revenue Million Forecast, by Country 2019 & 2032
- Table 14: Brazil APAC Commercial Vehicle Market Revenue (Million) Forecast, by Application 2019 & 2032
- Table 15: Argentina APAC Commercial Vehicle Market Revenue (Million) Forecast, by Application 2019 & 2032
- Table 16: Rest of South America APAC Commercial Vehicle Market Revenue (Million) Forecast, by Application 2019 & 2032
- Table 17: Global APAC Commercial Vehicle Market Revenue Million Forecast, by Vehicle Type 2019 & 2032
- Table 18: Global APAC Commercial Vehicle Market Revenue Million Forecast, by Propulsion Type 2019 & 2032
- Table 19: Global APAC Commercial Vehicle Market Revenue Million Forecast, by Country 2019 & 2032
- Table 20: United Kingdom APAC Commercial Vehicle Market Revenue (Million) Forecast, by Application 2019 & 2032
- Table 21: Germany APAC Commercial Vehicle Market Revenue (Million) Forecast, by Application 2019 & 2032
- Table 22: France APAC Commercial Vehicle Market Revenue (Million) Forecast, by Application 2019 & 2032
- Table 23: Italy APAC Commercial Vehicle Market Revenue (Million) Forecast, by Application 2019 & 2032
- Table 24: Spain APAC Commercial Vehicle Market Revenue (Million) Forecast, by Application 2019 & 2032
- Table 25: Russia APAC Commercial Vehicle Market Revenue (Million) Forecast, by Application 2019 & 2032
- Table 26: Benelux APAC Commercial Vehicle Market Revenue (Million) Forecast, by Application 2019 & 2032
- Table 27: Nordics APAC Commercial Vehicle Market Revenue (Million) Forecast, by Application 2019 & 2032
- Table 28: Rest of Europe APAC Commercial Vehicle Market Revenue (Million) Forecast, by Application 2019 & 2032
- Table 29: Global APAC Commercial Vehicle Market Revenue Million Forecast, by Vehicle Type 2019 & 2032
- Table 30: Global APAC Commercial Vehicle Market Revenue Million Forecast, by Propulsion Type 2019 & 2032
- Table 31: Global APAC Commercial Vehicle Market Revenue Million Forecast, by Country 2019 & 2032
- Table 32: Turkey APAC Commercial Vehicle Market Revenue (Million) Forecast, by Application 2019 & 2032
- Table 33: Israel APAC Commercial Vehicle Market Revenue (Million) Forecast, by Application 2019 & 2032
- Table 34: GCC APAC Commercial Vehicle Market Revenue (Million) Forecast, by Application 2019 & 2032
- Table 35: North Africa APAC Commercial Vehicle Market Revenue (Million) Forecast, by Application 2019 & 2032
- Table 36: South Africa APAC Commercial Vehicle Market Revenue (Million) Forecast, by Application 2019 & 2032
- Table 37: Rest of Middle East & Africa APAC Commercial Vehicle Market Revenue (Million) Forecast, by Application 2019 & 2032
- Table 38: Global APAC Commercial Vehicle Market Revenue Million Forecast, by Vehicle Type 2019 & 2032
- Table 39: Global APAC Commercial Vehicle Market Revenue Million Forecast, by Propulsion Type 2019 & 2032
- Table 40: Global APAC Commercial Vehicle Market Revenue Million Forecast, by Country 2019 & 2032
- Table 41: China APAC Commercial Vehicle Market Revenue (Million) Forecast, by Application 2019 & 2032
- Table 42: India APAC Commercial Vehicle Market Revenue (Million) Forecast, by Application 2019 & 2032
- Table 43: Japan APAC Commercial Vehicle Market Revenue (Million) Forecast, by Application 2019 & 2032
- Table 44: South Korea APAC Commercial Vehicle Market Revenue (Million) Forecast, by Application 2019 & 2032
- Table 45: ASEAN APAC Commercial Vehicle Market Revenue (Million) Forecast, by Application 2019 & 2032
- Table 46: Oceania APAC Commercial Vehicle Market Revenue (Million) Forecast, by Application 2019 & 2032
- Table 47: Rest of Asia Pacific APAC Commercial Vehicle Market Revenue (Million) Forecast, by Application 2019 & 2032
Frequently Asked Questions
1. What is the projected Compound Annual Growth Rate (CAGR) of the APAC Commercial Vehicle Market?
The projected CAGR is approximately > 4.00%.
2. Which companies are prominent players in the APAC Commercial Vehicle Market?
Key companies in the market include Mazda Motor Corporation, Subaru Corporation, Wuling Motors Holdings Limite, Nissan Motor Co Ltd, Isuzu Motors Limited, General Motors Company, Anhui Ankai Automobile Co Ltd, Dongfeng Motor Corporation, Daihatsu Motor Co Ltd, Tata Motors Limited, Renault-Nissan-Mitsubishi Alliance, Hyundai Motor Company, Kia Corporation, Toyota Motor Corporation, Honda Motor Co Ltd, Great Wall Motor Company Ltd (GWM), Mitsubishi Motors Corporation, Suzuki Motor Corporation, Ford Motor Company.
3. What are the main segments of the APAC Commercial Vehicle Market?
The market segments include Vehicle Type, Propulsion Type.
4. Can you provide details about the market size?
The market size is estimated to be USD XX Million as of 2022.
5. What are some drivers contributing to market growth?
Surge in Trend of Yacht Tourism.
6. What are the notable trends driving market growth?
OTHER KEY INDUSTRY TRENDS COVERED IN THE REPORT.
7. Are there any restraints impacting market growth?
Higher Rentals During Peak Season.
8. Can you provide examples of recent developments in the market?
August 2023: General Motors will launch an all-electric Cadillac Escalade in late 2024August 2023: General Motors doubles down on plans for an electric future in the Middle East.August 2023: Toyota Kirloskar Motor launched the all-new MPV Vellfire strong hybrid electric vehicle (SHEV) for a starting price of INR 11.99 million and going to INR 12.99 million.
9. What pricing options are available for accessing the report?
Pricing options include single-user, multi-user, and enterprise licenses priced at USD 3800, USD 4500, and USD 5800 respectively.
10. Is the market size provided in terms of value or volume?
The market size is provided in terms of value, measured in Million.
11. Are there any specific market keywords associated with the report?
Yes, the market keyword associated with the report is "APAC Commercial Vehicle Market," which aids in identifying and referencing the specific market segment covered.
12. How do I determine which pricing option suits my needs best?
The pricing options vary based on user requirements and access needs. Individual users may opt for single-user licenses, while businesses requiring broader access may choose multi-user or enterprise licenses for cost-effective access to the report.
13. Are there any additional resources or data provided in the APAC Commercial Vehicle Market report?
While the report offers comprehensive insights, it's advisable to review the specific contents or supplementary materials provided to ascertain if additional resources or data are available.
14. How can I stay updated on further developments or reports in the APAC Commercial Vehicle Market?
To stay informed about further developments, trends, and reports in the APAC Commercial Vehicle Market, consider subscribing to industry newsletters, following relevant companies and organizations, or regularly checking reputable industry news sources and publications.
Methodology
Step 1 - Identification of Relevant Samples Size from Population Database


Step 2 - Approaches for Defining Global Market Size (Value, Volume* & Price*)

Note*: In applicable scenarios
Step 3 - Data Sources
Primary Research
- Web Analytics
- Survey Reports
- Research Institute
- Latest Research Reports
- Opinion Leaders
Secondary Research
- Annual Reports
- White Paper
- Latest Press Release
- Industry Association
- Paid Database
- Investor Presentations

Step 4 - Data Triangulation
Involves using different sources of information in order to increase the validity of a study
These sources are likely to be stakeholders in a program - participants, other researchers, program staff, other community members, and so on.
Then we put all data in single framework & apply various statistical tools to find out the dynamic on the market.
During the analysis stage, feedback from the stakeholder groups would be compared to determine areas of agreement as well as areas of divergence


