
Key Insights
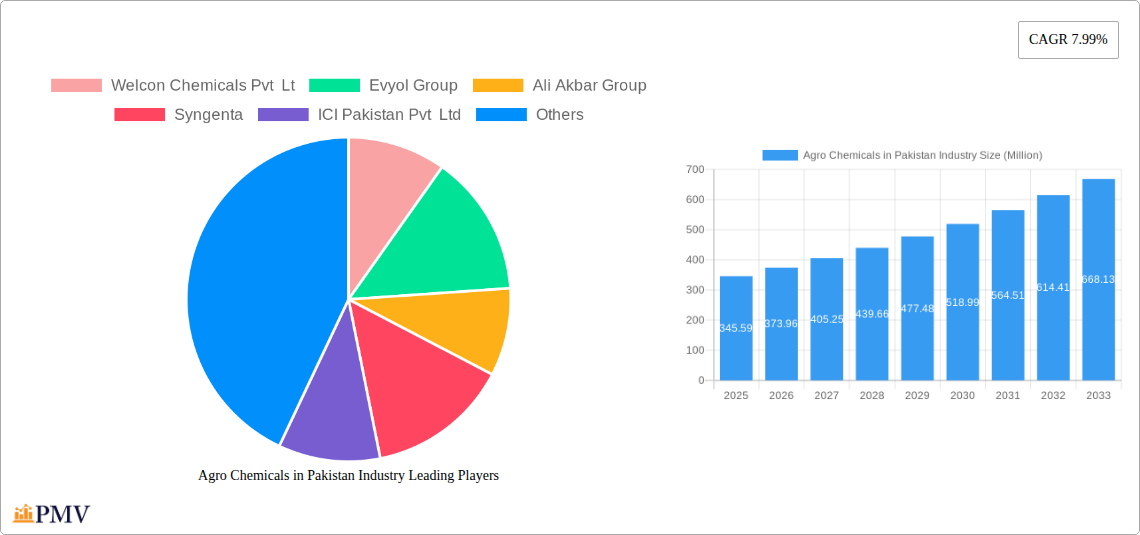
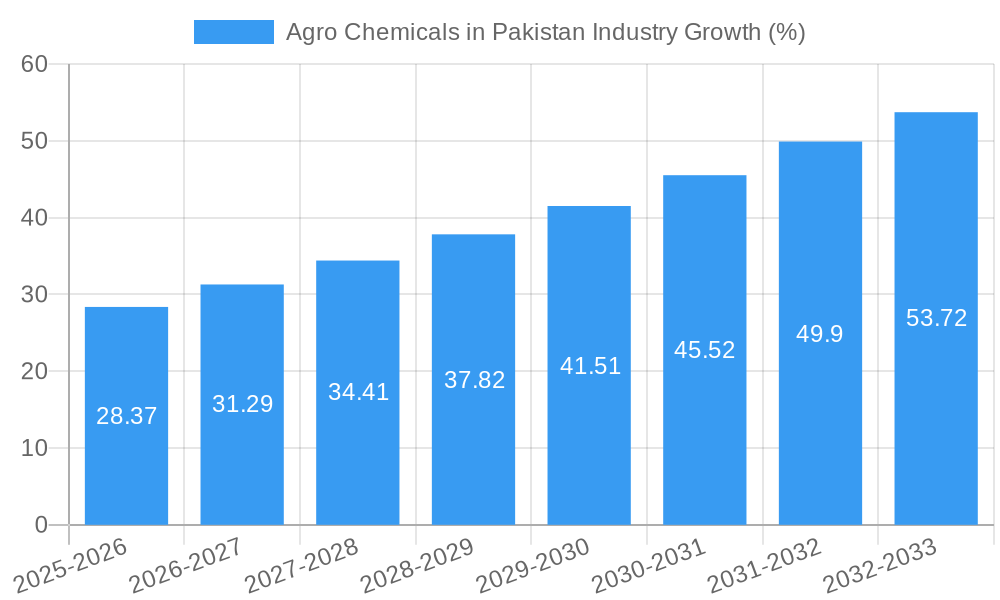
The Pakistani agrochemicals market, valued at $345.59 million in 2025, is projected to experience robust growth, driven by increasing agricultural production needs, rising farmer incomes in certain regions, and government initiatives promoting modern farming techniques. The Compound Annual Growth Rate (CAGR) of 7.99% from 2025 to 2033 indicates a significant expansion of the market, reaching an estimated value of approximately $700 million by 2033 (this projection is based on the provided CAGR and current market size). Key growth drivers include the increasing adoption of high-yielding crop varieties, expanding cultivated land suitable for high-value crops, and a growing demand for improved crop quality and yield. The market segments are diversified, with fertilizers, pesticides, and adjuvants holding significant shares, catering to a wide range of crops including grains and cereals, pulses and oilseeds, fruits, vegetables, and ornamentals. Competition is intense, with both multinational corporations like Syngenta, BASF SE, and Bayer AG, and domestic players such as Welcon Chemicals Pvt Ltd and Pakistan Agro Chemicals Pvt Ltd vying for market share.
However, certain challenges hinder the market’s full potential. These include price volatility of raw materials, stringent regulatory requirements for pesticide registration, and potential environmental concerns associated with certain agrochemical applications. Addressing these challenges through sustainable agricultural practices, investment in research and development of eco-friendly alternatives, and robust regulatory frameworks are crucial for the sustained growth of the Pakistani agrochemicals market. The market presents lucrative opportunities for companies focused on innovative and sustainable solutions, particularly in areas like precision agriculture and biopesticides, catering to the growing demand for environmentally conscious farming practices. The government's role in promoting sustainable agriculture and facilitating access to modern agricultural technologies will be key in shaping the future trajectory of this expanding market.
Agro Chemicals in Pakistan Industry: Market Analysis and Forecast 2019-2033
This comprehensive report provides a detailed analysis of the Agro Chemicals market in Pakistan, offering valuable insights into market dynamics, competitive landscape, and future growth prospects. The study covers the period 2019-2033, with a focus on 2025 as the base and estimated year. We project a robust growth trajectory for the Pakistani agrochemical sector, driven by increasing agricultural production, government initiatives, and technological advancements. This report is crucial for stakeholders including manufacturers, distributors, investors, and policymakers seeking to understand and capitalize on opportunities within this dynamic market.
Agro Chemicals in Pakistan Industry Market Structure & Competitive Dynamics
The Pakistani agrochemical market exhibits a blend of multinational giants and domestic players. Market concentration is moderate, with a few large players holding significant market share, while numerous smaller companies cater to niche segments. The market is characterized by intense competition, driven by price wars and continuous product innovation. The regulatory framework, while evolving, plays a significant role in shaping market access and product approvals. Substitution possibilities exist, particularly with the increasing interest in biopesticides and organic farming practices. End-user trends are shifting towards sustainable and environmentally friendly solutions. Mergers and acquisitions (M&A) activity is moderately active, with larger players seeking to expand their portfolios and market reach. Significant M&A deals in the past few years have totaled approximately xx Million, mainly focusing on acquiring smaller, specialized companies. Market share distribution amongst the top 5 players is approximately xx%, reflecting a moderately consolidated industry.
- Market Concentration: Moderate, with a few dominant players.
- Innovation Ecosystems: Developing, with increasing focus on biopesticides and precision agriculture technologies.
- Regulatory Frameworks: Evolving, with increasing emphasis on safety and environmental regulations.
- Product Substitutes: Biopesticides and organic alternatives pose a growing competitive threat.
- End-User Trends: Shift towards sustainable and high-efficiency solutions.
- M&A Activity: Moderate, with deals focused on portfolio expansion and technological acquisition.
Agro Chemicals in Pakistan Industry Industry Trends & Insights
The Pakistani agrochemical market is witnessing robust growth, driven by several factors. The rising demand for food due to a growing population necessitates increased agricultural output, fueling the demand for agrochemicals. Government initiatives to improve agricultural practices and yield also contribute significantly. Technological advancements, such as precision agriculture techniques and the introduction of novel formulations, are transforming the sector. Consumer preferences are shifting towards safer and more environmentally friendly products, creating opportunities for biopesticides and other sustainable solutions. The market is witnessing a significant uptake of advanced technologies and improved farming practices, leading to increased crop yields and improved farm profitability. The CAGR for the period 2025-2033 is estimated to be xx%, with market penetration for advanced solutions steadily increasing. Competitive dynamics are characterized by both price competition and innovation-driven differentiation.
Dominant Markets & Segments in Agro Chemicals in Pakistan Industry
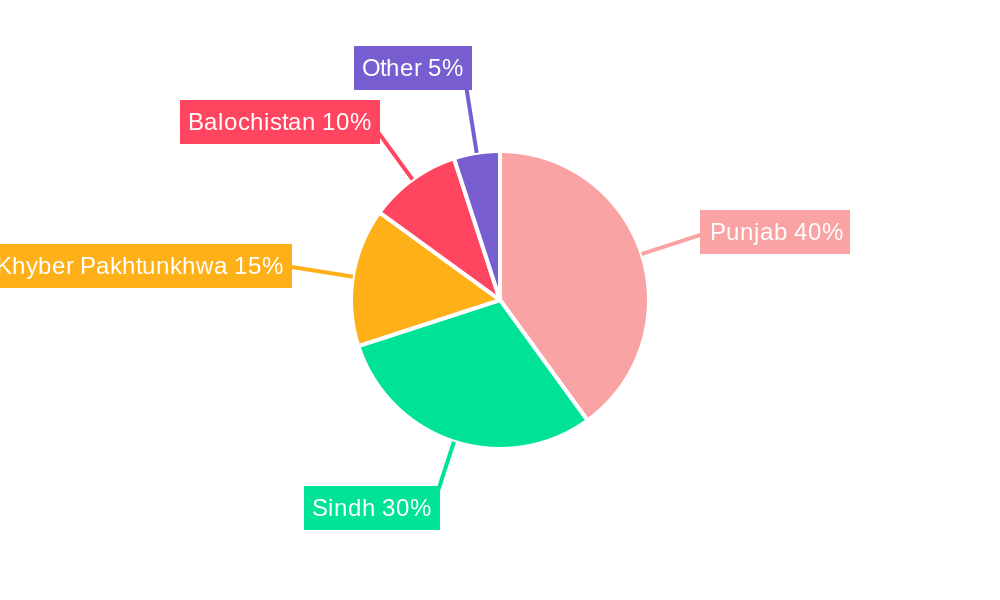
The Pakistani agrochemical market is dominated by the pesticides segment, driven by the prevalence of pest infestations in various crops. Within applications, the grains and cereals segment holds the largest share due to the substantial acreage dedicated to these crops. Punjab province is the leading market due to its extensive agricultural land and high crop production.
- Key Drivers for Pesticides Dominance: High incidence of pest and disease attacks, widespread adoption of chemical control measures.
- Key Drivers for Grains and Cereals Dominance: Large cultivated area, high demand for food grains.
- Key Drivers for Punjab Dominance: Extensive agricultural land, favorable climatic conditions, high agricultural output.
Type:
- Fertilizers: Demand is driven by the need to enhance soil fertility and crop yields. Market size in 2025 is estimated at xx Million.
- Pesticides: Dominates the market due to pest infestations. Market size in 2025 is estimated at xx Million.
- Adjuvants: Growing demand as farmers seek improved efficacy of pesticides and fertilizers. Market size in 2025 is estimated at xx Million.
- Plant Growth Regulators: Increasing adoption driven by the need for higher yields and improved crop quality. Market size in 2025 is estimated at xx Million.
Application:
- Grains and Cereals: Holds the largest market share due to extensive cultivation. Market size in 2025 is estimated at xx Million.
- Pulses and Oilseeds: Significant market, driven by increasing demand for pulses and oilseeds. Market size in 2025 is estimated at xx Million.
- Fruits and Vegetables: Growing segment due to rising consumption of fruits and vegetables. Market size in 2025 is estimated at xx Million.
- Turfs and Ornamentals: A smaller but growing segment driven by landscaping and urban greening initiatives. Market size in 2025 is estimated at xx Million.
- Other Applications: Includes various niche applications with modest market size. Market size in 2025 is estimated at xx Million.
Agro Chemicals in Pakistan Industry Product Innovations
Recent product developments focus on environmentally friendly and high-efficiency formulations. The emphasis is on biopesticides, targeted pest control solutions, and advanced fertilizer technologies that optimize nutrient uptake and reduce environmental impact. These innovations are tailored to address the growing demand for sustainable agricultural practices while improving crop yields and farmer profitability. Companies are investing heavily in R&D to create innovative products that meet the evolving needs of Pakistani farmers.
Report Segmentation & Scope
This report segments the Pakistani agrochemical market by type (Fertilizers, Pesticides, Adjuvants, Plant Growth Regulators) and application (Grains and Cereals, Pulses and Oilseeds, Fruits and Vegetables, Turfs and Ornamentals, Other Applications). Each segment is analyzed in detail, considering its market size, growth projections, and competitive dynamics. The report provides a comprehensive overview of the market, considering historical data (2019-2024), current status (2025), and future forecast (2025-2033).
Key Drivers of Agro Chemicals in Pakistan Industry Growth
Several factors drive the growth of the Pakistani agrochemical market. Increasing food demand due to population growth necessitates higher agricultural output. Government support through subsidies and agricultural extension services boosts adoption. Technological advancements like precision agriculture improve efficiency and resource utilization. Furthermore, climate change necessitates the use of resilient crop varieties and pest management strategies.
Challenges in the Agro Chemicals in Pakistan Industry Sector
The industry faces challenges such as fluctuating weather patterns impacting crop yields and pesticide effectiveness. Supply chain disruptions and high input costs increase production costs. Stringent regulations and environmental concerns necessitate the development and adoption of safer and environmentally benign agrochemicals. Finally, counterfeit products pose a significant threat to the market and consumer safety.
Leading Players in the Agro Chemicals in Pakistan Industry Market
- Welcon Chemicals Pvt Lt
- Evyol Group
- Ali Akbar Group
- Syngenta
- ICI Pakistan Pvt Ltd
- BASF SE
- FMC Corporation
- Pakistan Agro Chemicals Pvt Ltd
- Bayer Ag
Key Developments in Agro Chemicals in Pakistan Industry Sector
- February 2023: Bayer partnered with Kimitec to introduce next-generation biologicals for crop protection and biostimulation. This significantly expands the availability of sustainable solutions.
- February 2021: Engro Fertilizers and BASF SE launched Sefina insecticide, offering a novel mode of action against key pests in cotton and vegetable crops, enhancing pest management efficacy.
- January 2021: Launch of 'HANARO' (Bistrifluron 10% EC) by FarmHannong, supplied by Ayan Crop Science, provided a new tool for whitefly management in cotton cultivation.
Strategic Agro Chemicals in Pakistan Industry Market Outlook
The Pakistani agrochemical market presents significant opportunities for growth and investment. The rising demand for food, government support, and technological advancements will continue to drive market expansion. Strategic focus on sustainable and high-efficiency solutions, coupled with effective supply chain management and product diversification, will be critical for success. The market is expected to witness strong growth in the coming years, presenting lucrative opportunities for both established players and new entrants.
Agro Chemicals in Pakistan Industry Segmentation
- 1. Production Analysis
- 2. Consumption Analysis
- 3. Import Market Analysis (Value & Volume)
- 4. Export Market Analysis (Value & Volume)
- 5. Price Trend Analysis
Agro Chemicals in Pakistan Industry Segmentation By Geography
-
1. North America
- 1.1. United States
- 1.2. Canada
- 1.3. Mexico
-
2. South America
- 2.1. Brazil
- 2.2. Argentina
- 2.3. Rest of South America
-
3. Europe
- 3.1. United Kingdom
- 3.2. Germany
- 3.3. France
- 3.4. Italy
- 3.5. Spain
- 3.6. Russia
- 3.7. Benelux
- 3.8. Nordics
- 3.9. Rest of Europe
-
4. Middle East & Africa
- 4.1. Turkey
- 4.2. Israel
- 4.3. GCC
- 4.4. North Africa
- 4.5. South Africa
- 4.6. Rest of Middle East & Africa
-
5. Asia Pacific
- 5.1. China
- 5.2. India
- 5.3. Japan
- 5.4. South Korea
- 5.5. ASEAN
- 5.6. Oceania
- 5.7. Rest of Asia Pacific
Agro Chemicals in Pakistan Industry REPORT HIGHLIGHTS
| Aspects | Details |
|---|---|
| Study Period | 2019-2033 |
| Base Year | 2024 |
| Estimated Year | 2025 |
| Forecast Period | 2025-2033 |
| Historical Period | 2019-2024 |
| Growth Rate | CAGR of 7.99% from 2019-2033 |
| Segmentation |
|
Table of Contents
- 1. Introduction
- 1.1. Research Scope
- 1.2. Market Segmentation
- 1.3. Research Methodology
- 1.4. Definitions and Assumptions
- 2. Executive Summary
- 2.1. Introduction
- 3. Market Dynamics
- 3.1. Introduction
- 3.2. Market Drivers
- 3.2.1. Increasing Berry Consumption for Health Benefits; Increasing Adoption of High-Technology Farm Practices; Growing Usage of Berries in the Food and Beverage Industries
- 3.3. Market Restrains
- 3.3.1. High Production Cost Involved in Berry Production; Increasing Disease and Pest Infestations
- 3.4. Market Trends
- 3.4.1. Need for Increased Land Productivity
- 4. Market Factor Analysis
- 4.1. Porters Five Forces
- 4.2. Supply/Value Chain
- 4.3. PESTEL analysis
- 4.4. Market Entropy
- 4.5. Patent/Trademark Analysis
- 5. Global Agro Chemicals in Pakistan Industry Analysis, Insights and Forecast, 2019-2031
- 5.1. Market Analysis, Insights and Forecast - by Production Analysis
- 5.2. Market Analysis, Insights and Forecast - by Consumption Analysis
- 5.3. Market Analysis, Insights and Forecast - by Import Market Analysis (Value & Volume)
- 5.4. Market Analysis, Insights and Forecast - by Export Market Analysis (Value & Volume)
- 5.5. Market Analysis, Insights and Forecast - by Price Trend Analysis
- 5.6. Market Analysis, Insights and Forecast - by Region
- 5.6.1. North America
- 5.6.2. South America
- 5.6.3. Europe
- 5.6.4. Middle East & Africa
- 5.6.5. Asia Pacific
- 5.1. Market Analysis, Insights and Forecast - by Production Analysis
- 6. North America Agro Chemicals in Pakistan Industry Analysis, Insights and Forecast, 2019-2031
- 6.1. Market Analysis, Insights and Forecast - by Production Analysis
- 6.2. Market Analysis, Insights and Forecast - by Consumption Analysis
- 6.3. Market Analysis, Insights and Forecast - by Import Market Analysis (Value & Volume)
- 6.4. Market Analysis, Insights and Forecast - by Export Market Analysis (Value & Volume)
- 6.5. Market Analysis, Insights and Forecast - by Price Trend Analysis
- 6.1. Market Analysis, Insights and Forecast - by Production Analysis
- 7. South America Agro Chemicals in Pakistan Industry Analysis, Insights and Forecast, 2019-2031
- 7.1. Market Analysis, Insights and Forecast - by Production Analysis
- 7.2. Market Analysis, Insights and Forecast - by Consumption Analysis
- 7.3. Market Analysis, Insights and Forecast - by Import Market Analysis (Value & Volume)
- 7.4. Market Analysis, Insights and Forecast - by Export Market Analysis (Value & Volume)
- 7.5. Market Analysis, Insights and Forecast - by Price Trend Analysis
- 7.1. Market Analysis, Insights and Forecast - by Production Analysis
- 8. Europe Agro Chemicals in Pakistan Industry Analysis, Insights and Forecast, 2019-2031
- 8.1. Market Analysis, Insights and Forecast - by Production Analysis
- 8.2. Market Analysis, Insights and Forecast - by Consumption Analysis
- 8.3. Market Analysis, Insights and Forecast - by Import Market Analysis (Value & Volume)
- 8.4. Market Analysis, Insights and Forecast - by Export Market Analysis (Value & Volume)
- 8.5. Market Analysis, Insights and Forecast - by Price Trend Analysis
- 8.1. Market Analysis, Insights and Forecast - by Production Analysis
- 9. Middle East & Africa Agro Chemicals in Pakistan Industry Analysis, Insights and Forecast, 2019-2031
- 9.1. Market Analysis, Insights and Forecast - by Production Analysis
- 9.2. Market Analysis, Insights and Forecast - by Consumption Analysis
- 9.3. Market Analysis, Insights and Forecast - by Import Market Analysis (Value & Volume)
- 9.4. Market Analysis, Insights and Forecast - by Export Market Analysis (Value & Volume)
- 9.5. Market Analysis, Insights and Forecast - by Price Trend Analysis
- 9.1. Market Analysis, Insights and Forecast - by Production Analysis
- 10. Asia Pacific Agro Chemicals in Pakistan Industry Analysis, Insights and Forecast, 2019-2031
- 10.1. Market Analysis, Insights and Forecast - by Production Analysis
- 10.2. Market Analysis, Insights and Forecast - by Consumption Analysis
- 10.3. Market Analysis, Insights and Forecast - by Import Market Analysis (Value & Volume)
- 10.4. Market Analysis, Insights and Forecast - by Export Market Analysis (Value & Volume)
- 10.5. Market Analysis, Insights and Forecast - by Price Trend Analysis
- 10.1. Market Analysis, Insights and Forecast - by Production Analysis
- 11. Competitive Analysis
- 11.1. Global Market Share Analysis 2024
- 11.2. Company Profiles
- 11.2.1 Welcon Chemicals Pvt Lt
- 11.2.1.1. Overview
- 11.2.1.2. Products
- 11.2.1.3. SWOT Analysis
- 11.2.1.4. Recent Developments
- 11.2.1.5. Financials (Based on Availability)
- 11.2.2 Evyol Group
- 11.2.2.1. Overview
- 11.2.2.2. Products
- 11.2.2.3. SWOT Analysis
- 11.2.2.4. Recent Developments
- 11.2.2.5. Financials (Based on Availability)
- 11.2.3 Ali Akbar Group
- 11.2.3.1. Overview
- 11.2.3.2. Products
- 11.2.3.3. SWOT Analysis
- 11.2.3.4. Recent Developments
- 11.2.3.5. Financials (Based on Availability)
- 11.2.4 Syngenta
- 11.2.4.1. Overview
- 11.2.4.2. Products
- 11.2.4.3. SWOT Analysis
- 11.2.4.4. Recent Developments
- 11.2.4.5. Financials (Based on Availability)
- 11.2.5 ICI Pakistan Pvt Ltd
- 11.2.5.1. Overview
- 11.2.5.2. Products
- 11.2.5.3. SWOT Analysis
- 11.2.5.4. Recent Developments
- 11.2.5.5. Financials (Based on Availability)
- 11.2.6 BASF SE
- 11.2.6.1. Overview
- 11.2.6.2. Products
- 11.2.6.3. SWOT Analysis
- 11.2.6.4. Recent Developments
- 11.2.6.5. Financials (Based on Availability)
- 11.2.7 FMC Corporation
- 11.2.7.1. Overview
- 11.2.7.2. Products
- 11.2.7.3. SWOT Analysis
- 11.2.7.4. Recent Developments
- 11.2.7.5. Financials (Based on Availability)
- 11.2.8 Pakistan Agro Chemicals Pvt Ltd
- 11.2.8.1. Overview
- 11.2.8.2. Products
- 11.2.8.3. SWOT Analysis
- 11.2.8.4. Recent Developments
- 11.2.8.5. Financials (Based on Availability)
- 11.2.9 Bayer Ag
- 11.2.9.1. Overview
- 11.2.9.2. Products
- 11.2.9.3. SWOT Analysis
- 11.2.9.4. Recent Developments
- 11.2.9.5. Financials (Based on Availability)
- 11.2.1 Welcon Chemicals Pvt Lt
List of Figures
- Figure 1: Global Agro Chemicals in Pakistan Industry Revenue Breakdown (Million, %) by Region 2024 & 2032
- Figure 2: Pakistan Agro Chemicals in Pakistan Industry Revenue (Million), by Country 2024 & 2032
- Figure 3: Pakistan Agro Chemicals in Pakistan Industry Revenue Share (%), by Country 2024 & 2032
- Figure 4: North America Agro Chemicals in Pakistan Industry Revenue (Million), by Production Analysis 2024 & 2032
- Figure 5: North America Agro Chemicals in Pakistan Industry Revenue Share (%), by Production Analysis 2024 & 2032
- Figure 6: North America Agro Chemicals in Pakistan Industry Revenue (Million), by Consumption Analysis 2024 & 2032
- Figure 7: North America Agro Chemicals in Pakistan Industry Revenue Share (%), by Consumption Analysis 2024 & 2032
- Figure 8: North America Agro Chemicals in Pakistan Industry Revenue (Million), by Import Market Analysis (Value & Volume) 2024 & 2032
- Figure 9: North America Agro Chemicals in Pakistan Industry Revenue Share (%), by Import Market Analysis (Value & Volume) 2024 & 2032
- Figure 10: North America Agro Chemicals in Pakistan Industry Revenue (Million), by Export Market Analysis (Value & Volume) 2024 & 2032
- Figure 11: North America Agro Chemicals in Pakistan Industry Revenue Share (%), by Export Market Analysis (Value & Volume) 2024 & 2032
- Figure 12: North America Agro Chemicals in Pakistan Industry Revenue (Million), by Price Trend Analysis 2024 & 2032
- Figure 13: North America Agro Chemicals in Pakistan Industry Revenue Share (%), by Price Trend Analysis 2024 & 2032
- Figure 14: North America Agro Chemicals in Pakistan Industry Revenue (Million), by Country 2024 & 2032
- Figure 15: North America Agro Chemicals in Pakistan Industry Revenue Share (%), by Country 2024 & 2032
- Figure 16: South America Agro Chemicals in Pakistan Industry Revenue (Million), by Production Analysis 2024 & 2032
- Figure 17: South America Agro Chemicals in Pakistan Industry Revenue Share (%), by Production Analysis 2024 & 2032
- Figure 18: South America Agro Chemicals in Pakistan Industry Revenue (Million), by Consumption Analysis 2024 & 2032
- Figure 19: South America Agro Chemicals in Pakistan Industry Revenue Share (%), by Consumption Analysis 2024 & 2032
- Figure 20: South America Agro Chemicals in Pakistan Industry Revenue (Million), by Import Market Analysis (Value & Volume) 2024 & 2032
- Figure 21: South America Agro Chemicals in Pakistan Industry Revenue Share (%), by Import Market Analysis (Value & Volume) 2024 & 2032
- Figure 22: South America Agro Chemicals in Pakistan Industry Revenue (Million), by Export Market Analysis (Value & Volume) 2024 & 2032
- Figure 23: South America Agro Chemicals in Pakistan Industry Revenue Share (%), by Export Market Analysis (Value & Volume) 2024 & 2032
- Figure 24: South America Agro Chemicals in Pakistan Industry Revenue (Million), by Price Trend Analysis 2024 & 2032
- Figure 25: South America Agro Chemicals in Pakistan Industry Revenue Share (%), by Price Trend Analysis 2024 & 2032
- Figure 26: South America Agro Chemicals in Pakistan Industry Revenue (Million), by Country 2024 & 2032
- Figure 27: South America Agro Chemicals in Pakistan Industry Revenue Share (%), by Country 2024 & 2032
- Figure 28: Europe Agro Chemicals in Pakistan Industry Revenue (Million), by Production Analysis 2024 & 2032
- Figure 29: Europe Agro Chemicals in Pakistan Industry Revenue Share (%), by Production Analysis 2024 & 2032
- Figure 30: Europe Agro Chemicals in Pakistan Industry Revenue (Million), by Consumption Analysis 2024 & 2032
- Figure 31: Europe Agro Chemicals in Pakistan Industry Revenue Share (%), by Consumption Analysis 2024 & 2032
- Figure 32: Europe Agro Chemicals in Pakistan Industry Revenue (Million), by Import Market Analysis (Value & Volume) 2024 & 2032
- Figure 33: Europe Agro Chemicals in Pakistan Industry Revenue Share (%), by Import Market Analysis (Value & Volume) 2024 & 2032
- Figure 34: Europe Agro Chemicals in Pakistan Industry Revenue (Million), by Export Market Analysis (Value & Volume) 2024 & 2032
- Figure 35: Europe Agro Chemicals in Pakistan Industry Revenue Share (%), by Export Market Analysis (Value & Volume) 2024 & 2032
- Figure 36: Europe Agro Chemicals in Pakistan Industry Revenue (Million), by Price Trend Analysis 2024 & 2032
- Figure 37: Europe Agro Chemicals in Pakistan Industry Revenue Share (%), by Price Trend Analysis 2024 & 2032
- Figure 38: Europe Agro Chemicals in Pakistan Industry Revenue (Million), by Country 2024 & 2032
- Figure 39: Europe Agro Chemicals in Pakistan Industry Revenue Share (%), by Country 2024 & 2032
- Figure 40: Middle East & Africa Agro Chemicals in Pakistan Industry Revenue (Million), by Production Analysis 2024 & 2032
- Figure 41: Middle East & Africa Agro Chemicals in Pakistan Industry Revenue Share (%), by Production Analysis 2024 & 2032
- Figure 42: Middle East & Africa Agro Chemicals in Pakistan Industry Revenue (Million), by Consumption Analysis 2024 & 2032
- Figure 43: Middle East & Africa Agro Chemicals in Pakistan Industry Revenue Share (%), by Consumption Analysis 2024 & 2032
- Figure 44: Middle East & Africa Agro Chemicals in Pakistan Industry Revenue (Million), by Import Market Analysis (Value & Volume) 2024 & 2032
- Figure 45: Middle East & Africa Agro Chemicals in Pakistan Industry Revenue Share (%), by Import Market Analysis (Value & Volume) 2024 & 2032
- Figure 46: Middle East & Africa Agro Chemicals in Pakistan Industry Revenue (Million), by Export Market Analysis (Value & Volume) 2024 & 2032
- Figure 47: Middle East & Africa Agro Chemicals in Pakistan Industry Revenue Share (%), by Export Market Analysis (Value & Volume) 2024 & 2032
- Figure 48: Middle East & Africa Agro Chemicals in Pakistan Industry Revenue (Million), by Price Trend Analysis 2024 & 2032
- Figure 49: Middle East & Africa Agro Chemicals in Pakistan Industry Revenue Share (%), by Price Trend Analysis 2024 & 2032
- Figure 50: Middle East & Africa Agro Chemicals in Pakistan Industry Revenue (Million), by Country 2024 & 2032
- Figure 51: Middle East & Africa Agro Chemicals in Pakistan Industry Revenue Share (%), by Country 2024 & 2032
- Figure 52: Asia Pacific Agro Chemicals in Pakistan Industry Revenue (Million), by Production Analysis 2024 & 2032
- Figure 53: Asia Pacific Agro Chemicals in Pakistan Industry Revenue Share (%), by Production Analysis 2024 & 2032
- Figure 54: Asia Pacific Agro Chemicals in Pakistan Industry Revenue (Million), by Consumption Analysis 2024 & 2032
- Figure 55: Asia Pacific Agro Chemicals in Pakistan Industry Revenue Share (%), by Consumption Analysis 2024 & 2032
- Figure 56: Asia Pacific Agro Chemicals in Pakistan Industry Revenue (Million), by Import Market Analysis (Value & Volume) 2024 & 2032
- Figure 57: Asia Pacific Agro Chemicals in Pakistan Industry Revenue Share (%), by Import Market Analysis (Value & Volume) 2024 & 2032
- Figure 58: Asia Pacific Agro Chemicals in Pakistan Industry Revenue (Million), by Export Market Analysis (Value & Volume) 2024 & 2032
- Figure 59: Asia Pacific Agro Chemicals in Pakistan Industry Revenue Share (%), by Export Market Analysis (Value & Volume) 2024 & 2032
- Figure 60: Asia Pacific Agro Chemicals in Pakistan Industry Revenue (Million), by Price Trend Analysis 2024 & 2032
- Figure 61: Asia Pacific Agro Chemicals in Pakistan Industry Revenue Share (%), by Price Trend Analysis 2024 & 2032
- Figure 62: Asia Pacific Agro Chemicals in Pakistan Industry Revenue (Million), by Country 2024 & 2032
- Figure 63: Asia Pacific Agro Chemicals in Pakistan Industry Revenue Share (%), by Country 2024 & 2032
List of Tables
- Table 1: Global Agro Chemicals in Pakistan Industry Revenue Million Forecast, by Region 2019 & 2032
- Table 2: Global Agro Chemicals in Pakistan Industry Revenue Million Forecast, by Production Analysis 2019 & 2032
- Table 3: Global Agro Chemicals in Pakistan Industry Revenue Million Forecast, by Consumption Analysis 2019 & 2032
- Table 4: Global Agro Chemicals in Pakistan Industry Revenue Million Forecast, by Import Market Analysis (Value & Volume) 2019 & 2032
- Table 5: Global Agro Chemicals in Pakistan Industry Revenue Million Forecast, by Export Market Analysis (Value & Volume) 2019 & 2032
- Table 6: Global Agro Chemicals in Pakistan Industry Revenue Million Forecast, by Price Trend Analysis 2019 & 2032
- Table 7: Global Agro Chemicals in Pakistan Industry Revenue Million Forecast, by Region 2019 & 2032
- Table 8: Global Agro Chemicals in Pakistan Industry Revenue Million Forecast, by Country 2019 & 2032
- Table 9: Global Agro Chemicals in Pakistan Industry Revenue Million Forecast, by Production Analysis 2019 & 2032
- Table 10: Global Agro Chemicals in Pakistan Industry Revenue Million Forecast, by Consumption Analysis 2019 & 2032
- Table 11: Global Agro Chemicals in Pakistan Industry Revenue Million Forecast, by Import Market Analysis (Value & Volume) 2019 & 2032
- Table 12: Global Agro Chemicals in Pakistan Industry Revenue Million Forecast, by Export Market Analysis (Value & Volume) 2019 & 2032
- Table 13: Global Agro Chemicals in Pakistan Industry Revenue Million Forecast, by Price Trend Analysis 2019 & 2032
- Table 14: Global Agro Chemicals in Pakistan Industry Revenue Million Forecast, by Country 2019 & 2032
- Table 15: United States Agro Chemicals in Pakistan Industry Revenue (Million) Forecast, by Application 2019 & 2032
- Table 16: Canada Agro Chemicals in Pakistan Industry Revenue (Million) Forecast, by Application 2019 & 2032
- Table 17: Mexico Agro Chemicals in Pakistan Industry Revenue (Million) Forecast, by Application 2019 & 2032
- Table 18: Global Agro Chemicals in Pakistan Industry Revenue Million Forecast, by Production Analysis 2019 & 2032
- Table 19: Global Agro Chemicals in Pakistan Industry Revenue Million Forecast, by Consumption Analysis 2019 & 2032
- Table 20: Global Agro Chemicals in Pakistan Industry Revenue Million Forecast, by Import Market Analysis (Value & Volume) 2019 & 2032
- Table 21: Global Agro Chemicals in Pakistan Industry Revenue Million Forecast, by Export Market Analysis (Value & Volume) 2019 & 2032
- Table 22: Global Agro Chemicals in Pakistan Industry Revenue Million Forecast, by Price Trend Analysis 2019 & 2032
- Table 23: Global Agro Chemicals in Pakistan Industry Revenue Million Forecast, by Country 2019 & 2032
- Table 24: Brazil Agro Chemicals in Pakistan Industry Revenue (Million) Forecast, by Application 2019 & 2032
- Table 25: Argentina Agro Chemicals in Pakistan Industry Revenue (Million) Forecast, by Application 2019 & 2032
- Table 26: Rest of South America Agro Chemicals in Pakistan Industry Revenue (Million) Forecast, by Application 2019 & 2032
- Table 27: Global Agro Chemicals in Pakistan Industry Revenue Million Forecast, by Production Analysis 2019 & 2032
- Table 28: Global Agro Chemicals in Pakistan Industry Revenue Million Forecast, by Consumption Analysis 2019 & 2032
- Table 29: Global Agro Chemicals in Pakistan Industry Revenue Million Forecast, by Import Market Analysis (Value & Volume) 2019 & 2032
- Table 30: Global Agro Chemicals in Pakistan Industry Revenue Million Forecast, by Export Market Analysis (Value & Volume) 2019 & 2032
- Table 31: Global Agro Chemicals in Pakistan Industry Revenue Million Forecast, by Price Trend Analysis 2019 & 2032
- Table 32: Global Agro Chemicals in Pakistan Industry Revenue Million Forecast, by Country 2019 & 2032
- Table 33: United Kingdom Agro Chemicals in Pakistan Industry Revenue (Million) Forecast, by Application 2019 & 2032
- Table 34: Germany Agro Chemicals in Pakistan Industry Revenue (Million) Forecast, by Application 2019 & 2032
- Table 35: France Agro Chemicals in Pakistan Industry Revenue (Million) Forecast, by Application 2019 & 2032
- Table 36: Italy Agro Chemicals in Pakistan Industry Revenue (Million) Forecast, by Application 2019 & 2032
- Table 37: Spain Agro Chemicals in Pakistan Industry Revenue (Million) Forecast, by Application 2019 & 2032
- Table 38: Russia Agro Chemicals in Pakistan Industry Revenue (Million) Forecast, by Application 2019 & 2032
- Table 39: Benelux Agro Chemicals in Pakistan Industry Revenue (Million) Forecast, by Application 2019 & 2032
- Table 40: Nordics Agro Chemicals in Pakistan Industry Revenue (Million) Forecast, by Application 2019 & 2032
- Table 41: Rest of Europe Agro Chemicals in Pakistan Industry Revenue (Million) Forecast, by Application 2019 & 2032
- Table 42: Global Agro Chemicals in Pakistan Industry Revenue Million Forecast, by Production Analysis 2019 & 2032
- Table 43: Global Agro Chemicals in Pakistan Industry Revenue Million Forecast, by Consumption Analysis 2019 & 2032
- Table 44: Global Agro Chemicals in Pakistan Industry Revenue Million Forecast, by Import Market Analysis (Value & Volume) 2019 & 2032
- Table 45: Global Agro Chemicals in Pakistan Industry Revenue Million Forecast, by Export Market Analysis (Value & Volume) 2019 & 2032
- Table 46: Global Agro Chemicals in Pakistan Industry Revenue Million Forecast, by Price Trend Analysis 2019 & 2032
- Table 47: Global Agro Chemicals in Pakistan Industry Revenue Million Forecast, by Country 2019 & 2032
- Table 48: Turkey Agro Chemicals in Pakistan Industry Revenue (Million) Forecast, by Application 2019 & 2032
- Table 49: Israel Agro Chemicals in Pakistan Industry Revenue (Million) Forecast, by Application 2019 & 2032
- Table 50: GCC Agro Chemicals in Pakistan Industry Revenue (Million) Forecast, by Application 2019 & 2032
- Table 51: North Africa Agro Chemicals in Pakistan Industry Revenue (Million) Forecast, by Application 2019 & 2032
- Table 52: South Africa Agro Chemicals in Pakistan Industry Revenue (Million) Forecast, by Application 2019 & 2032
- Table 53: Rest of Middle East & Africa Agro Chemicals in Pakistan Industry Revenue (Million) Forecast, by Application 2019 & 2032
- Table 54: Global Agro Chemicals in Pakistan Industry Revenue Million Forecast, by Production Analysis 2019 & 2032
- Table 55: Global Agro Chemicals in Pakistan Industry Revenue Million Forecast, by Consumption Analysis 2019 & 2032
- Table 56: Global Agro Chemicals in Pakistan Industry Revenue Million Forecast, by Import Market Analysis (Value & Volume) 2019 & 2032
- Table 57: Global Agro Chemicals in Pakistan Industry Revenue Million Forecast, by Export Market Analysis (Value & Volume) 2019 & 2032
- Table 58: Global Agro Chemicals in Pakistan Industry Revenue Million Forecast, by Price Trend Analysis 2019 & 2032
- Table 59: Global Agro Chemicals in Pakistan Industry Revenue Million Forecast, by Country 2019 & 2032
- Table 60: China Agro Chemicals in Pakistan Industry Revenue (Million) Forecast, by Application 2019 & 2032
- Table 61: India Agro Chemicals in Pakistan Industry Revenue (Million) Forecast, by Application 2019 & 2032
- Table 62: Japan Agro Chemicals in Pakistan Industry Revenue (Million) Forecast, by Application 2019 & 2032
- Table 63: South Korea Agro Chemicals in Pakistan Industry Revenue (Million) Forecast, by Application 2019 & 2032
- Table 64: ASEAN Agro Chemicals in Pakistan Industry Revenue (Million) Forecast, by Application 2019 & 2032
- Table 65: Oceania Agro Chemicals in Pakistan Industry Revenue (Million) Forecast, by Application 2019 & 2032
- Table 66: Rest of Asia Pacific Agro Chemicals in Pakistan Industry Revenue (Million) Forecast, by Application 2019 & 2032
Frequently Asked Questions
1. What is the projected Compound Annual Growth Rate (CAGR) of the Agro Chemicals in Pakistan Industry?
The projected CAGR is approximately 7.99%.
2. Which companies are prominent players in the Agro Chemicals in Pakistan Industry?
Key companies in the market include Welcon Chemicals Pvt Lt, Evyol Group, Ali Akbar Group, Syngenta, ICI Pakistan Pvt Ltd, BASF SE, FMC Corporation, Pakistan Agro Chemicals Pvt Ltd, Bayer Ag.
3. What are the main segments of the Agro Chemicals in Pakistan Industry?
The market segments include Production Analysis, Consumption Analysis, Import Market Analysis (Value & Volume), Export Market Analysis (Value & Volume), Price Trend Analysis.
4. Can you provide details about the market size?
The market size is estimated to be USD 345.59 Million as of 2022.
5. What are some drivers contributing to market growth?
Increasing Berry Consumption for Health Benefits; Increasing Adoption of High-Technology Farm Practices; Growing Usage of Berries in the Food and Beverage Industries.
6. What are the notable trends driving market growth?
Need for Increased Land Productivity.
7. Are there any restraints impacting market growth?
High Production Cost Involved in Berry Production; Increasing Disease and Pest Infestations.
8. Can you provide examples of recent developments in the market?
February 2023: Bayer partnered with Kimitec to bring the next generation of biologicals to millions of growers worldwide. This includes crop protection and biostimulant products based on molecules derived from natural sources.
9. What pricing options are available for accessing the report?
Pricing options include single-user, multi-user, and enterprise licenses priced at USD 3800, USD 4500, and USD 5800 respectively.
10. Is the market size provided in terms of value or volume?
The market size is provided in terms of value, measured in Million.
11. Are there any specific market keywords associated with the report?
Yes, the market keyword associated with the report is "Agro Chemicals in Pakistan Industry," which aids in identifying and referencing the specific market segment covered.
12. How do I determine which pricing option suits my needs best?
The pricing options vary based on user requirements and access needs. Individual users may opt for single-user licenses, while businesses requiring broader access may choose multi-user or enterprise licenses for cost-effective access to the report.
13. Are there any additional resources or data provided in the Agro Chemicals in Pakistan Industry report?
While the report offers comprehensive insights, it's advisable to review the specific contents or supplementary materials provided to ascertain if additional resources or data are available.
14. How can I stay updated on further developments or reports in the Agro Chemicals in Pakistan Industry?
To stay informed about further developments, trends, and reports in the Agro Chemicals in Pakistan Industry, consider subscribing to industry newsletters, following relevant companies and organizations, or regularly checking reputable industry news sources and publications.
Methodology
Step 1 - Identification of Relevant Samples Size from Population Database


Step 2 - Approaches for Defining Global Market Size (Value, Volume* & Price*)

Note*: In applicable scenarios
Step 3 - Data Sources
Primary Research
- Web Analytics
- Survey Reports
- Research Institute
- Latest Research Reports
- Opinion Leaders
Secondary Research
- Annual Reports
- White Paper
- Latest Press Release
- Industry Association
- Paid Database
- Investor Presentations

Step 4 - Data Triangulation
Involves using different sources of information in order to increase the validity of a study
These sources are likely to be stakeholders in a program - participants, other researchers, program staff, other community members, and so on.
Then we put all data in single framework & apply various statistical tools to find out the dynamic on the market.
During the analysis stage, feedback from the stakeholder groups would be compared to determine areas of agreement as well as areas of divergence


