
Key Insights
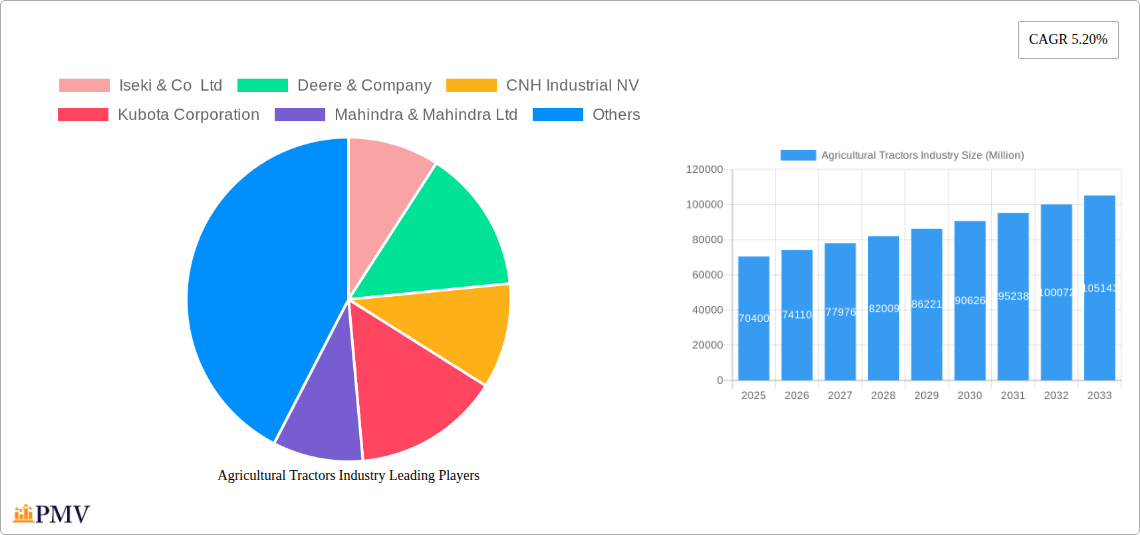
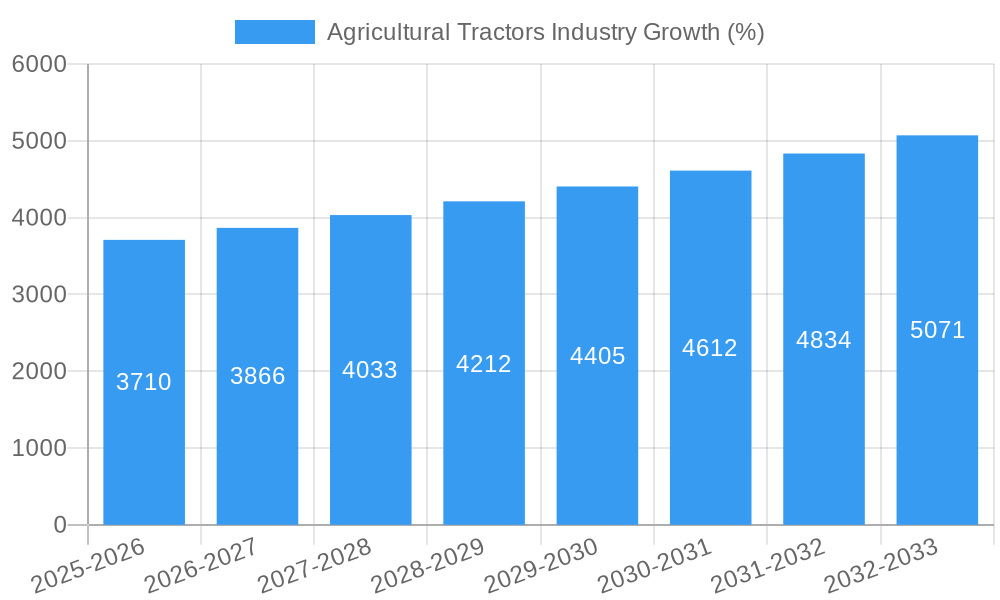
The global agricultural tractor market, valued at $70.40 billion in 2025, is projected to experience robust growth, driven by several key factors. Rising global food demand necessitates increased agricultural productivity, fueling the adoption of modern, high-horsepower tractors. Technological advancements, such as precision farming techniques and automated systems integrated into tractors, are significantly enhancing efficiency and yield, further stimulating market expansion. Government initiatives promoting agricultural modernization and mechanization in developing economies are also contributing to this growth. Furthermore, the increasing adoption of larger horsepower tractors for large-scale farming operations and specialized tractors for diverse agricultural applications (like orchard and row-crop tractors) are diversifying market segments and propelling market expansion. The market's growth trajectory is influenced by factors such as fluctuating fuel prices, the availability of skilled labor, and evolving environmental regulations. Despite these potential restraints, the long-term outlook remains positive, with the market projected to maintain a healthy Compound Annual Growth Rate (CAGR) of 5.20% from 2025 to 2033.
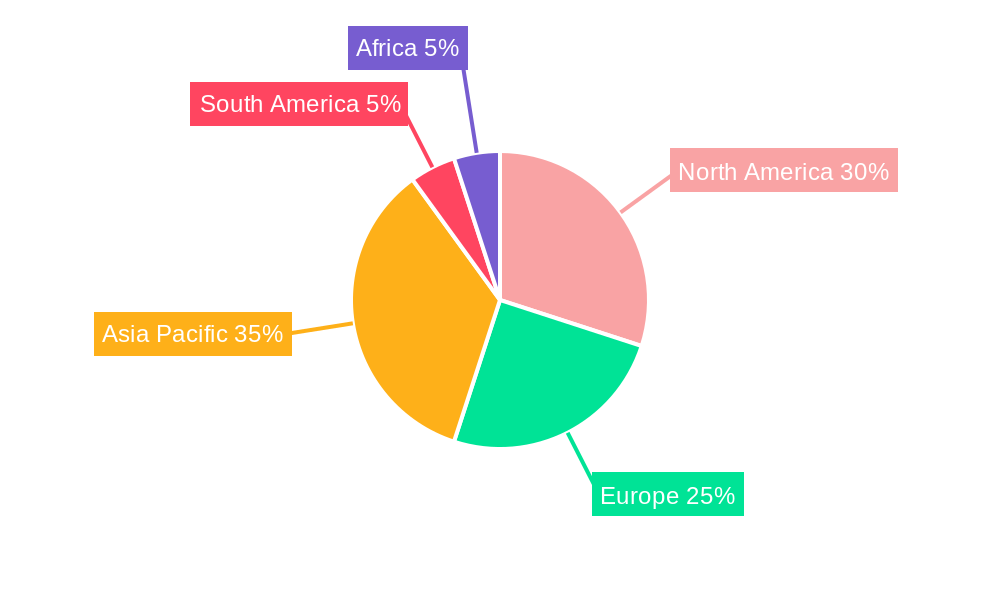
Market segmentation reveals significant opportunities across various horsepower categories and tractor types. High-horsepower tractors (above 200 HP) are witnessing increasing demand due to the trend towards large-scale farming, while the demand for specialized tractors, such as orchard and row-crop tractors, is also increasing to meet specific agricultural needs. Regionally, North America and Europe currently hold substantial market share, driven by established agricultural practices and advanced farming technologies. However, rapid growth is anticipated in the Asia-Pacific region, particularly in India and China, due to the expanding agricultural sector and government support for agricultural modernization. Major players like Deere & Company, Kubota Corporation, and Mahindra & Mahindra Ltd are actively shaping market dynamics through strategic innovations, expansions, and mergers and acquisitions, further intensifying competition and driving market evolution.
Agricultural Tractors Industry: A Comprehensive Market Report (2019-2033)
This detailed report provides a comprehensive analysis of the global agricultural tractors industry, covering market size, segmentation, competitive landscape, key trends, and future growth prospects. With a study period spanning 2019-2033, a base year of 2025, and a forecast period of 2025-2033, this report offers invaluable insights for industry stakeholders, investors, and researchers. The report utilizes data from the historical period (2019-2024) and incorporates the latest industry developments to provide a robust and reliable forecast. The market is valued in Millions.
Agricultural Tractors Industry Market Structure & Competitive Dynamics
The global agricultural tractors market is characterized by a moderately concentrated structure, with several key players holding significant market share. The competitive landscape is dynamic, driven by continuous innovation, strategic mergers and acquisitions (M&A), and evolving regulatory frameworks. Key players like Deere & Company, CNH Industrial NV, and Kubota Corporation consistently invest in research and development (R&D) to enhance tractor efficiency, fuel economy, and technological integration. The market also witnesses substantial M&A activity, with deal values exceeding xx Million in recent years, indicating strategic consolidation and expansion efforts. Product substitution, particularly from smaller, specialized tractors to larger, more versatile models, is another key factor shaping the market. Furthermore, evolving end-user trends, such as increased adoption of precision farming techniques and demand for technologically advanced tractors, influence market dynamics.
- Market Concentration: Moderately concentrated, with top 5 players holding approximately xx% market share in 2024.
- Innovation Ecosystems: Strong R&D investments by major players, fostering technological advancements in areas like automation and precision farming.
- Regulatory Frameworks: Varying regulations across regions influence market access and product specifications.
- Product Substitutes: Competition from smaller, specialized tractors and alternative tillage methods.
- End-User Trends: Growing demand for fuel-efficient, technologically advanced tractors with precision farming capabilities.
- M&A Activities: Significant M&A activity with deal values exceeding xx Million in the past five years.
Agricultural Tractors Industry Industry Trends & Insights
The global agricultural tractors market is experiencing robust growth, driven by several key factors. Rising global food demand, coupled with increasing farm sizes and the need for improved agricultural productivity, fuels the demand for efficient and technologically advanced tractors. Technological disruptions, including the integration of precision farming technologies, automation, and data analytics, significantly enhance farming efficiency and optimize resource utilization, contributing to market growth. Consumer preferences are shifting towards tractors with improved fuel efficiency, enhanced operator comfort, and advanced features. The CAGR for the agricultural tractors market is projected at xx% during the forecast period (2025-2033), with market penetration increasing steadily in developing economies. Competitive dynamics, characterized by product differentiation, technological innovation, and strategic partnerships, further shape the market landscape.
Dominant Markets & Segments in Agricultural Tractors Industry
The agricultural tractors market exhibits regional variations in dominance and segment performance. While data on specific regional dominance is unavailable, the segments with the highest growth potential and existing market share will be detailed here.
By Horsepower:
- 40 HP to 99 HP: This segment holds a substantial market share, driven by its versatility and suitability for a wide range of farming operations. Key drivers include affordability and widespread acceptance among farmers.
- 100 HP to 150 HP: High demand in large-scale farming operations, driven by efficiency and higher productivity.
- Greater than 350 HP: Significant growth potential in specialized applications and large farms, fueled by technological advancements and efficiency gains.
By Type:
- Row-crop Tractors: This segment dominates the market due to its widespread use in various cropping systems. Growth is driven by increasing acreage under cultivation and demand for higher yields.
- Orchard Tractors: This segment shows moderate growth potential, driven by the expansion of fruit and nut orchards.
- Other Types: This category demonstrates moderate to low growth potential, driven by niche applications and specialized farming practices.
Key Drivers:
- Favorable government policies supporting agricultural mechanization.
- Expanding agricultural land under cultivation.
- Rising investments in agricultural infrastructure.
Agricultural Tractors Industry Product Innovations
Recent years have witnessed significant advancements in agricultural tractor technology, driven by the need for improved efficiency, precision, and sustainability. Key innovations include the integration of GPS-guided systems, automated steering, and telematics for real-time monitoring and data analysis. These innovations improve farming accuracy, reduce resource waste, and optimize operational efficiency. The market is witnessing a shift towards electrically powered and hybrid tractors, contributing to reduced emissions and environmental impact. Furthermore, advanced features like advanced hydraulic systems and improved ergonomics enhance operator comfort and productivity.
Report Segmentation & Scope
This report segments the agricultural tractors market by horsepower (Less than 40 HP, 40 HP to 99 HP, 100 HP to 150 HP, 151 HP to 200 HP, 201 HP to 270 HP, 271 HP to 350 HP, Greater than 350 HP) and by type (Orchard Tractors, Row-crop Tractors, Other Types). Each segment's market size, growth projections, and competitive dynamics are analyzed in detail. For instance, the 40-99 HP segment exhibits high growth potential owing to its affordability and widespread adoption, while the "greater than 350 HP" segment targets large-scale farming and enjoys robust growth due to technological advancements. The Row-crop tractor segment dominates due to its versatility, while the Orchard Tractor segment holds a niche yet significant market share.
Key Drivers of Agricultural Tractors Industry Growth
Several factors propel the growth of the agricultural tractors industry. Firstly, the global population's increasing demand for food necessitates higher agricultural productivity, making tractors crucial for efficient farming. Secondly, technological advancements, such as precision farming technologies and automation, significantly enhance efficiency and yields, driving market demand. Thirdly, favorable government policies and financial incentives in various regions support agricultural mechanization and the adoption of modern farming techniques. Finally, expanding farmlands and infrastructure development in emerging economies further contribute to the market's growth trajectory.
Challenges in the Agricultural Tractors Industry Sector
The agricultural tractors industry faces several challenges. Stricter emission regulations in various regions necessitate higher investment in cleaner technologies and can raise manufacturing costs. Fluctuations in raw material prices and global supply chain disruptions impact production costs and profitability. Intense competition among established players and emerging manufacturers requires continuous innovation and strategic adaptation. The industry also faces challenges related to the affordability and accessibility of technologically advanced tractors, particularly in developing economies. These factors collectively impact the industry's profitability and sustainability.
Leading Players in the Agricultural Tractors Industry Market
- Iseki & Co Ltd
- Deere & Company
- CNH Industrial NV
- Kubota Corporation
- Mahindra & Mahindra Ltd
- Claas KGaA mbH
- Tractors and Farm Equipment Ltd
- AGCO Corporation (Massey Ferguson Limited)
- Yanmar Holdings Co Lt
Key Developments in Agricultural Tractors Industry Sector
- June 2022: Solis Yanmar launched three new tractor models (below 30 HP) for Turkish farms, exported from India. This signifies expansion into new markets and product diversification.
- July 2021: New Holland North America launched the T7 Heavy-duty Tractor with PLM Intelligence, enhancing productivity and multitasking capabilities. This demonstrates the market trend towards technologically advanced tractors.
- November 2022: VST Tillers Tractors Ltd and ZETOR TRACTORS unveiled two new tractors (45 HP and 50 HP) at CII Agro Tech India 2022. This showcases collaborative efforts and the introduction of best-in-class tractors within specific horsepower segments.
Strategic Agricultural Tractors Industry Market Outlook
The future of the agricultural tractors industry is promising, fueled by ongoing technological advancements, increasing food demand, and supportive government policies. Strategic opportunities lie in developing and deploying sustainable, efficient, and technologically advanced tractors that meet the evolving needs of farmers. Further expansion into emerging markets, strategic partnerships, and focus on precision farming technologies will shape future growth. The market is expected to experience consistent growth over the forecast period, with significant potential for innovation and market expansion in developing economies.
Agricultural Tractors Industry Segmentation
- 1. Production Analysis
- 2. Consumption Analysis
- 3. Import Market Analysis (Value & Volume)
- 4. Export Market Analysis (Value & Volume)
- 5. Price Trend Analysis
Agricultural Tractors Industry Segmentation By Geography
-
1. North America
- 1.1. United States
- 1.2. Canada
- 1.3. Mexico
-
2. South America
- 2.1. Brazil
- 2.2. Argentina
- 2.3. Rest of South America
-
3. Europe
- 3.1. United Kingdom
- 3.2. Germany
- 3.3. France
- 3.4. Italy
- 3.5. Spain
- 3.6. Russia
- 3.7. Benelux
- 3.8. Nordics
- 3.9. Rest of Europe
-
4. Middle East & Africa
- 4.1. Turkey
- 4.2. Israel
- 4.3. GCC
- 4.4. North Africa
- 4.5. South Africa
- 4.6. Rest of Middle East & Africa
-
5. Asia Pacific
- 5.1. China
- 5.2. India
- 5.3. Japan
- 5.4. South Korea
- 5.5. ASEAN
- 5.6. Oceania
- 5.7. Rest of Asia Pacific
Agricultural Tractors Industry REPORT HIGHLIGHTS
| Aspects | Details |
|---|---|
| Study Period | 2019-2033 |
| Base Year | 2024 |
| Estimated Year | 2025 |
| Forecast Period | 2025-2033 |
| Historical Period | 2019-2024 |
| Growth Rate | CAGR of 5.20% from 2019-2033 |
| Segmentation |
|
Table of Contents
- 1. Introduction
- 1.1. Research Scope
- 1.2. Market Segmentation
- 1.3. Research Methodology
- 1.4. Definitions and Assumptions
- 2. Executive Summary
- 2.1. Introduction
- 3. Market Dynamics
- 3.1. Introduction
- 3.2. Market Drivers
- 3.2.1. Shortage of Skilled Labor; Government Support to Enhance Farm Mechanization
- 3.3. Market Restrains
- 3.3.1. Heavy Initial Procurement Cost and High Expenditure on Maintenance
- 3.4. Market Trends
- 3.4.1. Increasing Farm Mechanization in Developing Markets
- 4. Market Factor Analysis
- 4.1. Porters Five Forces
- 4.2. Supply/Value Chain
- 4.3. PESTEL analysis
- 4.4. Market Entropy
- 4.5. Patent/Trademark Analysis
- 5. Global Agricultural Tractors Industry Analysis, Insights and Forecast, 2019-2031
- 5.1. Market Analysis, Insights and Forecast - by Production Analysis
- 5.2. Market Analysis, Insights and Forecast - by Consumption Analysis
- 5.3. Market Analysis, Insights and Forecast - by Import Market Analysis (Value & Volume)
- 5.4. Market Analysis, Insights and Forecast - by Export Market Analysis (Value & Volume)
- 5.5. Market Analysis, Insights and Forecast - by Price Trend Analysis
- 5.6. Market Analysis, Insights and Forecast - by Region
- 5.6.1. North America
- 5.6.2. South America
- 5.6.3. Europe
- 5.6.4. Middle East & Africa
- 5.6.5. Asia Pacific
- 5.1. Market Analysis, Insights and Forecast - by Production Analysis
- 6. North America Agricultural Tractors Industry Analysis, Insights and Forecast, 2019-2031
- 6.1. Market Analysis, Insights and Forecast - by Production Analysis
- 6.2. Market Analysis, Insights and Forecast - by Consumption Analysis
- 6.3. Market Analysis, Insights and Forecast - by Import Market Analysis (Value & Volume)
- 6.4. Market Analysis, Insights and Forecast - by Export Market Analysis (Value & Volume)
- 6.5. Market Analysis, Insights and Forecast - by Price Trend Analysis
- 6.1. Market Analysis, Insights and Forecast - by Production Analysis
- 7. South America Agricultural Tractors Industry Analysis, Insights and Forecast, 2019-2031
- 7.1. Market Analysis, Insights and Forecast - by Production Analysis
- 7.2. Market Analysis, Insights and Forecast - by Consumption Analysis
- 7.3. Market Analysis, Insights and Forecast - by Import Market Analysis (Value & Volume)
- 7.4. Market Analysis, Insights and Forecast - by Export Market Analysis (Value & Volume)
- 7.5. Market Analysis, Insights and Forecast - by Price Trend Analysis
- 7.1. Market Analysis, Insights and Forecast - by Production Analysis
- 8. Europe Agricultural Tractors Industry Analysis, Insights and Forecast, 2019-2031
- 8.1. Market Analysis, Insights and Forecast - by Production Analysis
- 8.2. Market Analysis, Insights and Forecast - by Consumption Analysis
- 8.3. Market Analysis, Insights and Forecast - by Import Market Analysis (Value & Volume)
- 8.4. Market Analysis, Insights and Forecast - by Export Market Analysis (Value & Volume)
- 8.5. Market Analysis, Insights and Forecast - by Price Trend Analysis
- 8.1. Market Analysis, Insights and Forecast - by Production Analysis
- 9. Middle East & Africa Agricultural Tractors Industry Analysis, Insights and Forecast, 2019-2031
- 9.1. Market Analysis, Insights and Forecast - by Production Analysis
- 9.2. Market Analysis, Insights and Forecast - by Consumption Analysis
- 9.3. Market Analysis, Insights and Forecast - by Import Market Analysis (Value & Volume)
- 9.4. Market Analysis, Insights and Forecast - by Export Market Analysis (Value & Volume)
- 9.5. Market Analysis, Insights and Forecast - by Price Trend Analysis
- 9.1. Market Analysis, Insights and Forecast - by Production Analysis
- 10. Asia Pacific Agricultural Tractors Industry Analysis, Insights and Forecast, 2019-2031
- 10.1. Market Analysis, Insights and Forecast - by Production Analysis
- 10.2. Market Analysis, Insights and Forecast - by Consumption Analysis
- 10.3. Market Analysis, Insights and Forecast - by Import Market Analysis (Value & Volume)
- 10.4. Market Analysis, Insights and Forecast - by Export Market Analysis (Value & Volume)
- 10.5. Market Analysis, Insights and Forecast - by Price Trend Analysis
- 10.1. Market Analysis, Insights and Forecast - by Production Analysis
- 11. North America Agricultural Tractors Industry Analysis, Insights and Forecast, 2019-2031
- 11.1. Market Analysis, Insights and Forecast - By Country/Sub-region
- 11.1.1 United States
- 11.1.2 Canada
- 11.1.3 Mexico
- 11.1.4 Rest of North America
- 12. Europe Agricultural Tractors Industry Analysis, Insights and Forecast, 2019-2031
- 12.1. Market Analysis, Insights and Forecast - By Country/Sub-region
- 12.1.1 Germany
- 12.1.2 United Kingdom
- 12.1.3 France
- 12.1.4 Spain
- 12.1.5 Italy
- 12.1.6 Russia
- 12.1.7 Poland
- 12.1.8 Rest of Europe
- 13. Asia Pacific Agricultural Tractors Industry Analysis, Insights and Forecast, 2019-2031
- 13.1. Market Analysis, Insights and Forecast - By Country/Sub-region
- 13.1.1 China
- 13.1.2 Japan
- 13.1.3 India
- 13.1.4 Australia
- 13.1.5 Rest of Asia Pacific
- 14. South America Agricultural Tractors Industry Analysis, Insights and Forecast, 2019-2031
- 14.1. Market Analysis, Insights and Forecast - By Country/Sub-region
- 14.1.1 Brazil
- 14.1.2 Argentina
- 14.1.3 Rest of South America
- 15. Africa Agricultural Tractors Industry Analysis, Insights and Forecast, 2019-2031
- 15.1. Market Analysis, Insights and Forecast - By Country/Sub-region
- 15.1.1 South Africa
- 15.1.2 Rest of Africa
- 16. Competitive Analysis
- 16.1. Global Market Share Analysis 2024
- 16.2. Company Profiles
- 16.2.1 Iseki & Co Ltd
- 16.2.1.1. Overview
- 16.2.1.2. Products
- 16.2.1.3. SWOT Analysis
- 16.2.1.4. Recent Developments
- 16.2.1.5. Financials (Based on Availability)
- 16.2.2 Deere & Company
- 16.2.2.1. Overview
- 16.2.2.2. Products
- 16.2.2.3. SWOT Analysis
- 16.2.2.4. Recent Developments
- 16.2.2.5. Financials (Based on Availability)
- 16.2.3 CNH Industrial NV
- 16.2.3.1. Overview
- 16.2.3.2. Products
- 16.2.3.3. SWOT Analysis
- 16.2.3.4. Recent Developments
- 16.2.3.5. Financials (Based on Availability)
- 16.2.4 Kubota Corporation
- 16.2.4.1. Overview
- 16.2.4.2. Products
- 16.2.4.3. SWOT Analysis
- 16.2.4.4. Recent Developments
- 16.2.4.5. Financials (Based on Availability)
- 16.2.5 Mahindra & Mahindra Ltd
- 16.2.5.1. Overview
- 16.2.5.2. Products
- 16.2.5.3. SWOT Analysis
- 16.2.5.4. Recent Developments
- 16.2.5.5. Financials (Based on Availability)
- 16.2.6 Claas KGaA mbH
- 16.2.6.1. Overview
- 16.2.6.2. Products
- 16.2.6.3. SWOT Analysis
- 16.2.6.4. Recent Developments
- 16.2.6.5. Financials (Based on Availability)
- 16.2.7 Tractors and Farm Equipment Ltd
- 16.2.7.1. Overview
- 16.2.7.2. Products
- 16.2.7.3. SWOT Analysis
- 16.2.7.4. Recent Developments
- 16.2.7.5. Financials (Based on Availability)
- 16.2.8 AGCO Corporation (Massey Ferguson Limited)
- 16.2.8.1. Overview
- 16.2.8.2. Products
- 16.2.8.3. SWOT Analysis
- 16.2.8.4. Recent Developments
- 16.2.8.5. Financials (Based on Availability)
- 16.2.9 Yanmar Holdings Co Lt
- 16.2.9.1. Overview
- 16.2.9.2. Products
- 16.2.9.3. SWOT Analysis
- 16.2.9.4. Recent Developments
- 16.2.9.5. Financials (Based on Availability)
- 16.2.1 Iseki & Co Ltd
List of Figures
- Figure 1: Global Agricultural Tractors Industry Revenue Breakdown (Million, %) by Region 2024 & 2032
- Figure 2: North America Agricultural Tractors Industry Revenue (Million), by Country 2024 & 2032
- Figure 3: North America Agricultural Tractors Industry Revenue Share (%), by Country 2024 & 2032
- Figure 4: Europe Agricultural Tractors Industry Revenue (Million), by Country 2024 & 2032
- Figure 5: Europe Agricultural Tractors Industry Revenue Share (%), by Country 2024 & 2032
- Figure 6: Asia Pacific Agricultural Tractors Industry Revenue (Million), by Country 2024 & 2032
- Figure 7: Asia Pacific Agricultural Tractors Industry Revenue Share (%), by Country 2024 & 2032
- Figure 8: South America Agricultural Tractors Industry Revenue (Million), by Country 2024 & 2032
- Figure 9: South America Agricultural Tractors Industry Revenue Share (%), by Country 2024 & 2032
- Figure 10: Africa Agricultural Tractors Industry Revenue (Million), by Country 2024 & 2032
- Figure 11: Africa Agricultural Tractors Industry Revenue Share (%), by Country 2024 & 2032
- Figure 12: North America Agricultural Tractors Industry Revenue (Million), by Production Analysis 2024 & 2032
- Figure 13: North America Agricultural Tractors Industry Revenue Share (%), by Production Analysis 2024 & 2032
- Figure 14: North America Agricultural Tractors Industry Revenue (Million), by Consumption Analysis 2024 & 2032
- Figure 15: North America Agricultural Tractors Industry Revenue Share (%), by Consumption Analysis 2024 & 2032
- Figure 16: North America Agricultural Tractors Industry Revenue (Million), by Import Market Analysis (Value & Volume) 2024 & 2032
- Figure 17: North America Agricultural Tractors Industry Revenue Share (%), by Import Market Analysis (Value & Volume) 2024 & 2032
- Figure 18: North America Agricultural Tractors Industry Revenue (Million), by Export Market Analysis (Value & Volume) 2024 & 2032
- Figure 19: North America Agricultural Tractors Industry Revenue Share (%), by Export Market Analysis (Value & Volume) 2024 & 2032
- Figure 20: North America Agricultural Tractors Industry Revenue (Million), by Price Trend Analysis 2024 & 2032
- Figure 21: North America Agricultural Tractors Industry Revenue Share (%), by Price Trend Analysis 2024 & 2032
- Figure 22: North America Agricultural Tractors Industry Revenue (Million), by Country 2024 & 2032
- Figure 23: North America Agricultural Tractors Industry Revenue Share (%), by Country 2024 & 2032
- Figure 24: South America Agricultural Tractors Industry Revenue (Million), by Production Analysis 2024 & 2032
- Figure 25: South America Agricultural Tractors Industry Revenue Share (%), by Production Analysis 2024 & 2032
- Figure 26: South America Agricultural Tractors Industry Revenue (Million), by Consumption Analysis 2024 & 2032
- Figure 27: South America Agricultural Tractors Industry Revenue Share (%), by Consumption Analysis 2024 & 2032
- Figure 28: South America Agricultural Tractors Industry Revenue (Million), by Import Market Analysis (Value & Volume) 2024 & 2032
- Figure 29: South America Agricultural Tractors Industry Revenue Share (%), by Import Market Analysis (Value & Volume) 2024 & 2032
- Figure 30: South America Agricultural Tractors Industry Revenue (Million), by Export Market Analysis (Value & Volume) 2024 & 2032
- Figure 31: South America Agricultural Tractors Industry Revenue Share (%), by Export Market Analysis (Value & Volume) 2024 & 2032
- Figure 32: South America Agricultural Tractors Industry Revenue (Million), by Price Trend Analysis 2024 & 2032
- Figure 33: South America Agricultural Tractors Industry Revenue Share (%), by Price Trend Analysis 2024 & 2032
- Figure 34: South America Agricultural Tractors Industry Revenue (Million), by Country 2024 & 2032
- Figure 35: South America Agricultural Tractors Industry Revenue Share (%), by Country 2024 & 2032
- Figure 36: Europe Agricultural Tractors Industry Revenue (Million), by Production Analysis 2024 & 2032
- Figure 37: Europe Agricultural Tractors Industry Revenue Share (%), by Production Analysis 2024 & 2032
- Figure 38: Europe Agricultural Tractors Industry Revenue (Million), by Consumption Analysis 2024 & 2032
- Figure 39: Europe Agricultural Tractors Industry Revenue Share (%), by Consumption Analysis 2024 & 2032
- Figure 40: Europe Agricultural Tractors Industry Revenue (Million), by Import Market Analysis (Value & Volume) 2024 & 2032
- Figure 41: Europe Agricultural Tractors Industry Revenue Share (%), by Import Market Analysis (Value & Volume) 2024 & 2032
- Figure 42: Europe Agricultural Tractors Industry Revenue (Million), by Export Market Analysis (Value & Volume) 2024 & 2032
- Figure 43: Europe Agricultural Tractors Industry Revenue Share (%), by Export Market Analysis (Value & Volume) 2024 & 2032
- Figure 44: Europe Agricultural Tractors Industry Revenue (Million), by Price Trend Analysis 2024 & 2032
- Figure 45: Europe Agricultural Tractors Industry Revenue Share (%), by Price Trend Analysis 2024 & 2032
- Figure 46: Europe Agricultural Tractors Industry Revenue (Million), by Country 2024 & 2032
- Figure 47: Europe Agricultural Tractors Industry Revenue Share (%), by Country 2024 & 2032
- Figure 48: Middle East & Africa Agricultural Tractors Industry Revenue (Million), by Production Analysis 2024 & 2032
- Figure 49: Middle East & Africa Agricultural Tractors Industry Revenue Share (%), by Production Analysis 2024 & 2032
- Figure 50: Middle East & Africa Agricultural Tractors Industry Revenue (Million), by Consumption Analysis 2024 & 2032
- Figure 51: Middle East & Africa Agricultural Tractors Industry Revenue Share (%), by Consumption Analysis 2024 & 2032
- Figure 52: Middle East & Africa Agricultural Tractors Industry Revenue (Million), by Import Market Analysis (Value & Volume) 2024 & 2032
- Figure 53: Middle East & Africa Agricultural Tractors Industry Revenue Share (%), by Import Market Analysis (Value & Volume) 2024 & 2032
- Figure 54: Middle East & Africa Agricultural Tractors Industry Revenue (Million), by Export Market Analysis (Value & Volume) 2024 & 2032
- Figure 55: Middle East & Africa Agricultural Tractors Industry Revenue Share (%), by Export Market Analysis (Value & Volume) 2024 & 2032
- Figure 56: Middle East & Africa Agricultural Tractors Industry Revenue (Million), by Price Trend Analysis 2024 & 2032
- Figure 57: Middle East & Africa Agricultural Tractors Industry Revenue Share (%), by Price Trend Analysis 2024 & 2032
- Figure 58: Middle East & Africa Agricultural Tractors Industry Revenue (Million), by Country 2024 & 2032
- Figure 59: Middle East & Africa Agricultural Tractors Industry Revenue Share (%), by Country 2024 & 2032
- Figure 60: Asia Pacific Agricultural Tractors Industry Revenue (Million), by Production Analysis 2024 & 2032
- Figure 61: Asia Pacific Agricultural Tractors Industry Revenue Share (%), by Production Analysis 2024 & 2032
- Figure 62: Asia Pacific Agricultural Tractors Industry Revenue (Million), by Consumption Analysis 2024 & 2032
- Figure 63: Asia Pacific Agricultural Tractors Industry Revenue Share (%), by Consumption Analysis 2024 & 2032
- Figure 64: Asia Pacific Agricultural Tractors Industry Revenue (Million), by Import Market Analysis (Value & Volume) 2024 & 2032
- Figure 65: Asia Pacific Agricultural Tractors Industry Revenue Share (%), by Import Market Analysis (Value & Volume) 2024 & 2032
- Figure 66: Asia Pacific Agricultural Tractors Industry Revenue (Million), by Export Market Analysis (Value & Volume) 2024 & 2032
- Figure 67: Asia Pacific Agricultural Tractors Industry Revenue Share (%), by Export Market Analysis (Value & Volume) 2024 & 2032
- Figure 68: Asia Pacific Agricultural Tractors Industry Revenue (Million), by Price Trend Analysis 2024 & 2032
- Figure 69: Asia Pacific Agricultural Tractors Industry Revenue Share (%), by Price Trend Analysis 2024 & 2032
- Figure 70: Asia Pacific Agricultural Tractors Industry Revenue (Million), by Country 2024 & 2032
- Figure 71: Asia Pacific Agricultural Tractors Industry Revenue Share (%), by Country 2024 & 2032
List of Tables
- Table 1: Global Agricultural Tractors Industry Revenue Million Forecast, by Region 2019 & 2032
- Table 2: Global Agricultural Tractors Industry Revenue Million Forecast, by Production Analysis 2019 & 2032
- Table 3: Global Agricultural Tractors Industry Revenue Million Forecast, by Consumption Analysis 2019 & 2032
- Table 4: Global Agricultural Tractors Industry Revenue Million Forecast, by Import Market Analysis (Value & Volume) 2019 & 2032
- Table 5: Global Agricultural Tractors Industry Revenue Million Forecast, by Export Market Analysis (Value & Volume) 2019 & 2032
- Table 6: Global Agricultural Tractors Industry Revenue Million Forecast, by Price Trend Analysis 2019 & 2032
- Table 7: Global Agricultural Tractors Industry Revenue Million Forecast, by Region 2019 & 2032
- Table 8: Global Agricultural Tractors Industry Revenue Million Forecast, by Country 2019 & 2032
- Table 9: United States Agricultural Tractors Industry Revenue (Million) Forecast, by Application 2019 & 2032
- Table 10: Canada Agricultural Tractors Industry Revenue (Million) Forecast, by Application 2019 & 2032
- Table 11: Mexico Agricultural Tractors Industry Revenue (Million) Forecast, by Application 2019 & 2032
- Table 12: Rest of North America Agricultural Tractors Industry Revenue (Million) Forecast, by Application 2019 & 2032
- Table 13: Global Agricultural Tractors Industry Revenue Million Forecast, by Country 2019 & 2032
- Table 14: Germany Agricultural Tractors Industry Revenue (Million) Forecast, by Application 2019 & 2032
- Table 15: United Kingdom Agricultural Tractors Industry Revenue (Million) Forecast, by Application 2019 & 2032
- Table 16: France Agricultural Tractors Industry Revenue (Million) Forecast, by Application 2019 & 2032
- Table 17: Spain Agricultural Tractors Industry Revenue (Million) Forecast, by Application 2019 & 2032
- Table 18: Italy Agricultural Tractors Industry Revenue (Million) Forecast, by Application 2019 & 2032
- Table 19: Russia Agricultural Tractors Industry Revenue (Million) Forecast, by Application 2019 & 2032
- Table 20: Poland Agricultural Tractors Industry Revenue (Million) Forecast, by Application 2019 & 2032
- Table 21: Rest of Europe Agricultural Tractors Industry Revenue (Million) Forecast, by Application 2019 & 2032
- Table 22: Global Agricultural Tractors Industry Revenue Million Forecast, by Country 2019 & 2032
- Table 23: China Agricultural Tractors Industry Revenue (Million) Forecast, by Application 2019 & 2032
- Table 24: Japan Agricultural Tractors Industry Revenue (Million) Forecast, by Application 2019 & 2032
- Table 25: India Agricultural Tractors Industry Revenue (Million) Forecast, by Application 2019 & 2032
- Table 26: Australia Agricultural Tractors Industry Revenue (Million) Forecast, by Application 2019 & 2032
- Table 27: Rest of Asia Pacific Agricultural Tractors Industry Revenue (Million) Forecast, by Application 2019 & 2032
- Table 28: Global Agricultural Tractors Industry Revenue Million Forecast, by Country 2019 & 2032
- Table 29: Brazil Agricultural Tractors Industry Revenue (Million) Forecast, by Application 2019 & 2032
- Table 30: Argentina Agricultural Tractors Industry Revenue (Million) Forecast, by Application 2019 & 2032
- Table 31: Rest of South America Agricultural Tractors Industry Revenue (Million) Forecast, by Application 2019 & 2032
- Table 32: Global Agricultural Tractors Industry Revenue Million Forecast, by Country 2019 & 2032
- Table 33: South Africa Agricultural Tractors Industry Revenue (Million) Forecast, by Application 2019 & 2032
- Table 34: Rest of Africa Agricultural Tractors Industry Revenue (Million) Forecast, by Application 2019 & 2032
- Table 35: Global Agricultural Tractors Industry Revenue Million Forecast, by Production Analysis 2019 & 2032
- Table 36: Global Agricultural Tractors Industry Revenue Million Forecast, by Consumption Analysis 2019 & 2032
- Table 37: Global Agricultural Tractors Industry Revenue Million Forecast, by Import Market Analysis (Value & Volume) 2019 & 2032
- Table 38: Global Agricultural Tractors Industry Revenue Million Forecast, by Export Market Analysis (Value & Volume) 2019 & 2032
- Table 39: Global Agricultural Tractors Industry Revenue Million Forecast, by Price Trend Analysis 2019 & 2032
- Table 40: Global Agricultural Tractors Industry Revenue Million Forecast, by Country 2019 & 2032
- Table 41: United States Agricultural Tractors Industry Revenue (Million) Forecast, by Application 2019 & 2032
- Table 42: Canada Agricultural Tractors Industry Revenue (Million) Forecast, by Application 2019 & 2032
- Table 43: Mexico Agricultural Tractors Industry Revenue (Million) Forecast, by Application 2019 & 2032
- Table 44: Global Agricultural Tractors Industry Revenue Million Forecast, by Production Analysis 2019 & 2032
- Table 45: Global Agricultural Tractors Industry Revenue Million Forecast, by Consumption Analysis 2019 & 2032
- Table 46: Global Agricultural Tractors Industry Revenue Million Forecast, by Import Market Analysis (Value & Volume) 2019 & 2032
- Table 47: Global Agricultural Tractors Industry Revenue Million Forecast, by Export Market Analysis (Value & Volume) 2019 & 2032
- Table 48: Global Agricultural Tractors Industry Revenue Million Forecast, by Price Trend Analysis 2019 & 2032
- Table 49: Global Agricultural Tractors Industry Revenue Million Forecast, by Country 2019 & 2032
- Table 50: Brazil Agricultural Tractors Industry Revenue (Million) Forecast, by Application 2019 & 2032
- Table 51: Argentina Agricultural Tractors Industry Revenue (Million) Forecast, by Application 2019 & 2032
- Table 52: Rest of South America Agricultural Tractors Industry Revenue (Million) Forecast, by Application 2019 & 2032
- Table 53: Global Agricultural Tractors Industry Revenue Million Forecast, by Production Analysis 2019 & 2032
- Table 54: Global Agricultural Tractors Industry Revenue Million Forecast, by Consumption Analysis 2019 & 2032
- Table 55: Global Agricultural Tractors Industry Revenue Million Forecast, by Import Market Analysis (Value & Volume) 2019 & 2032
- Table 56: Global Agricultural Tractors Industry Revenue Million Forecast, by Export Market Analysis (Value & Volume) 2019 & 2032
- Table 57: Global Agricultural Tractors Industry Revenue Million Forecast, by Price Trend Analysis 2019 & 2032
- Table 58: Global Agricultural Tractors Industry Revenue Million Forecast, by Country 2019 & 2032
- Table 59: United Kingdom Agricultural Tractors Industry Revenue (Million) Forecast, by Application 2019 & 2032
- Table 60: Germany Agricultural Tractors Industry Revenue (Million) Forecast, by Application 2019 & 2032
- Table 61: France Agricultural Tractors Industry Revenue (Million) Forecast, by Application 2019 & 2032
- Table 62: Italy Agricultural Tractors Industry Revenue (Million) Forecast, by Application 2019 & 2032
- Table 63: Spain Agricultural Tractors Industry Revenue (Million) Forecast, by Application 2019 & 2032
- Table 64: Russia Agricultural Tractors Industry Revenue (Million) Forecast, by Application 2019 & 2032
- Table 65: Benelux Agricultural Tractors Industry Revenue (Million) Forecast, by Application 2019 & 2032
- Table 66: Nordics Agricultural Tractors Industry Revenue (Million) Forecast, by Application 2019 & 2032
- Table 67: Rest of Europe Agricultural Tractors Industry Revenue (Million) Forecast, by Application 2019 & 2032
- Table 68: Global Agricultural Tractors Industry Revenue Million Forecast, by Production Analysis 2019 & 2032
- Table 69: Global Agricultural Tractors Industry Revenue Million Forecast, by Consumption Analysis 2019 & 2032
- Table 70: Global Agricultural Tractors Industry Revenue Million Forecast, by Import Market Analysis (Value & Volume) 2019 & 2032
- Table 71: Global Agricultural Tractors Industry Revenue Million Forecast, by Export Market Analysis (Value & Volume) 2019 & 2032
- Table 72: Global Agricultural Tractors Industry Revenue Million Forecast, by Price Trend Analysis 2019 & 2032
- Table 73: Global Agricultural Tractors Industry Revenue Million Forecast, by Country 2019 & 2032
- Table 74: Turkey Agricultural Tractors Industry Revenue (Million) Forecast, by Application 2019 & 2032
- Table 75: Israel Agricultural Tractors Industry Revenue (Million) Forecast, by Application 2019 & 2032
- Table 76: GCC Agricultural Tractors Industry Revenue (Million) Forecast, by Application 2019 & 2032
- Table 77: North Africa Agricultural Tractors Industry Revenue (Million) Forecast, by Application 2019 & 2032
- Table 78: South Africa Agricultural Tractors Industry Revenue (Million) Forecast, by Application 2019 & 2032
- Table 79: Rest of Middle East & Africa Agricultural Tractors Industry Revenue (Million) Forecast, by Application 2019 & 2032
- Table 80: Global Agricultural Tractors Industry Revenue Million Forecast, by Production Analysis 2019 & 2032
- Table 81: Global Agricultural Tractors Industry Revenue Million Forecast, by Consumption Analysis 2019 & 2032
- Table 82: Global Agricultural Tractors Industry Revenue Million Forecast, by Import Market Analysis (Value & Volume) 2019 & 2032
- Table 83: Global Agricultural Tractors Industry Revenue Million Forecast, by Export Market Analysis (Value & Volume) 2019 & 2032
- Table 84: Global Agricultural Tractors Industry Revenue Million Forecast, by Price Trend Analysis 2019 & 2032
- Table 85: Global Agricultural Tractors Industry Revenue Million Forecast, by Country 2019 & 2032
- Table 86: China Agricultural Tractors Industry Revenue (Million) Forecast, by Application 2019 & 2032
- Table 87: India Agricultural Tractors Industry Revenue (Million) Forecast, by Application 2019 & 2032
- Table 88: Japan Agricultural Tractors Industry Revenue (Million) Forecast, by Application 2019 & 2032
- Table 89: South Korea Agricultural Tractors Industry Revenue (Million) Forecast, by Application 2019 & 2032
- Table 90: ASEAN Agricultural Tractors Industry Revenue (Million) Forecast, by Application 2019 & 2032
- Table 91: Oceania Agricultural Tractors Industry Revenue (Million) Forecast, by Application 2019 & 2032
- Table 92: Rest of Asia Pacific Agricultural Tractors Industry Revenue (Million) Forecast, by Application 2019 & 2032
Frequently Asked Questions
1. What is the projected Compound Annual Growth Rate (CAGR) of the Agricultural Tractors Industry?
The projected CAGR is approximately 5.20%.
2. Which companies are prominent players in the Agricultural Tractors Industry?
Key companies in the market include Iseki & Co Ltd, Deere & Company, CNH Industrial NV, Kubota Corporation, Mahindra & Mahindra Ltd, Claas KGaA mbH, Tractors and Farm Equipment Ltd, AGCO Corporation (Massey Ferguson Limited), Yanmar Holdings Co Lt.
3. What are the main segments of the Agricultural Tractors Industry?
The market segments include Production Analysis, Consumption Analysis, Import Market Analysis (Value & Volume), Export Market Analysis (Value & Volume), Price Trend Analysis.
4. Can you provide details about the market size?
The market size is estimated to be USD 70.40 Million as of 2022.
5. What are some drivers contributing to market growth?
Shortage of Skilled Labor; Government Support to Enhance Farm Mechanization.
6. What are the notable trends driving market growth?
Increasing Farm Mechanization in Developing Markets.
7. Are there any restraints impacting market growth?
Heavy Initial Procurement Cost and High Expenditure on Maintenance.
8. Can you provide examples of recent developments in the market?
November 2022: VST Tillers Tractors Ltd and ZETOR TRACTORS unveiled two best-in-class tractors at the CII Agro Tech India 2022 exhibition. These 45 HP and 50 HP category tractors are jointly developed by VST & ZETOR at their India & Czech Republic plants.
9. What pricing options are available for accessing the report?
Pricing options include single-user, multi-user, and enterprise licenses priced at USD 4750, USD 5250, and USD 8750 respectively.
10. Is the market size provided in terms of value or volume?
The market size is provided in terms of value, measured in Million.
11. Are there any specific market keywords associated with the report?
Yes, the market keyword associated with the report is "Agricultural Tractors Industry," which aids in identifying and referencing the specific market segment covered.
12. How do I determine which pricing option suits my needs best?
The pricing options vary based on user requirements and access needs. Individual users may opt for single-user licenses, while businesses requiring broader access may choose multi-user or enterprise licenses for cost-effective access to the report.
13. Are there any additional resources or data provided in the Agricultural Tractors Industry report?
While the report offers comprehensive insights, it's advisable to review the specific contents or supplementary materials provided to ascertain if additional resources or data are available.
14. How can I stay updated on further developments or reports in the Agricultural Tractors Industry?
To stay informed about further developments, trends, and reports in the Agricultural Tractors Industry, consider subscribing to industry newsletters, following relevant companies and organizations, or regularly checking reputable industry news sources and publications.
Methodology
Step 1 - Identification of Relevant Samples Size from Population Database


Step 2 - Approaches for Defining Global Market Size (Value, Volume* & Price*)

Note*: In applicable scenarios
Step 3 - Data Sources
Primary Research
- Web Analytics
- Survey Reports
- Research Institute
- Latest Research Reports
- Opinion Leaders
Secondary Research
- Annual Reports
- White Paper
- Latest Press Release
- Industry Association
- Paid Database
- Investor Presentations

Step 4 - Data Triangulation
Involves using different sources of information in order to increase the validity of a study
These sources are likely to be stakeholders in a program - participants, other researchers, program staff, other community members, and so on.
Then we put all data in single framework & apply various statistical tools to find out the dynamic on the market.
During the analysis stage, feedback from the stakeholder groups would be compared to determine areas of agreement as well as areas of divergence


