
Key Insights
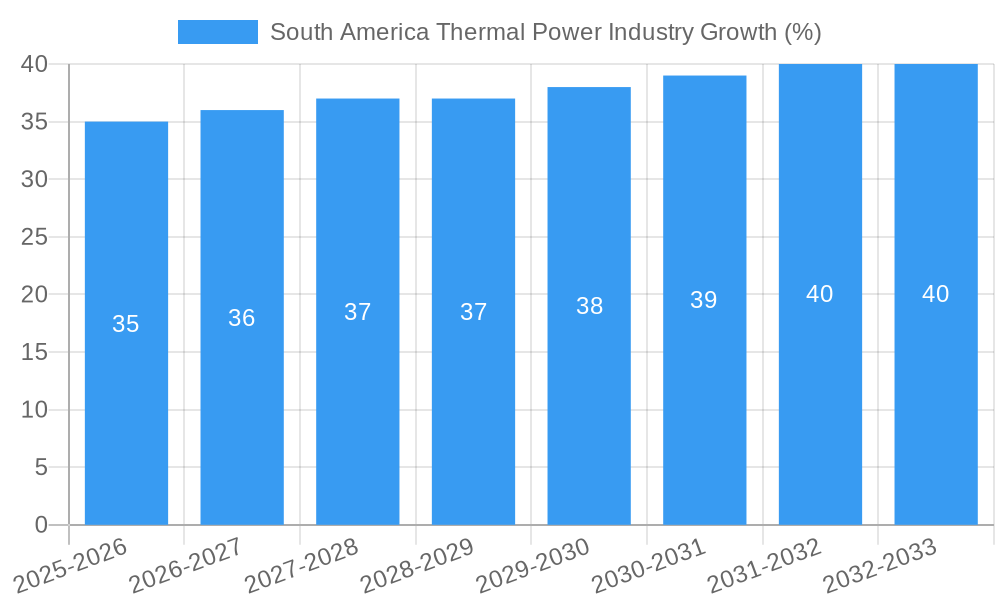
The South American thermal power industry, encompassing Brazil, Argentina, and the Rest of South America, presents a dynamic market landscape characterized by moderate but steady growth. Driven by increasing energy demands from a growing population and industrial expansion, the market exhibits a Compound Annual Growth Rate (CAGR) exceeding 1.00%. While the precise market size in 2025 is unavailable, estimations based on industry reports and considering a conservative CAGR, suggest a value in the range of several billion USD. Key drivers include the need for reliable baseload power generation to support economic development, particularly in rapidly urbanizing regions. Trends show a shift towards more efficient and environmentally friendly thermal technologies, including advanced coal combustion methods and potentially greater integration of natural gas, although challenges remain in reducing reliance on older, less efficient plants. This transition is influenced by growing environmental concerns and international pressure to decarbonize energy production.
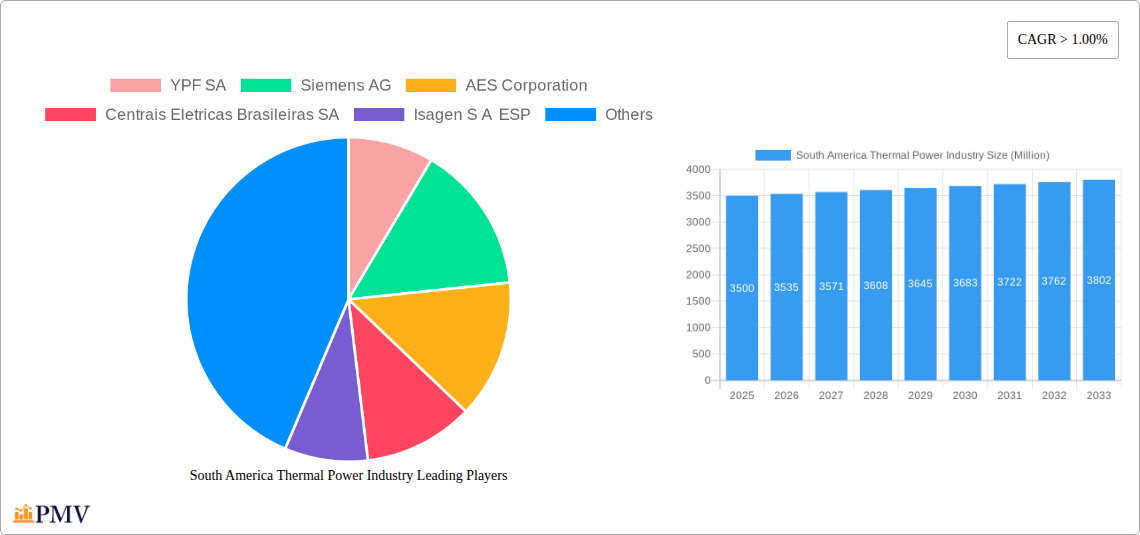
However, the industry faces significant restraints. These include high initial investment costs for new power plants, the fluctuating prices of fossil fuels, and regulatory hurdles related to environmental compliance. The regional segments show differing growth trajectories. Brazil, with its substantial economy and existing infrastructure, likely holds the largest market share. Argentina, facing economic volatility, may show a more moderate growth rate, while the "Rest of South America" segment presents a varied picture, dependent on specific country-level factors such as economic stability and energy policy. The competitive landscape is comprised of a mix of established players like YPF SA, Siemens AG, and AES Corporation, alongside regional companies like Centráis Eletricas Brasileiras SA and Colbun S.A. The industry's future will depend on finding a balance between fulfilling energy needs, mitigating environmental impacts, and attracting investment to modernize existing infrastructure.
South America Thermal Power Industry: A Comprehensive Market Report (2019-2033)
This detailed report provides a comprehensive analysis of the South America thermal power industry, covering the period from 2019 to 2033. It offers in-depth insights into market structure, competitive dynamics, growth drivers, challenges, and future outlook, empowering stakeholders to make informed strategic decisions. The report utilizes data from the historical period (2019-2024), base year (2025), and estimated year (2025) to forecast market trends until 2033. Market values are expressed in Millions.
South America Thermal Power Industry Market Structure & Competitive Dynamics
This section analyzes the competitive landscape of the South American thermal power market, encompassing market concentration, innovation ecosystems, regulatory frameworks, product substitutes, end-user trends, and M&A activities. The market is moderately concentrated, with key players such as YPF SA, Siemens AG, AES Corporation, and Centraies Eletricas Brasileiras SA holding significant market share. However, the presence of several smaller, regional players contributes to a dynamic competitive environment.
- Market Share: YPF SA holds an estimated xx% market share in Argentina, while AES Corporation maintains approximately xx% in Brazil. Centrais Eletricas Brasileiras SA holds a significant share in the Brazilian market, estimated at xx%.
- M&A Activity: The historical period (2019-2024) witnessed xx M&A deals valued at approximately $xx Million, primarily driven by the consolidation of smaller players and expansion into new geographical areas. The forecast period is expected to see increased M&A activity, possibly exceeding $xx Million in total deal value.
- Regulatory Framework: Varying regulatory frameworks across South American nations influence investment decisions and market access. Recent regulatory changes in xx have led to increased investment in xx.
- Innovation Ecosystem: The industry is witnessing increasing integration of digital technologies, with smart grids and advanced analytics gaining traction. This is partly driven by the need for enhanced efficiency and grid stability.
South America Thermal Power Industry Industry Trends & Insights
The South American thermal power industry is characterized by a complex interplay of growth drivers and challenges. Market growth is primarily driven by increasing energy demand fueled by rising industrialization and population growth, particularly in Brazil and Argentina. However, this growth is tempered by the increasing adoption of renewable energy sources and stringent environmental regulations. The CAGR for the forecast period (2025-2033) is projected to be xx%, with market penetration of thermal power decreasing gradually from xx% in 2025 to xx% in 2033, reflecting the shift towards renewable energy. Technological advancements in efficiency and emissions reduction technologies are key factors influencing future market dynamics.
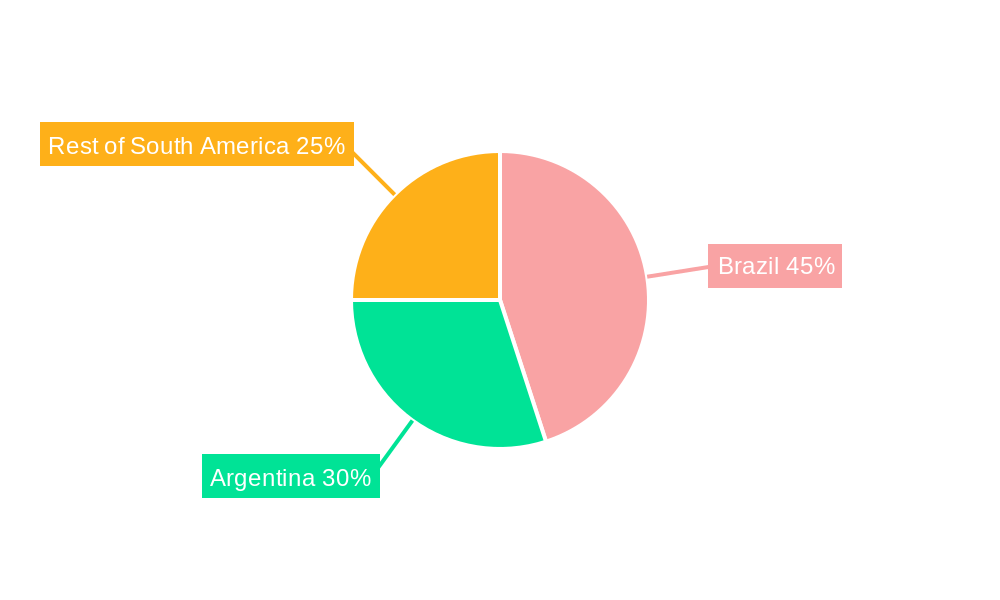
Dominant Markets & Segments in South America Thermal Power Industry
Brazil dominates the South American thermal power market, accounting for approximately xx% of the total market size in 2025. This dominance is attributable to its robust industrial base, larger population, and comparatively developed infrastructure. Argentina holds the second-largest market share, estimated at xx%. The "Rest of South America" segment accounts for the remaining xx%.
Key Drivers:
- Brazil: Strong industrial growth, existing infrastructure, and government initiatives supporting energy security.
- Argentina: Growing energy demand driven by population increase and industrial development despite economic volatility.
- Rest of South America: Varying levels of economic development and infrastructure present both opportunities and challenges for market expansion.
Fuel Source Dominance: Natural gas currently holds the largest market share among fuel sources, followed by oil and coal. The share of nuclear power remains relatively small, with only xx% market share. However, the forecast period may witness a slight increase in the nuclear power segment due to government initiatives in some countries.
South America Thermal Power Industry Product Innovations
Recent advancements focus on improving efficiency and reducing emissions. High-efficiency combined cycle power plants and advanced combustion technologies are gaining prominence. These innovations are driven by the need to meet stricter environmental regulations and improve the cost-effectiveness of thermal power generation. The market is also witnessing increased integration of digital technologies, leading to improved grid management and predictive maintenance.
Report Segmentation & Scope
This report segments the South American thermal power market by geography (Brazil, Argentina, Rest of South America) and fuel source (Oil, Natural Gas, Coal, Nuclear). Each segment's growth projections, market sizes, and competitive dynamics are analyzed individually.
- Geography: Brazil is projected to exhibit the highest growth rate among the geographical segments, followed by Argentina.
- Fuel Source: Natural gas is expected to maintain its dominant position, while the share of coal is projected to decline due to environmental concerns.
Key Drivers of South America Thermal Power Industry Growth
The South American thermal power industry’s growth is propelled by several factors:
- Rising Energy Demand: Increasing industrialization and population growth are driving a surge in energy consumption.
- Government Initiatives: Several South American countries are investing in infrastructure development to support thermal power generation.
- Technological Advancements: Innovations in efficiency and emission reduction technologies are making thermal power a more attractive option.
Challenges in the South America Thermal Power Industry Sector
The industry faces several challenges:
- Environmental Regulations: Stricter emission standards are increasing compliance costs.
- Infrastructure Limitations: Inadequate infrastructure in some regions hampers expansion and efficient operations.
- Fuel Price Volatility: Fluctuations in global fuel prices impact the profitability of thermal power plants.
Leading Players in the South America Thermal Power Industry Market
- YPF SA
- Siemens AG
- AES Corporation
- Centrais Eletricas Brasileiras SA
- Isagen S A ESP
- Colbun S A
- Enel S p A
- Pampa Energ a SA
Key Developments in South America Thermal Power Industry Sector
- 2022-Q4: AES Corporation announced a significant investment in a new combined cycle power plant in Brazil.
- 2023-Q1: YPF SA completed the acquisition of a smaller thermal power generation company in Argentina.
- 2024-Q3: New environmental regulations were implemented in several South American countries affecting thermal power plant operations.
Strategic South America Thermal Power Industry Market Outlook
The South American thermal power industry presents significant opportunities for growth despite the challenges. Strategic investments in efficient and environmentally friendly technologies, coupled with infrastructure development, will be key to realizing the market's full potential. Further consolidation and M&A activity are also expected to reshape the competitive landscape. The focus on improving grid stability and integrating renewable energy sources into the thermal power infrastructure will also be a key strategy for growth in the coming decade.
South America Thermal Power Industry Segmentation
-
1. Source
- 1.1. Oil
- 1.2. Natural Gas
- 1.3. Coal
- 1.4. Nuclear
-
2. Geogrpahy
- 2.1. Brazil
- 2.2. Argentina
- 2.3. Rest of South America
South America Thermal Power Industry Segmentation By Geography
-
1. South America
- 1.1. Brazil
- 1.2. Argentina
- 1.3. Chile
- 1.4. Colombia
- 1.5. Peru
- 1.6. Venezuela
- 1.7. Ecuador
- 1.8. Bolivia
- 1.9. Paraguay
- 1.10. Uruguay
South America Thermal Power Industry REPORT HIGHLIGHTS
| Aspects | Details |
|---|---|
| Study Period | 2019-2033 |
| Base Year | 2024 |
| Estimated Year | 2025 |
| Forecast Period | 2025-2033 |
| Historical Period | 2019-2024 |
| Growth Rate | CAGR of > 1.00% from 2019-2033 |
| Segmentation |
|
Table of Contents
- 1. Introduction
- 1.1. Research Scope
- 1.2. Market Segmentation
- 1.3. Research Methodology
- 1.4. Definitions and Assumptions
- 2. Executive Summary
- 2.1. Introduction
- 3. Market Dynamics
- 3.1. Introduction
- 3.2. Market Drivers
- 3.2.1. 4.; Increasing Investments in Offshore Wind Power Projects4.; Supportive Government Policies
- 3.3. Market Restrains
- 3.3.1. 4.; Increasing Adopting of Alternative Clean Energy Sources (Ex
- 3.4. Market Trends
- 3.4.1. Natural Gas Power Plants to Dominate the Market
- 4. Market Factor Analysis
- 4.1. Porters Five Forces
- 4.2. Supply/Value Chain
- 4.3. PESTEL analysis
- 4.4. Market Entropy
- 4.5. Patent/Trademark Analysis
- 5. South America Thermal Power Industry Analysis, Insights and Forecast, 2019-2031
- 5.1. Market Analysis, Insights and Forecast - by Source
- 5.1.1. Oil
- 5.1.2. Natural Gas
- 5.1.3. Coal
- 5.1.4. Nuclear
- 5.2. Market Analysis, Insights and Forecast - by Geogrpahy
- 5.2.1. Brazil
- 5.2.2. Argentina
- 5.2.3. Rest of South America
- 5.3. Market Analysis, Insights and Forecast - by Region
- 5.3.1. South America
- 5.1. Market Analysis, Insights and Forecast - by Source
- 6. Brazil South America Thermal Power Industry Analysis, Insights and Forecast, 2019-2031
- 7. Argentina South America Thermal Power Industry Analysis, Insights and Forecast, 2019-2031
- 8. Rest of South America South America Thermal Power Industry Analysis, Insights and Forecast, 2019-2031
- 9. Competitive Analysis
- 9.1. Market Share Analysis 2024
- 9.2. Company Profiles
- 9.2.1 YPF SA
- 9.2.1.1. Overview
- 9.2.1.2. Products
- 9.2.1.3. SWOT Analysis
- 9.2.1.4. Recent Developments
- 9.2.1.5. Financials (Based on Availability)
- 9.2.2 Siemens AG
- 9.2.2.1. Overview
- 9.2.2.2. Products
- 9.2.2.3. SWOT Analysis
- 9.2.2.4. Recent Developments
- 9.2.2.5. Financials (Based on Availability)
- 9.2.3 AES Corporation
- 9.2.3.1. Overview
- 9.2.3.2. Products
- 9.2.3.3. SWOT Analysis
- 9.2.3.4. Recent Developments
- 9.2.3.5. Financials (Based on Availability)
- 9.2.4 Centrais Eletricas Brasileiras SA
- 9.2.4.1. Overview
- 9.2.4.2. Products
- 9.2.4.3. SWOT Analysis
- 9.2.4.4. Recent Developments
- 9.2.4.5. Financials (Based on Availability)
- 9.2.5 Isagen S A ESP
- 9.2.5.1. Overview
- 9.2.5.2. Products
- 9.2.5.3. SWOT Analysis
- 9.2.5.4. Recent Developments
- 9.2.5.5. Financials (Based on Availability)
- 9.2.6 Colbun S A
- 9.2.6.1. Overview
- 9.2.6.2. Products
- 9.2.6.3. SWOT Analysis
- 9.2.6.4. Recent Developments
- 9.2.6.5. Financials (Based on Availability)
- 9.2.7 Enel S p A
- 9.2.7.1. Overview
- 9.2.7.2. Products
- 9.2.7.3. SWOT Analysis
- 9.2.7.4. Recent Developments
- 9.2.7.5. Financials (Based on Availability)
- 9.2.8 Pampa Energ a SA
- 9.2.8.1. Overview
- 9.2.8.2. Products
- 9.2.8.3. SWOT Analysis
- 9.2.8.4. Recent Developments
- 9.2.8.5. Financials (Based on Availability)
- 9.2.1 YPF SA
List of Figures
- Figure 1: South America Thermal Power Industry Revenue Breakdown (Million, %) by Product 2024 & 2032
- Figure 2: South America Thermal Power Industry Share (%) by Company 2024
List of Tables
- Table 1: South America Thermal Power Industry Revenue Million Forecast, by Region 2019 & 2032
- Table 2: South America Thermal Power Industry Volume gigawatt Forecast, by Region 2019 & 2032
- Table 3: South America Thermal Power Industry Revenue Million Forecast, by Source 2019 & 2032
- Table 4: South America Thermal Power Industry Volume gigawatt Forecast, by Source 2019 & 2032
- Table 5: South America Thermal Power Industry Revenue Million Forecast, by Geogrpahy 2019 & 2032
- Table 6: South America Thermal Power Industry Volume gigawatt Forecast, by Geogrpahy 2019 & 2032
- Table 7: South America Thermal Power Industry Revenue Million Forecast, by Region 2019 & 2032
- Table 8: South America Thermal Power Industry Volume gigawatt Forecast, by Region 2019 & 2032
- Table 9: South America Thermal Power Industry Revenue Million Forecast, by Country 2019 & 2032
- Table 10: South America Thermal Power Industry Volume gigawatt Forecast, by Country 2019 & 2032
- Table 11: Brazil South America Thermal Power Industry Revenue (Million) Forecast, by Application 2019 & 2032
- Table 12: Brazil South America Thermal Power Industry Volume (gigawatt) Forecast, by Application 2019 & 2032
- Table 13: Argentina South America Thermal Power Industry Revenue (Million) Forecast, by Application 2019 & 2032
- Table 14: Argentina South America Thermal Power Industry Volume (gigawatt) Forecast, by Application 2019 & 2032
- Table 15: Rest of South America South America Thermal Power Industry Revenue (Million) Forecast, by Application 2019 & 2032
- Table 16: Rest of South America South America Thermal Power Industry Volume (gigawatt) Forecast, by Application 2019 & 2032
- Table 17: South America Thermal Power Industry Revenue Million Forecast, by Source 2019 & 2032
- Table 18: South America Thermal Power Industry Volume gigawatt Forecast, by Source 2019 & 2032
- Table 19: South America Thermal Power Industry Revenue Million Forecast, by Geogrpahy 2019 & 2032
- Table 20: South America Thermal Power Industry Volume gigawatt Forecast, by Geogrpahy 2019 & 2032
- Table 21: South America Thermal Power Industry Revenue Million Forecast, by Country 2019 & 2032
- Table 22: South America Thermal Power Industry Volume gigawatt Forecast, by Country 2019 & 2032
- Table 23: Brazil South America Thermal Power Industry Revenue (Million) Forecast, by Application 2019 & 2032
- Table 24: Brazil South America Thermal Power Industry Volume (gigawatt) Forecast, by Application 2019 & 2032
- Table 25: Argentina South America Thermal Power Industry Revenue (Million) Forecast, by Application 2019 & 2032
- Table 26: Argentina South America Thermal Power Industry Volume (gigawatt) Forecast, by Application 2019 & 2032
- Table 27: Chile South America Thermal Power Industry Revenue (Million) Forecast, by Application 2019 & 2032
- Table 28: Chile South America Thermal Power Industry Volume (gigawatt) Forecast, by Application 2019 & 2032
- Table 29: Colombia South America Thermal Power Industry Revenue (Million) Forecast, by Application 2019 & 2032
- Table 30: Colombia South America Thermal Power Industry Volume (gigawatt) Forecast, by Application 2019 & 2032
- Table 31: Peru South America Thermal Power Industry Revenue (Million) Forecast, by Application 2019 & 2032
- Table 32: Peru South America Thermal Power Industry Volume (gigawatt) Forecast, by Application 2019 & 2032
- Table 33: Venezuela South America Thermal Power Industry Revenue (Million) Forecast, by Application 2019 & 2032
- Table 34: Venezuela South America Thermal Power Industry Volume (gigawatt) Forecast, by Application 2019 & 2032
- Table 35: Ecuador South America Thermal Power Industry Revenue (Million) Forecast, by Application 2019 & 2032
- Table 36: Ecuador South America Thermal Power Industry Volume (gigawatt) Forecast, by Application 2019 & 2032
- Table 37: Bolivia South America Thermal Power Industry Revenue (Million) Forecast, by Application 2019 & 2032
- Table 38: Bolivia South America Thermal Power Industry Volume (gigawatt) Forecast, by Application 2019 & 2032
- Table 39: Paraguay South America Thermal Power Industry Revenue (Million) Forecast, by Application 2019 & 2032
- Table 40: Paraguay South America Thermal Power Industry Volume (gigawatt) Forecast, by Application 2019 & 2032
- Table 41: Uruguay South America Thermal Power Industry Revenue (Million) Forecast, by Application 2019 & 2032
- Table 42: Uruguay South America Thermal Power Industry Volume (gigawatt) Forecast, by Application 2019 & 2032
Frequently Asked Questions
1. What is the projected Compound Annual Growth Rate (CAGR) of the South America Thermal Power Industry?
The projected CAGR is approximately > 1.00%.
2. Which companies are prominent players in the South America Thermal Power Industry?
Key companies in the market include YPF SA, Siemens AG, AES Corporation, Centrais Eletricas Brasileiras SA, Isagen S A ESP, Colbun S A, Enel S p A, Pampa Energ a SA.
3. What are the main segments of the South America Thermal Power Industry?
The market segments include Source, Geogrpahy.
4. Can you provide details about the market size?
The market size is estimated to be USD XX Million as of 2022.
5. What are some drivers contributing to market growth?
4.; Increasing Investments in Offshore Wind Power Projects4.; Supportive Government Policies.
6. What are the notable trends driving market growth?
Natural Gas Power Plants to Dominate the Market.
7. Are there any restraints impacting market growth?
4.; Increasing Adopting of Alternative Clean Energy Sources (Ex: Solar. Hydro).
8. Can you provide examples of recent developments in the market?
N/A
9. What pricing options are available for accessing the report?
Pricing options include single-user, multi-user, and enterprise licenses priced at USD 4750, USD 5250, and USD 8750 respectively.
10. Is the market size provided in terms of value or volume?
The market size is provided in terms of value, measured in Million and volume, measured in gigawatt.
11. Are there any specific market keywords associated with the report?
Yes, the market keyword associated with the report is "South America Thermal Power Industry," which aids in identifying and referencing the specific market segment covered.
12. How do I determine which pricing option suits my needs best?
The pricing options vary based on user requirements and access needs. Individual users may opt for single-user licenses, while businesses requiring broader access may choose multi-user or enterprise licenses for cost-effective access to the report.
13. Are there any additional resources or data provided in the South America Thermal Power Industry report?
While the report offers comprehensive insights, it's advisable to review the specific contents or supplementary materials provided to ascertain if additional resources or data are available.
14. How can I stay updated on further developments or reports in the South America Thermal Power Industry?
To stay informed about further developments, trends, and reports in the South America Thermal Power Industry, consider subscribing to industry newsletters, following relevant companies and organizations, or regularly checking reputable industry news sources and publications.
Methodology
Step 1 - Identification of Relevant Samples Size from Population Database


Step 2 - Approaches for Defining Global Market Size (Value, Volume* & Price*)

Note*: In applicable scenarios
Step 3 - Data Sources
Primary Research
- Web Analytics
- Survey Reports
- Research Institute
- Latest Research Reports
- Opinion Leaders
Secondary Research
- Annual Reports
- White Paper
- Latest Press Release
- Industry Association
- Paid Database
- Investor Presentations

Step 4 - Data Triangulation
Involves using different sources of information in order to increase the validity of a study
These sources are likely to be stakeholders in a program - participants, other researchers, program staff, other community members, and so on.
Then we put all data in single framework & apply various statistical tools to find out the dynamic on the market.
During the analysis stage, feedback from the stakeholder groups would be compared to determine areas of agreement as well as areas of divergence


