
Key Insights
The Nordic renewable energy market, encompassing countries like Sweden, Finland, Norway, Denmark, and Iceland, is experiencing robust growth, driven by ambitious climate targets, supportive government policies, and abundant natural resources. The market's expansion is fueled by significant investments in wind power (both onshore and offshore), solar energy, and hydropower, with a notable increase in the adoption of innovative technologies and grid modernization strategies. While hydropower has historically been a dominant source, wind energy is rapidly gaining traction, particularly offshore wind farms in areas like the North Sea, capitalizing on high wind speeds and geographical advantages. The residential, commercial, and industrial sectors are actively integrating renewable energy sources, further bolstering market growth. While challenges remain, such as grid infrastructure limitations and seasonal variations in renewable energy generation, technological advancements and smart grid solutions are actively addressing these limitations. Furthermore, increased collaboration among countries within the region and partnerships with international players are facilitating the creation of a more resilient and interconnected renewable energy ecosystem.
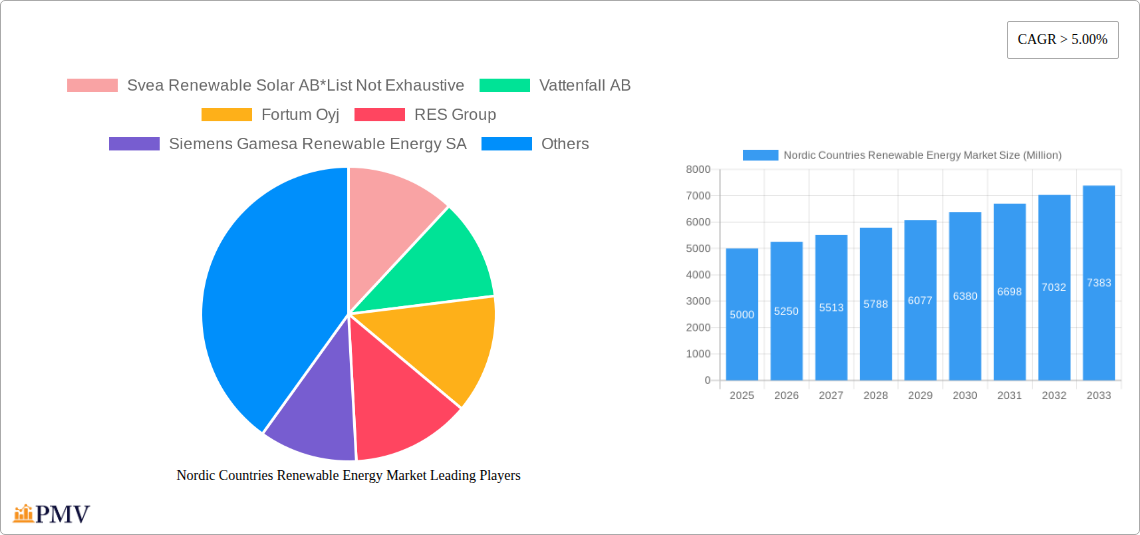
The Nordic region's commitment to renewable energy targets is attracting considerable foreign direct investment, fostering innovation, and strengthening the domestic renewable energy industry. Leading players such as Vattenfall, Fortum, and RES Group are driving the expansion of renewable energy capacity across various segments. The "Other Types" segment, including geothermal and tidal energy, though presently smaller, exhibits significant growth potential given the region's unique geological features. Sustained government support, along with increasing consumer awareness of environmental issues and the cost-competitiveness of renewable energy sources relative to fossil fuels, is expected to propel further market expansion through 2033. This ongoing growth makes the Nordic renewable energy market a highly attractive investment destination for both national and international companies.
Nordic Countries Renewable Energy Market: 2019-2033 Report
This comprehensive report provides an in-depth analysis of the Nordic countries' renewable energy market, covering the period 2019-2033. With a focus on market size, growth drivers, competitive landscape, and key industry trends, this report is an essential resource for investors, industry professionals, and policymakers seeking to understand this dynamic sector. The report leverages extensive data analysis, incorporating historical data (2019-2024), a base year of 2025, and a forecast period extending to 2033. All market values are expressed in Millions.
Nordic Countries Renewable Energy Market Market Structure & Competitive Dynamics
The Nordic renewable energy market exhibits a complex interplay of established players and emerging innovators. Market concentration is moderate, with a few dominant players holding significant shares, particularly in hydro and wind power. However, the market displays a vibrant competitive landscape, driven by continuous technological advancements and supportive government policies. Innovation ecosystems are thriving, with significant investments in research and development across various renewable energy technologies. Regulatory frameworks, while generally supportive, vary across the Nordic countries, influencing investment decisions and market dynamics. Product substitutes, primarily fossil fuels, are gradually losing market share due to increasing environmental concerns and government incentives favoring renewable energy sources. End-user trends indicate a growing preference for sustainable energy solutions, driving demand across residential, commercial, and industrial sectors. Mergers and acquisitions (M&A) activity remains robust, with significant deals shaping the market landscape. For instance, the recent USD 106 Million investment in SveaSolar reflects the ongoing consolidation within the solar energy sector. The total M&A deal value in the period 2019-2024 is estimated at xx Million. Market share data for key players is detailed within the full report.
Nordic Countries Renewable Energy Market Industry Trends & Insights
The Nordic renewable energy market is experiencing robust growth, driven by several key factors. Stringent environmental regulations and ambitious climate targets are pushing the transition away from fossil fuels. Technological advancements, particularly in wind and solar technologies, are leading to increased efficiency and cost reductions. Consumer preferences are shifting towards sustainable energy sources, boosting demand for renewable energy solutions. Furthermore, substantial government investments in renewable energy infrastructure and supportive policies are accelerating market expansion. The Compound Annual Growth Rate (CAGR) for the period 2025-2033 is projected at xx%, with market penetration for renewable energy exceeding xx% by 2033. Competitive dynamics are marked by innovation, strategic partnerships, and increasing international participation, leading to a constantly evolving market structure.

Dominant Markets & Segments in Nordic Countries Renewable Energy Market
Leading Region/Country: While all Nordic countries show strong performance, xx currently holds the leading position due to its advanced infrastructure and supportive policies, particularly in the wind energy sector.
Dominant Segment (By Type): Wind energy, particularly offshore wind, dominates the market due to the region’s geographic advantages and strong government backing. Hydropower remains a significant contributor, particularly in Norway and Sweden. Solar power is experiencing rapid growth but currently holds a smaller market share. Bioenergy also plays a substantial role.
Dominant Segment (By Application): The industrial and commercial sectors account for the largest share of renewable energy consumption, driven by high energy demands and government incentives for energy efficiency improvements. Residential consumption is steadily increasing as renewable energy solutions become more affordable and accessible.
Key Drivers:
- Economic policies: Subsidies, tax incentives, and feed-in tariffs are driving investments in renewable energy projects.
- Infrastructure: Significant investments in grid infrastructure are supporting the integration of renewable energy sources.
- Technological advancements: Cost reductions and efficiency improvements in wind and solar technologies are making renewable energy more competitive.
- Environmental regulations: Stringent environmental targets are pushing a rapid transition away from fossil fuels.
Nordic Countries Renewable Energy Market Product Innovations
Significant advancements are occurring in wind turbine technology, with larger and more efficient turbines driving down the cost of electricity. Solar panel technology is also witnessing continuous improvements, resulting in higher energy yields and enhanced durability. Innovations in energy storage solutions, such as battery technology and pumped hydro storage, are addressing the intermittency challenges associated with renewable energy sources. These innovations are improving the market fit for renewables by making them increasingly reliable and cost-competitive.
Report Segmentation & Scope
This report segments the Nordic renewable energy market by type (Solar, Wind – onshore & offshore, Hydro, Bioenergy, Other Types) and by application (Residential, Commercial, Industrial, Transportation). Each segment's analysis includes detailed growth projections, market size estimations, and competitive dynamics. For instance, the offshore wind segment is expected to show rapid growth due to technological advancements and government support, while the solar segment will experience steady expansion driven by decreasing costs and increasing adoption in the residential sector. The industrial segment will continue to be a major consumer, driving demand for large-scale renewable energy projects.
Key Drivers of Nordic Countries Renewable Energy Market Growth
The Nordic renewable energy market’s growth is propelled by several factors: ambitious national renewable energy targets, substantial government investments in renewable energy infrastructure, favorable regulatory frameworks that incentivize renewable energy adoption, declining costs of renewable energy technologies (particularly solar and wind), and increasing consumer awareness and demand for sustainable energy solutions. These elements combine to create a supportive environment for the continued expansion of the renewable energy sector across the Nordic region.
Challenges in the Nordic Countries Renewable Energy Market Sector
Despite significant progress, challenges remain. Grid infrastructure limitations in some areas can hinder the integration of intermittent renewable energy sources. Intermittency itself poses challenges, requiring robust energy storage solutions. Supply chain disruptions for critical components, such as wind turbine blades and solar panels, can affect project timelines and costs. Furthermore, although generally supportive, regulatory hurdles can still slow down project development in certain regions, leading to delays in the expansion of renewable energy capacity.
Leading Players in the Nordic Countries Renewable Energy Market Market
- Svea Renewable Solar AB
- Vattenfall AB
- Fortum Oyj
- RES Group
- Siemens Gamesa Renewable Energy SA
- Swedish Biofuels AB
- InnoVentum AB
- Axpo Holding AG
- General Electric Company
Key Developments in Nordic Countries Renewable Energy Market Sector
- December 2021: Eolus Vind AB expanded an existing wind power off-take deal to 117 MW and announced the construction of a 400-MW onshore wind farm in Norway. This signifies a strong commitment to onshore wind expansion and highlights the involvement of key players.
- June 2022: SveaSolar's subsidiary secured USD 106 Million in funding to develop 500 MW of solar projects, indicating significant investment in the solar energy sector.
- October 2022: Enlight Renewable Energy Ltd. launched the 372-MW Bjornberget wind farm in Sweden, showcasing the growing scale of wind energy projects in the region and highlighting Siemens Gamesa's role as a turbine supplier.
Strategic Nordic Countries Renewable Energy Market Market Outlook
The Nordic renewable energy market holds immense future potential. Continued technological advancements, supportive government policies, and growing consumer demand will drive further expansion. Strategic opportunities exist for companies involved in the development, construction, and operation of renewable energy projects, as well as in energy storage and grid modernization. The market is poised for significant growth, making it an attractive investment destination and a key contributor to the region's decarbonization efforts.
Nordic Countries Renewable Energy Market Segmentation
-
1. Type
- 1.1. Solar
- 1.2. Wind (incl. Onshore & Offshore)
- 1.3. Hydro
- 1.4. Bioenergy
- 1.5. Other Types (Geothermal, Tidal, etc.)
-
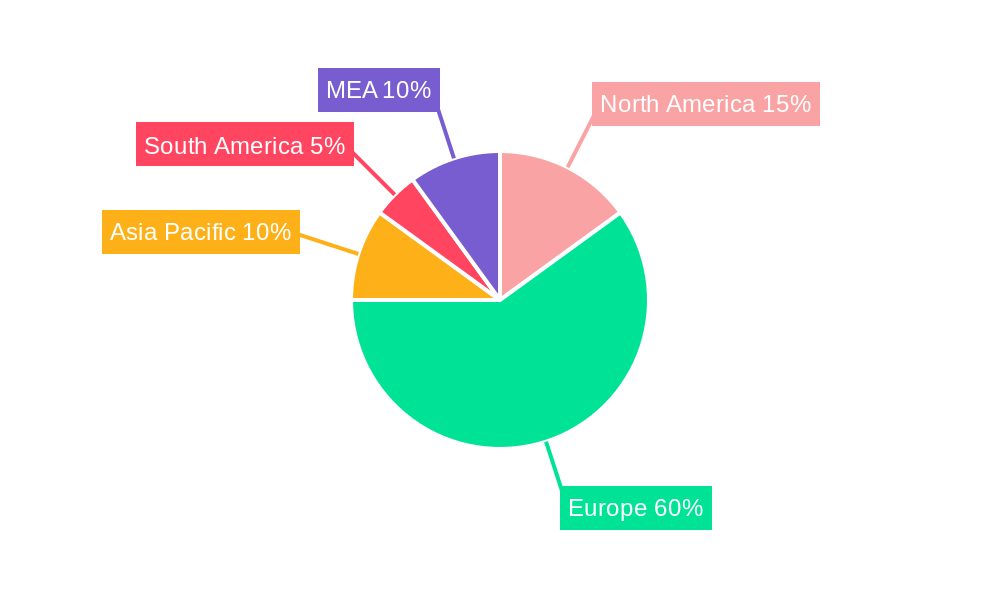
2. Geography
- 2.1. Norway
- 2.2. Sweden
- 2.3. Denmark
- 2.4. Finland
Nordic Countries Renewable Energy Market Segmentation By Geography
- 1. Norway
- 2. Sweden
- 3. Denmark
- 4. Finland
Nordic Countries Renewable Energy Market REPORT HIGHLIGHTS
| Aspects | Details |
|---|---|
| Study Period | 2019-2033 |
| Base Year | 2024 |
| Estimated Year | 2025 |
| Forecast Period | 2025-2033 |
| Historical Period | 2019-2024 |
| Growth Rate | CAGR of > 5.00% from 2019-2033 |
| Segmentation |
|
Table of Contents
- 1. Introduction
- 1.1. Research Scope
- 1.2. Market Segmentation
- 1.3. Research Methodology
- 1.4. Definitions and Assumptions
- 2. Executive Summary
- 2.1. Introduction
- 3. Market Dynamics
- 3.1. Introduction
- 3.2. Market Drivers
- 3.2.1. 4.; Growing Penetration of the Technology in Long-Duration Energy Storage Applications4.; Increasing Adoption of Renewable Energy
- 3.3. Market Restrains
- 3.3.1. 4.; Low Energy of Battery Cells
- 3.4. Market Trends
- 3.4.1. Hydro-based Electricity Generation is Expected to Dominate the Market
- 4. Market Factor Analysis
- 4.1. Porters Five Forces
- 4.2. Supply/Value Chain
- 4.3. PESTEL analysis
- 4.4. Market Entropy
- 4.5. Patent/Trademark Analysis
- 5. Nordic Countries Renewable Energy Market Analysis, Insights and Forecast, 2019-2031
- 5.1. Market Analysis, Insights and Forecast - by Type
- 5.1.1. Solar
- 5.1.2. Wind (incl. Onshore & Offshore)
- 5.1.3. Hydro
- 5.1.4. Bioenergy
- 5.1.5. Other Types (Geothermal, Tidal, etc.)
- 5.2. Market Analysis, Insights and Forecast - by Geography
- 5.2.1. Norway
- 5.2.2. Sweden
- 5.2.3. Denmark
- 5.2.4. Finland
- 5.3. Market Analysis, Insights and Forecast - by Region
- 5.3.1. Norway
- 5.3.2. Sweden
- 5.3.3. Denmark
- 5.3.4. Finland
- 5.1. Market Analysis, Insights and Forecast - by Type
- 6. Norway Nordic Countries Renewable Energy Market Analysis, Insights and Forecast, 2019-2031
- 6.1. Market Analysis, Insights and Forecast - by Type
- 6.1.1. Solar
- 6.1.2. Wind (incl. Onshore & Offshore)
- 6.1.3. Hydro
- 6.1.4. Bioenergy
- 6.1.5. Other Types (Geothermal, Tidal, etc.)
- 6.2. Market Analysis, Insights and Forecast - by Geography
- 6.2.1. Norway
- 6.2.2. Sweden
- 6.2.3. Denmark
- 6.2.4. Finland
- 6.1. Market Analysis, Insights and Forecast - by Type
- 7. Sweden Nordic Countries Renewable Energy Market Analysis, Insights and Forecast, 2019-2031
- 7.1. Market Analysis, Insights and Forecast - by Type
- 7.1.1. Solar
- 7.1.2. Wind (incl. Onshore & Offshore)
- 7.1.3. Hydro
- 7.1.4. Bioenergy
- 7.1.5. Other Types (Geothermal, Tidal, etc.)
- 7.2. Market Analysis, Insights and Forecast - by Geography
- 7.2.1. Norway
- 7.2.2. Sweden
- 7.2.3. Denmark
- 7.2.4. Finland
- 7.1. Market Analysis, Insights and Forecast - by Type
- 8. Denmark Nordic Countries Renewable Energy Market Analysis, Insights and Forecast, 2019-2031
- 8.1. Market Analysis, Insights and Forecast - by Type
- 8.1.1. Solar
- 8.1.2. Wind (incl. Onshore & Offshore)
- 8.1.3. Hydro
- 8.1.4. Bioenergy
- 8.1.5. Other Types (Geothermal, Tidal, etc.)
- 8.2. Market Analysis, Insights and Forecast - by Geography
- 8.2.1. Norway
- 8.2.2. Sweden
- 8.2.3. Denmark
- 8.2.4. Finland
- 8.1. Market Analysis, Insights and Forecast - by Type
- 9. Finland Nordic Countries Renewable Energy Market Analysis, Insights and Forecast, 2019-2031
- 9.1. Market Analysis, Insights and Forecast - by Type
- 9.1.1. Solar
- 9.1.2. Wind (incl. Onshore & Offshore)
- 9.1.3. Hydro
- 9.1.4. Bioenergy
- 9.1.5. Other Types (Geothermal, Tidal, etc.)
- 9.2. Market Analysis, Insights and Forecast - by Geography
- 9.2.1. Norway
- 9.2.2. Sweden
- 9.2.3. Denmark
- 9.2.4. Finland
- 9.1. Market Analysis, Insights and Forecast - by Type
- 10. North America Nordic Countries Renewable Energy Market Analysis, Insights and Forecast, 2019-2031
- 10.1. Market Analysis, Insights and Forecast - By Country/Sub-region
- 10.1.1 United States
- 10.1.2 Canada
- 10.1.3 Mexico
- 11. Europe Nordic Countries Renewable Energy Market Analysis, Insights and Forecast, 2019-2031
- 11.1. Market Analysis, Insights and Forecast - By Country/Sub-region
- 11.1.1 Germany
- 11.1.2 United Kingdom
- 11.1.3 France
- 11.1.4 Spain
- 11.1.5 Italy
- 11.1.6 Spain
- 11.1.7 Belgium
- 11.1.8 Netherland
- 11.1.9 Nordics
- 11.1.10 Rest of Europe
- 12. Asia Pacific Nordic Countries Renewable Energy Market Analysis, Insights and Forecast, 2019-2031
- 12.1. Market Analysis, Insights and Forecast - By Country/Sub-region
- 12.1.1 China
- 12.1.2 Japan
- 12.1.3 India
- 12.1.4 South Korea
- 12.1.5 Southeast Asia
- 12.1.6 Australia
- 12.1.7 Indonesia
- 12.1.8 Phillipes
- 12.1.9 Singapore
- 12.1.10 Thailandc
- 12.1.11 Rest of Asia Pacific
- 13. South America Nordic Countries Renewable Energy Market Analysis, Insights and Forecast, 2019-2031
- 13.1. Market Analysis, Insights and Forecast - By Country/Sub-region
- 13.1.1 Brazil
- 13.1.2 Argentina
- 13.1.3 Peru
- 13.1.4 Chile
- 13.1.5 Colombia
- 13.1.6 Ecuador
- 13.1.7 Venezuela
- 13.1.8 Rest of South America
- 14. North America Nordic Countries Renewable Energy Market Analysis, Insights and Forecast, 2019-2031
- 14.1. Market Analysis, Insights and Forecast - By Country/Sub-region
- 14.1.1 United States
- 14.1.2 Canada
- 14.1.3 Mexico
- 15. MEA Nordic Countries Renewable Energy Market Analysis, Insights and Forecast, 2019-2031
- 15.1. Market Analysis, Insights and Forecast - By Country/Sub-region
- 15.1.1 United Arab Emirates
- 15.1.2 Saudi Arabia
- 15.1.3 South Africa
- 15.1.4 Rest of Middle East and Africa
- 16. Competitive Analysis
- 16.1. Market Share Analysis 2024
- 16.2. Company Profiles
- 16.2.1 Svea Renewable Solar AB*List Not Exhaustive
- 16.2.1.1. Overview
- 16.2.1.2. Products
- 16.2.1.3. SWOT Analysis
- 16.2.1.4. Recent Developments
- 16.2.1.5. Financials (Based on Availability)
- 16.2.2 Vattenfall AB
- 16.2.2.1. Overview
- 16.2.2.2. Products
- 16.2.2.3. SWOT Analysis
- 16.2.2.4. Recent Developments
- 16.2.2.5. Financials (Based on Availability)
- 16.2.3 Fortum Oyj
- 16.2.3.1. Overview
- 16.2.3.2. Products
- 16.2.3.3. SWOT Analysis
- 16.2.3.4. Recent Developments
- 16.2.3.5. Financials (Based on Availability)
- 16.2.4 RES Group
- 16.2.4.1. Overview
- 16.2.4.2. Products
- 16.2.4.3. SWOT Analysis
- 16.2.4.4. Recent Developments
- 16.2.4.5. Financials (Based on Availability)
- 16.2.5 Siemens Gamesa Renewable Energy SA
- 16.2.5.1. Overview
- 16.2.5.2. Products
- 16.2.5.3. SWOT Analysis
- 16.2.5.4. Recent Developments
- 16.2.5.5. Financials (Based on Availability)
- 16.2.6 Swedish Biofuels AB
- 16.2.6.1. Overview
- 16.2.6.2. Products
- 16.2.6.3. SWOT Analysis
- 16.2.6.4. Recent Developments
- 16.2.6.5. Financials (Based on Availability)
- 16.2.7 InnoVentum AB
- 16.2.7.1. Overview
- 16.2.7.2. Products
- 16.2.7.3. SWOT Analysis
- 16.2.7.4. Recent Developments
- 16.2.7.5. Financials (Based on Availability)
- 16.2.8 Axpo Holding AG
- 16.2.8.1. Overview
- 16.2.8.2. Products
- 16.2.8.3. SWOT Analysis
- 16.2.8.4. Recent Developments
- 16.2.8.5. Financials (Based on Availability)
- 16.2.9 General Electric Company
- 16.2.9.1. Overview
- 16.2.9.2. Products
- 16.2.9.3. SWOT Analysis
- 16.2.9.4. Recent Developments
- 16.2.9.5. Financials (Based on Availability)
- 16.2.1 Svea Renewable Solar AB*List Not Exhaustive
List of Figures
- Figure 1: Nordic Countries Renewable Energy Market Revenue Breakdown (Million, %) by Product 2024 & 2032
- Figure 2: Nordic Countries Renewable Energy Market Share (%) by Company 2024
List of Tables
- Table 1: Nordic Countries Renewable Energy Market Revenue Million Forecast, by Region 2019 & 2032
- Table 2: Nordic Countries Renewable Energy Market Volume gigawatt Forecast, by Region 2019 & 2032
- Table 3: Nordic Countries Renewable Energy Market Revenue Million Forecast, by Type 2019 & 2032
- Table 4: Nordic Countries Renewable Energy Market Volume gigawatt Forecast, by Type 2019 & 2032
- Table 5: Nordic Countries Renewable Energy Market Revenue Million Forecast, by Geography 2019 & 2032
- Table 6: Nordic Countries Renewable Energy Market Volume gigawatt Forecast, by Geography 2019 & 2032
- Table 7: Nordic Countries Renewable Energy Market Revenue Million Forecast, by Region 2019 & 2032
- Table 8: Nordic Countries Renewable Energy Market Volume gigawatt Forecast, by Region 2019 & 2032
- Table 9: Nordic Countries Renewable Energy Market Revenue Million Forecast, by Country 2019 & 2032
- Table 10: Nordic Countries Renewable Energy Market Volume gigawatt Forecast, by Country 2019 & 2032
- Table 11: United States Nordic Countries Renewable Energy Market Revenue (Million) Forecast, by Application 2019 & 2032
- Table 12: United States Nordic Countries Renewable Energy Market Volume (gigawatt) Forecast, by Application 2019 & 2032
- Table 13: Canada Nordic Countries Renewable Energy Market Revenue (Million) Forecast, by Application 2019 & 2032
- Table 14: Canada Nordic Countries Renewable Energy Market Volume (gigawatt) Forecast, by Application 2019 & 2032
- Table 15: Mexico Nordic Countries Renewable Energy Market Revenue (Million) Forecast, by Application 2019 & 2032
- Table 16: Mexico Nordic Countries Renewable Energy Market Volume (gigawatt) Forecast, by Application 2019 & 2032
- Table 17: Nordic Countries Renewable Energy Market Revenue Million Forecast, by Country 2019 & 2032
- Table 18: Nordic Countries Renewable Energy Market Volume gigawatt Forecast, by Country 2019 & 2032
- Table 19: Germany Nordic Countries Renewable Energy Market Revenue (Million) Forecast, by Application 2019 & 2032
- Table 20: Germany Nordic Countries Renewable Energy Market Volume (gigawatt) Forecast, by Application 2019 & 2032
- Table 21: United Kingdom Nordic Countries Renewable Energy Market Revenue (Million) Forecast, by Application 2019 & 2032
- Table 22: United Kingdom Nordic Countries Renewable Energy Market Volume (gigawatt) Forecast, by Application 2019 & 2032
- Table 23: France Nordic Countries Renewable Energy Market Revenue (Million) Forecast, by Application 2019 & 2032
- Table 24: France Nordic Countries Renewable Energy Market Volume (gigawatt) Forecast, by Application 2019 & 2032
- Table 25: Spain Nordic Countries Renewable Energy Market Revenue (Million) Forecast, by Application 2019 & 2032
- Table 26: Spain Nordic Countries Renewable Energy Market Volume (gigawatt) Forecast, by Application 2019 & 2032
- Table 27: Italy Nordic Countries Renewable Energy Market Revenue (Million) Forecast, by Application 2019 & 2032
- Table 28: Italy Nordic Countries Renewable Energy Market Volume (gigawatt) Forecast, by Application 2019 & 2032
- Table 29: Spain Nordic Countries Renewable Energy Market Revenue (Million) Forecast, by Application 2019 & 2032
- Table 30: Spain Nordic Countries Renewable Energy Market Volume (gigawatt) Forecast, by Application 2019 & 2032
- Table 31: Belgium Nordic Countries Renewable Energy Market Revenue (Million) Forecast, by Application 2019 & 2032
- Table 32: Belgium Nordic Countries Renewable Energy Market Volume (gigawatt) Forecast, by Application 2019 & 2032
- Table 33: Netherland Nordic Countries Renewable Energy Market Revenue (Million) Forecast, by Application 2019 & 2032
- Table 34: Netherland Nordic Countries Renewable Energy Market Volume (gigawatt) Forecast, by Application 2019 & 2032
- Table 35: Nordics Nordic Countries Renewable Energy Market Revenue (Million) Forecast, by Application 2019 & 2032
- Table 36: Nordics Nordic Countries Renewable Energy Market Volume (gigawatt) Forecast, by Application 2019 & 2032
- Table 37: Rest of Europe Nordic Countries Renewable Energy Market Revenue (Million) Forecast, by Application 2019 & 2032
- Table 38: Rest of Europe Nordic Countries Renewable Energy Market Volume (gigawatt) Forecast, by Application 2019 & 2032
- Table 39: Nordic Countries Renewable Energy Market Revenue Million Forecast, by Country 2019 & 2032
- Table 40: Nordic Countries Renewable Energy Market Volume gigawatt Forecast, by Country 2019 & 2032
- Table 41: China Nordic Countries Renewable Energy Market Revenue (Million) Forecast, by Application 2019 & 2032
- Table 42: China Nordic Countries Renewable Energy Market Volume (gigawatt) Forecast, by Application 2019 & 2032
- Table 43: Japan Nordic Countries Renewable Energy Market Revenue (Million) Forecast, by Application 2019 & 2032
- Table 44: Japan Nordic Countries Renewable Energy Market Volume (gigawatt) Forecast, by Application 2019 & 2032
- Table 45: India Nordic Countries Renewable Energy Market Revenue (Million) Forecast, by Application 2019 & 2032
- Table 46: India Nordic Countries Renewable Energy Market Volume (gigawatt) Forecast, by Application 2019 & 2032
- Table 47: South Korea Nordic Countries Renewable Energy Market Revenue (Million) Forecast, by Application 2019 & 2032
- Table 48: South Korea Nordic Countries Renewable Energy Market Volume (gigawatt) Forecast, by Application 2019 & 2032
- Table 49: Southeast Asia Nordic Countries Renewable Energy Market Revenue (Million) Forecast, by Application 2019 & 2032
- Table 50: Southeast Asia Nordic Countries Renewable Energy Market Volume (gigawatt) Forecast, by Application 2019 & 2032
- Table 51: Australia Nordic Countries Renewable Energy Market Revenue (Million) Forecast, by Application 2019 & 2032
- Table 52: Australia Nordic Countries Renewable Energy Market Volume (gigawatt) Forecast, by Application 2019 & 2032
- Table 53: Indonesia Nordic Countries Renewable Energy Market Revenue (Million) Forecast, by Application 2019 & 2032
- Table 54: Indonesia Nordic Countries Renewable Energy Market Volume (gigawatt) Forecast, by Application 2019 & 2032
- Table 55: Phillipes Nordic Countries Renewable Energy Market Revenue (Million) Forecast, by Application 2019 & 2032
- Table 56: Phillipes Nordic Countries Renewable Energy Market Volume (gigawatt) Forecast, by Application 2019 & 2032
- Table 57: Singapore Nordic Countries Renewable Energy Market Revenue (Million) Forecast, by Application 2019 & 2032
- Table 58: Singapore Nordic Countries Renewable Energy Market Volume (gigawatt) Forecast, by Application 2019 & 2032
- Table 59: Thailandc Nordic Countries Renewable Energy Market Revenue (Million) Forecast, by Application 2019 & 2032
- Table 60: Thailandc Nordic Countries Renewable Energy Market Volume (gigawatt) Forecast, by Application 2019 & 2032
- Table 61: Rest of Asia Pacific Nordic Countries Renewable Energy Market Revenue (Million) Forecast, by Application 2019 & 2032
- Table 62: Rest of Asia Pacific Nordic Countries Renewable Energy Market Volume (gigawatt) Forecast, by Application 2019 & 2032
- Table 63: Nordic Countries Renewable Energy Market Revenue Million Forecast, by Country 2019 & 2032
- Table 64: Nordic Countries Renewable Energy Market Volume gigawatt Forecast, by Country 2019 & 2032
- Table 65: Brazil Nordic Countries Renewable Energy Market Revenue (Million) Forecast, by Application 2019 & 2032
- Table 66: Brazil Nordic Countries Renewable Energy Market Volume (gigawatt) Forecast, by Application 2019 & 2032
- Table 67: Argentina Nordic Countries Renewable Energy Market Revenue (Million) Forecast, by Application 2019 & 2032
- Table 68: Argentina Nordic Countries Renewable Energy Market Volume (gigawatt) Forecast, by Application 2019 & 2032
- Table 69: Peru Nordic Countries Renewable Energy Market Revenue (Million) Forecast, by Application 2019 & 2032
- Table 70: Peru Nordic Countries Renewable Energy Market Volume (gigawatt) Forecast, by Application 2019 & 2032
- Table 71: Chile Nordic Countries Renewable Energy Market Revenue (Million) Forecast, by Application 2019 & 2032
- Table 72: Chile Nordic Countries Renewable Energy Market Volume (gigawatt) Forecast, by Application 2019 & 2032
- Table 73: Colombia Nordic Countries Renewable Energy Market Revenue (Million) Forecast, by Application 2019 & 2032
- Table 74: Colombia Nordic Countries Renewable Energy Market Volume (gigawatt) Forecast, by Application 2019 & 2032
- Table 75: Ecuador Nordic Countries Renewable Energy Market Revenue (Million) Forecast, by Application 2019 & 2032
- Table 76: Ecuador Nordic Countries Renewable Energy Market Volume (gigawatt) Forecast, by Application 2019 & 2032
- Table 77: Venezuela Nordic Countries Renewable Energy Market Revenue (Million) Forecast, by Application 2019 & 2032
- Table 78: Venezuela Nordic Countries Renewable Energy Market Volume (gigawatt) Forecast, by Application 2019 & 2032
- Table 79: Rest of South America Nordic Countries Renewable Energy Market Revenue (Million) Forecast, by Application 2019 & 2032
- Table 80: Rest of South America Nordic Countries Renewable Energy Market Volume (gigawatt) Forecast, by Application 2019 & 2032
- Table 81: Nordic Countries Renewable Energy Market Revenue Million Forecast, by Country 2019 & 2032
- Table 82: Nordic Countries Renewable Energy Market Volume gigawatt Forecast, by Country 2019 & 2032
- Table 83: United States Nordic Countries Renewable Energy Market Revenue (Million) Forecast, by Application 2019 & 2032
- Table 84: United States Nordic Countries Renewable Energy Market Volume (gigawatt) Forecast, by Application 2019 & 2032
- Table 85: Canada Nordic Countries Renewable Energy Market Revenue (Million) Forecast, by Application 2019 & 2032
- Table 86: Canada Nordic Countries Renewable Energy Market Volume (gigawatt) Forecast, by Application 2019 & 2032
- Table 87: Mexico Nordic Countries Renewable Energy Market Revenue (Million) Forecast, by Application 2019 & 2032
- Table 88: Mexico Nordic Countries Renewable Energy Market Volume (gigawatt) Forecast, by Application 2019 & 2032
- Table 89: Nordic Countries Renewable Energy Market Revenue Million Forecast, by Country 2019 & 2032
- Table 90: Nordic Countries Renewable Energy Market Volume gigawatt Forecast, by Country 2019 & 2032
- Table 91: United Arab Emirates Nordic Countries Renewable Energy Market Revenue (Million) Forecast, by Application 2019 & 2032
- Table 92: United Arab Emirates Nordic Countries Renewable Energy Market Volume (gigawatt) Forecast, by Application 2019 & 2032
- Table 93: Saudi Arabia Nordic Countries Renewable Energy Market Revenue (Million) Forecast, by Application 2019 & 2032
- Table 94: Saudi Arabia Nordic Countries Renewable Energy Market Volume (gigawatt) Forecast, by Application 2019 & 2032
- Table 95: South Africa Nordic Countries Renewable Energy Market Revenue (Million) Forecast, by Application 2019 & 2032
- Table 96: South Africa Nordic Countries Renewable Energy Market Volume (gigawatt) Forecast, by Application 2019 & 2032
- Table 97: Rest of Middle East and Africa Nordic Countries Renewable Energy Market Revenue (Million) Forecast, by Application 2019 & 2032
- Table 98: Rest of Middle East and Africa Nordic Countries Renewable Energy Market Volume (gigawatt) Forecast, by Application 2019 & 2032
- Table 99: Nordic Countries Renewable Energy Market Revenue Million Forecast, by Type 2019 & 2032
- Table 100: Nordic Countries Renewable Energy Market Volume gigawatt Forecast, by Type 2019 & 2032
- Table 101: Nordic Countries Renewable Energy Market Revenue Million Forecast, by Geography 2019 & 2032
- Table 102: Nordic Countries Renewable Energy Market Volume gigawatt Forecast, by Geography 2019 & 2032
- Table 103: Nordic Countries Renewable Energy Market Revenue Million Forecast, by Country 2019 & 2032
- Table 104: Nordic Countries Renewable Energy Market Volume gigawatt Forecast, by Country 2019 & 2032
- Table 105: Nordic Countries Renewable Energy Market Revenue Million Forecast, by Type 2019 & 2032
- Table 106: Nordic Countries Renewable Energy Market Volume gigawatt Forecast, by Type 2019 & 2032
- Table 107: Nordic Countries Renewable Energy Market Revenue Million Forecast, by Geography 2019 & 2032
- Table 108: Nordic Countries Renewable Energy Market Volume gigawatt Forecast, by Geography 2019 & 2032
- Table 109: Nordic Countries Renewable Energy Market Revenue Million Forecast, by Country 2019 & 2032
- Table 110: Nordic Countries Renewable Energy Market Volume gigawatt Forecast, by Country 2019 & 2032
- Table 111: Nordic Countries Renewable Energy Market Revenue Million Forecast, by Type 2019 & 2032
- Table 112: Nordic Countries Renewable Energy Market Volume gigawatt Forecast, by Type 2019 & 2032
- Table 113: Nordic Countries Renewable Energy Market Revenue Million Forecast, by Geography 2019 & 2032
- Table 114: Nordic Countries Renewable Energy Market Volume gigawatt Forecast, by Geography 2019 & 2032
- Table 115: Nordic Countries Renewable Energy Market Revenue Million Forecast, by Country 2019 & 2032
- Table 116: Nordic Countries Renewable Energy Market Volume gigawatt Forecast, by Country 2019 & 2032
- Table 117: Nordic Countries Renewable Energy Market Revenue Million Forecast, by Type 2019 & 2032
- Table 118: Nordic Countries Renewable Energy Market Volume gigawatt Forecast, by Type 2019 & 2032
- Table 119: Nordic Countries Renewable Energy Market Revenue Million Forecast, by Geography 2019 & 2032
- Table 120: Nordic Countries Renewable Energy Market Volume gigawatt Forecast, by Geography 2019 & 2032
- Table 121: Nordic Countries Renewable Energy Market Revenue Million Forecast, by Country 2019 & 2032
- Table 122: Nordic Countries Renewable Energy Market Volume gigawatt Forecast, by Country 2019 & 2032
Frequently Asked Questions
1. What is the projected Compound Annual Growth Rate (CAGR) of the Nordic Countries Renewable Energy Market?
The projected CAGR is approximately > 5.00%.
2. Which companies are prominent players in the Nordic Countries Renewable Energy Market?
Key companies in the market include Svea Renewable Solar AB*List Not Exhaustive, Vattenfall AB, Fortum Oyj, RES Group, Siemens Gamesa Renewable Energy SA, Swedish Biofuels AB, InnoVentum AB, Axpo Holding AG, General Electric Company.
3. What are the main segments of the Nordic Countries Renewable Energy Market?
The market segments include Type, Geography.
4. Can you provide details about the market size?
The market size is estimated to be USD XX Million as of 2022.
5. What are some drivers contributing to market growth?
4.; Growing Penetration of the Technology in Long-Duration Energy Storage Applications4.; Increasing Adoption of Renewable Energy.
6. What are the notable trends driving market growth?
Hydro-based Electricity Generation is Expected to Dominate the Market.
7. Are there any restraints impacting market growth?
4.; Low Energy of Battery Cells.
8. Can you provide examples of recent developments in the market?
October 2022: Enlight Renewable Energy Ltd., an Israeli renewable energy developer, announced the start of commercial production on the first of 60 wind turbines that compose the 372-MW Bjornberget wind farm in Sweden. The wind farm uses Siemens Gamesa 6.2-MW turbines.
9. What pricing options are available for accessing the report?
Pricing options include single-user, multi-user, and enterprise licenses priced at USD 4750, USD 5250, and USD 8750 respectively.
10. Is the market size provided in terms of value or volume?
The market size is provided in terms of value, measured in Million and volume, measured in gigawatt.
11. Are there any specific market keywords associated with the report?
Yes, the market keyword associated with the report is "Nordic Countries Renewable Energy Market," which aids in identifying and referencing the specific market segment covered.
12. How do I determine which pricing option suits my needs best?
The pricing options vary based on user requirements and access needs. Individual users may opt for single-user licenses, while businesses requiring broader access may choose multi-user or enterprise licenses for cost-effective access to the report.
13. Are there any additional resources or data provided in the Nordic Countries Renewable Energy Market report?
While the report offers comprehensive insights, it's advisable to review the specific contents or supplementary materials provided to ascertain if additional resources or data are available.
14. How can I stay updated on further developments or reports in the Nordic Countries Renewable Energy Market?
To stay informed about further developments, trends, and reports in the Nordic Countries Renewable Energy Market, consider subscribing to industry newsletters, following relevant companies and organizations, or regularly checking reputable industry news sources and publications.
Methodology
Step 1 - Identification of Relevant Samples Size from Population Database


Step 2 - Approaches for Defining Global Market Size (Value, Volume* & Price*)

Note*: In applicable scenarios
Step 3 - Data Sources
Primary Research
- Web Analytics
- Survey Reports
- Research Institute
- Latest Research Reports
- Opinion Leaders
Secondary Research
- Annual Reports
- White Paper
- Latest Press Release
- Industry Association
- Paid Database
- Investor Presentations

Step 4 - Data Triangulation
Involves using different sources of information in order to increase the validity of a study
These sources are likely to be stakeholders in a program - participants, other researchers, program staff, other community members, and so on.
Then we put all data in single framework & apply various statistical tools to find out the dynamic on the market.
During the analysis stage, feedback from the stakeholder groups would be compared to determine areas of agreement as well as areas of divergence


