

Key Insights
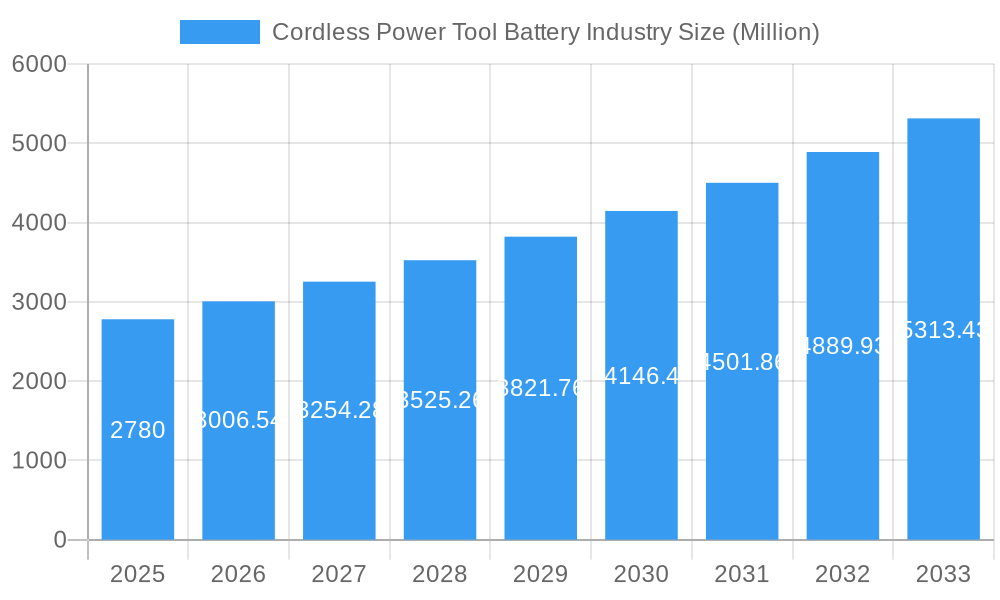
The cordless power tool battery market, currently valued at $2.78 billion in 2025, is experiencing robust growth, projected to expand at a compound annual growth rate (CAGR) of 8.30% from 2025 to 2033. This growth is fueled by several key factors. The increasing demand for lightweight and portable power tools across various industries, including construction, manufacturing, and DIY, is a primary driver. Furthermore, advancements in battery technology, particularly the dominance of lithium-ion batteries offering higher energy density and longer lifespans, are significantly impacting market expansion. The rising adoption of cordless tools in professional settings, driven by enhanced performance and reduced operational costs compared to corded alternatives, further contributes to market growth. Regional variations exist, with North America and Europe currently holding significant market share, although the Asia-Pacific region is anticipated to witness the fastest growth due to rapid industrialization and increasing disposable incomes. Competitive pressures from major players like Ryobi, Samsung SDI, Stanley Black & Decker, and Bosch are driving innovation and price competitiveness, benefiting consumers. However, challenges such as the high initial cost of cordless power tools and batteries, along with concerns surrounding battery disposal and environmental impact, represent potential restraints to market growth.
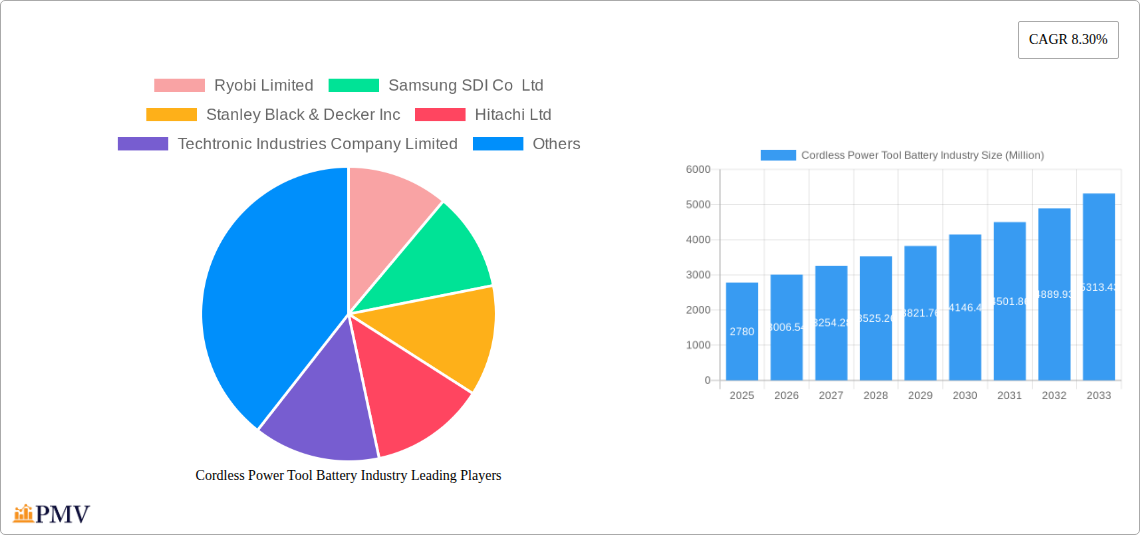
Cordless Power Tool Battery Industry Market Size (In Billion)
The market segmentation reveals a clear preference for lithium-ion technology, given its superior performance characteristics. Nickel-cadmium batteries, while still present, are gradually losing market share due to their lower energy density and environmental concerns. Other emerging technologies are also entering the market, although their current market share remains relatively small. The forecast period (2025-2033) suggests continued growth, driven by technological improvements, increasing adoption across various sectors, and the ongoing expansion of the global power tool market. While the exact market share of each region and technology type would require more granular data, it’s reasonable to expect North America and Europe to maintain a substantial presence, while the Asia-Pacific region’s share increases considerably over the forecast period. The competitive landscape will likely remain intense, with established players continuing to innovate and smaller companies striving to carve out niches in the market.
Cordless Power Tool Battery Industry Company Market Share
Cordless Power Tool Battery Industry: A Comprehensive Market Report (2019-2033)
This in-depth report provides a comprehensive analysis of the global cordless power tool battery industry, covering market size, growth projections, competitive dynamics, and key technological advancements from 2019 to 2033. The report leverages rigorous market research methodologies, incorporating historical data (2019-2024), a base year of 2025, and a detailed forecast period spanning 2025-2033. The total market value is expected to reach xx Million by 2033, exhibiting a CAGR of xx% during the forecast period.
Cordless Power Tool Battery Industry Market Structure & Competitive Dynamics
The cordless power tool battery market is characterized by a moderately concentrated landscape, with key players like Ryobi Limited, Samsung SDI Co Ltd, Stanley Black & Decker Inc, Hitachi Ltd, Techtronic Industries Company Limited, and Hilti Corporation holding significant market share. The top 6 companies account for approximately xx% of the global market (2024). Other notable players include Sony Group Corporation, Bosch Ltd, Panasonic Corporation, and Makita Corporation. Market concentration is influenced by factors such as economies of scale, technological advancements, and brand recognition. Innovation ecosystems play a crucial role, with companies investing heavily in R&D to develop higher-capacity, longer-lasting, and safer battery technologies. The industry faces regulatory scrutiny related to battery safety and environmental concerns, impacting material sourcing and manufacturing processes. Product substitutes, such as fuel-powered tools, are present but face limitations in terms of sustainability and operational costs. End-user trends toward increased automation and demand for lighter, more efficient tools are driving market growth. M&A activity in the sector remains relatively consistent, with deal values reaching an estimated xx Million in 2024, primarily focused on strengthening market positions and expanding technological capabilities.
- Market Concentration: Top 6 companies hold xx% market share (2024).
- Innovation: Significant investments in Lithium-ion battery technology.
- Regulatory Framework: Stringent safety and environmental regulations.
- M&A Activity: Total deal value estimated at xx Million in 2024.
Cordless Power Tool Battery Industry Industry Trends & Insights
The cordless power tool battery market is experiencing robust growth, driven by several key factors. The increasing adoption of cordless power tools across various end-use sectors, including construction, DIY, and industrial applications, is a major growth catalyst. Technological advancements, such as the development of higher energy density Lithium-ion batteries, are enhancing the performance and runtime of cordless tools, thereby fueling market expansion. Consumer preferences are shifting toward lightweight, ergonomic, and environmentally friendly tools, creating a strong demand for advanced battery technologies. Competitive intensity is high, with companies focusing on product differentiation through improved battery performance, longer lifespans, and innovative charging solutions. The market is also witnessing the emergence of smart batteries with integrated monitoring systems, which enhance tool efficiency and safety. The CAGR for the cordless power tool battery market is projected to be xx% from 2025 to 2033, indicating significant future growth potential. Market penetration of Lithium-ion batteries is expected to surpass xx% by 2033, driven by their superior energy density and longer lifespan compared to Nickel-cadmium and other technologies.
Dominant Markets & Segments in Cordless Power Tool Battery Industry
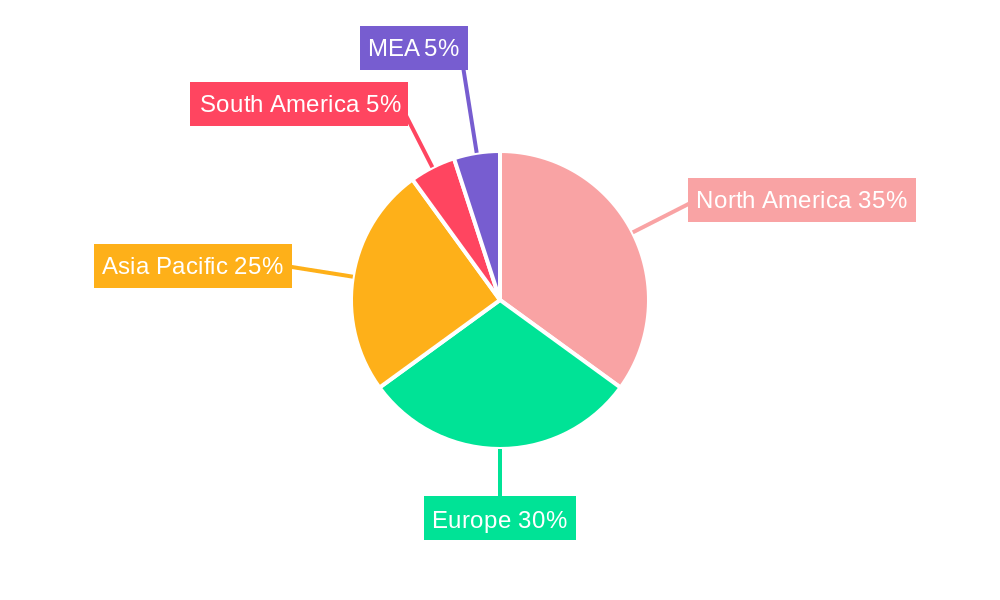
The North American region currently holds a leading position in the cordless power tool battery market, driven by factors such as strong construction activity, a robust DIY culture, and high disposable incomes. Within this region, the United States represents a significant market segment. Key drivers for this dominance include:
- Robust Construction Sector: High levels of investment in infrastructure projects.
- Strong DIY Market: Growing demand for home improvement and repair projects.
- Favorable Economic Conditions: High disposable incomes and consumer spending.
Among the technology types, Lithium-ion batteries overwhelmingly dominate the market, representing xx% of total market share in 2024, due to their superior energy density, longer lifespan, and reduced environmental impact compared to Nickel-cadmium batteries. The "Other Technology Types" segment accounts for a smaller share, primarily consisting of emerging battery chemistries such as solid-state batteries, which are still under development and gaining market traction gradually.
Cordless Power Tool Battery Industry Product Innovations
Recent product developments focus on increasing battery capacity, improving charging speed, and enhancing overall durability. Manufacturers are incorporating advanced thermal management systems and intelligent battery management systems (BMS) to optimize battery performance and safety. New battery chemistries, such as solid-state batteries, promise even higher energy density and improved safety features, though they are still in the early stages of commercialization. The emphasis is on developing batteries that offer a better balance between power, weight, and longevity to meet the evolving demands of cordless power tools.
Report Segmentation & Scope
This report segments the cordless power tool battery market based on technology type:
Lithium-ion Batteries: This segment is expected to witness the highest growth rate during the forecast period (2025-2033), driven by advancements in battery chemistry and increased adoption in cordless power tools. Market size is projected to reach xx Million by 2033. Competitive dynamics are intense, with various manufacturers focusing on differentiation through performance, lifespan and cost.
Nickel-cadmium Batteries: This segment is gradually declining due to environmental concerns and the superior performance of Lithium-ion batteries. Market size is expected to remain relatively stable, but its share is decreasing. Competition is limited, with a few major players dominating the market.
Other Technology Types: This segment encompasses emerging battery technologies such as solid-state and fuel cells. While currently small, it is projected to experience significant growth, though slower than Lithium-ion, driven by advancements and expected adoption in the coming years. Market size is estimated at xx Million by 2033. The competitive landscape is characterized by ongoing research and development efforts.
Key Drivers of Cordless Power Tool Battery Industry Growth
Several factors are driving the growth of the cordless power tool battery market. Technological advancements in battery chemistry and manufacturing processes are leading to improved energy density, longer lifespan, and faster charging times. The increasing demand for cordless power tools in various sectors, including construction, DIY, and industrial applications, is another key driver. Government regulations promoting the adoption of environmentally friendly technologies are also positively impacting market growth. Furthermore, rising disposable incomes and increasing urbanization in developing countries are contributing to the rising demand for cordless power tools.
Challenges in the Cordless Power Tool Battery Industry Sector
The cordless power tool battery industry faces several challenges, including the volatility of raw material prices impacting production costs. Supply chain disruptions can affect the availability of key components, impacting production and timelines. Intense competition requires continuous innovation and cost optimization to remain competitive. Environmental regulations related to battery disposal and recycling also pose a challenge, requiring investments in sustainable solutions.
Leading Players in the Cordless Power Tool Battery Industry Market
- Ryobi Limited
- Samsung SDI Co Ltd
- Stanley Black & Decker Inc
- Hitachi Ltd
- Techtronic Industries Company Limited
- Hilti Corporation
- Sony Group Corporation
- Bosch Ltd
- Panasonic Corporation
- Makita Corporation
Key Developments in Cordless Power Tool Battery Industry Sector
- January 2023: Hilti North America announced the addition of over 30 new cordless tools to its Nuron battery-powered tool portfolio. This expansion significantly strengthens its position in the market and highlights the ongoing demand for cordless tools.
- October 2022: Stanley Black & Decker's Black & Decker brand launched its new line of Reviva cordless power tools. This launch demonstrates a focus on expanding its product offerings in a competitive market.
Strategic Cordless Power Tool Battery Industry Market Outlook
The future of the cordless power tool battery market appears bright, with significant growth potential driven by technological advancements and increasing demand. Strategic opportunities exist in developing next-generation battery technologies, such as solid-state batteries, and expanding into new applications and markets. Companies that can effectively address sustainability concerns and improve battery lifecycle management will be well-positioned to capitalize on future market growth. The focus on improved safety features and more efficient charging systems will also be crucial factors in attracting customers and gaining a competitive edge.
Cordless Power Tool Battery Industry Segmentation
-
1. Technology Type
- 1.1. Lithium-ion
- 1.2. Nickel-cadmium
- 1.3. Other Technology Types
Cordless Power Tool Battery Industry Segmentation By Geography
-
1. North America
- 1.1. United States
- 1.2. Canada
- 1.3. Rest of North America
-
2. Europe
- 2.1. Germany
- 2.2. France
- 2.3. United Kingdom
- 2.4. Italy
- 2.5. Rest of Europe
-
3. Asia Pacific
- 3.1. China
- 3.2. India
- 3.3. Japan
- 3.4. Australia
- 3.5. Rest of Asia Pacific
-
4. South America
- 4.1. Brazil
- 4.2. Argentina
- 4.3. Chile
- 4.4. Rest of South America
-
5. Middle East and Africa
- 5.1. United Arab Emirates
- 5.2. Saudi Arabia
- 5.3. Qatar
- 5.4. South Africa
- 5.5. Egypt
- 5.6. Rest of Middle East and Africa
Cordless Power Tool Battery Industry Regional Market Share
Geographic Coverage of Cordless Power Tool Battery Industry
Cordless Power Tool Battery Industry REPORT HIGHLIGHTS
| Aspects | Details |
|---|---|
| Study Period | 2020-2034 |
| Base Year | 2025 |
| Estimated Year | 2026 |
| Forecast Period | 2026-2034 |
| Historical Period | 2020-2025 |
| Growth Rate | CAGR of 8.30% from 2020-2034 |
| Segmentation |
|
Table of Contents
- 1. Introduction
- 1.1. Research Scope
- 1.2. Market Segmentation
- 1.3. Research Objective
- 1.4. Definitions and Assumptions
- 2. Executive Summary
- 2.1. Market Snapshot
- 3. Market Dynamics
- 3.1. Market Drivers
- 3.2. Market Restrains
- 3.3. Market Trends
- 3.4. Market Opportunities
- 4. Market Factor Analysis
- 4.1. Porters Five Forces
- 4.1.1. Bargaining Power of Suppliers
- 4.1.2. Bargaining Power of Buyers
- 4.1.3. Threat of New Entrants
- 4.1.4. Threat of Substitutes
- 4.1.5. Competitive Rivalry
- 4.2. PESTEL analysis
- 4.3. BCG Analysis
- 4.3.1. Stars (High Growth, High Market Share)
- 4.3.2. Cash Cows (Low Growth, High Market Share)
- 4.3.3. Question Mark (High Growth, Low Market Share)
- 4.3.4. Dogs (Low Growth, Low Market Share)
- 4.4. Ansoff Matrix Analysis
- 4.5. Supply Chain Analysis
- 4.6. Regulatory Landscape
- 4.7. Current Market Potential and Opportunity Assessment (TAM–SAM–SOM Framework)
- 4.8. PMV Analyst Note
- 4.1. Porters Five Forces
- 5. Market Analysis, Insights and Forecast 2021-2033
- 5.1. Market Analysis, Insights and Forecast - by Technology Type
- 5.1.1. Lithium-ion
- 5.1.2. Nickel-cadmium
- 5.1.3. Other Technology Types
- 5.2. Market Analysis, Insights and Forecast - by Region
- 5.2.1. North America
- 5.2.2. Europe
- 5.2.3. Asia Pacific
- 5.2.4. South America
- 5.2.5. Middle East and Africa
- 5.1. Market Analysis, Insights and Forecast - by Technology Type
- 6. Global Cordless Power Tool Battery Industry Analysis, Insights and Forecast, 2021-2033
- 6.1. Market Analysis, Insights and Forecast - by Technology Type
- 6.1.1. Lithium-ion
- 6.1.2. Nickel-cadmium
- 6.1.3. Other Technology Types
- 6.1. Market Analysis, Insights and Forecast - by Technology Type
- 7. North America Cordless Power Tool Battery Industry Analysis, Insights and Forecast, 2020-2032
- 7.1. Market Analysis, Insights and Forecast - by Technology Type
- 7.1.1. Lithium-ion
- 7.1.2. Nickel-cadmium
- 7.1.3. Other Technology Types
- 7.1. Market Analysis, Insights and Forecast - by Technology Type
- 8. Europe Cordless Power Tool Battery Industry Analysis, Insights and Forecast, 2020-2032
- 8.1. Market Analysis, Insights and Forecast - by Technology Type
- 8.1.1. Lithium-ion
- 8.1.2. Nickel-cadmium
- 8.1.3. Other Technology Types
- 8.1. Market Analysis, Insights and Forecast - by Technology Type
- 9. Asia Pacific Cordless Power Tool Battery Industry Analysis, Insights and Forecast, 2020-2032
- 9.1. Market Analysis, Insights and Forecast - by Technology Type
- 9.1.1. Lithium-ion
- 9.1.2. Nickel-cadmium
- 9.1.3. Other Technology Types
- 9.1. Market Analysis, Insights and Forecast - by Technology Type
- 10. South America Cordless Power Tool Battery Industry Analysis, Insights and Forecast, 2020-2032
- 10.1. Market Analysis, Insights and Forecast - by Technology Type
- 10.1.1. Lithium-ion
- 10.1.2. Nickel-cadmium
- 10.1.3. Other Technology Types
- 10.1. Market Analysis, Insights and Forecast - by Technology Type
- 11. Middle East and Africa Cordless Power Tool Battery Industry Analysis, Insights and Forecast, 2020-2032
- 11.1. Market Analysis, Insights and Forecast - by Technology Type
- 11.1.1. Lithium-ion
- 11.1.2. Nickel-cadmium
- 11.1.3. Other Technology Types
- 11.1. Market Analysis, Insights and Forecast - by Technology Type
- 12. Competitive Analysis
- 12.1. Company Profiles
- 12.1.1 Ryobi Limited
- 12.1.1.1. Company Overview
- 12.1.1.2. Products
- 12.1.1.3. Company Financials
- 12.1.1.4. SWOT Analysis
- 12.1.2 Samsung SDI Co Ltd
- 12.1.2.1. Company Overview
- 12.1.2.2. Products
- 12.1.2.3. Company Financials
- 12.1.2.4. SWOT Analysis
- 12.1.3 Stanley Black & Decker Inc
- 12.1.3.1. Company Overview
- 12.1.3.2. Products
- 12.1.3.3. Company Financials
- 12.1.3.4. SWOT Analysis
- 12.1.4 Hitachi Ltd
- 12.1.4.1. Company Overview
- 12.1.4.2. Products
- 12.1.4.3. Company Financials
- 12.1.4.4. SWOT Analysis
- 12.1.5 Techtronic Industries Company Limited
- 12.1.5.1. Company Overview
- 12.1.5.2. Products
- 12.1.5.3. Company Financials
- 12.1.5.4. SWOT Analysis
- 12.1.6 Hilti Corporation*List Not Exhaustive 6 4 Market Ranking/Share (%) Analysi
- 12.1.6.1. Company Overview
- 12.1.6.2. Products
- 12.1.6.3. Company Financials
- 12.1.6.4. SWOT Analysis
- 12.1.7 Sony Group Corporation
- 12.1.7.1. Company Overview
- 12.1.7.2. Products
- 12.1.7.3. Company Financials
- 12.1.7.4. SWOT Analysis
- 12.1.8 Bosch Ltd
- 12.1.8.1. Company Overview
- 12.1.8.2. Products
- 12.1.8.3. Company Financials
- 12.1.8.4. SWOT Analysis
- 12.1.9 Panasonic Corporation
- 12.1.9.1. Company Overview
- 12.1.9.2. Products
- 12.1.9.3. Company Financials
- 12.1.9.4. SWOT Analysis
- 12.1.10 Makita Corporation
- 12.1.10.1. Company Overview
- 12.1.10.2. Products
- 12.1.10.3. Company Financials
- 12.1.10.4. SWOT Analysis
- 12.1.1 Ryobi Limited
- 12.2. Market Entropy
- 12.2.1 Company's Key Areas Served
- 12.2.2 Recent Developments
- 12.3. Company Market Share Analysis 2025
- 12.3.1 Top 5 Companies Market Share Analysis
- 12.3.2 Top 3 Companies Market Share Analysis
- 12.4. List of Potential Customers
- 13. Research Methodology
List of Figures
- Figure 1: Global Cordless Power Tool Battery Industry Revenue Breakdown (Million, %) by Region 2025 & 2033
- Figure 2: Global Cordless Power Tool Battery Industry Volume Breakdown (K Unit, %) by Region 2025 & 2033
- Figure 3: North America Cordless Power Tool Battery Industry Revenue (Million), by Technology Type 2025 & 2033
- Figure 4: North America Cordless Power Tool Battery Industry Volume (K Unit), by Technology Type 2025 & 2033
- Figure 5: North America Cordless Power Tool Battery Industry Revenue Share (%), by Technology Type 2025 & 2033
- Figure 6: North America Cordless Power Tool Battery Industry Volume Share (%), by Technology Type 2025 & 2033
- Figure 7: North America Cordless Power Tool Battery Industry Revenue (Million), by Country 2025 & 2033
- Figure 8: North America Cordless Power Tool Battery Industry Volume (K Unit), by Country 2025 & 2033
- Figure 9: North America Cordless Power Tool Battery Industry Revenue Share (%), by Country 2025 & 2033
- Figure 10: North America Cordless Power Tool Battery Industry Volume Share (%), by Country 2025 & 2033
- Figure 11: Europe Cordless Power Tool Battery Industry Revenue (Million), by Technology Type 2025 & 2033
- Figure 12: Europe Cordless Power Tool Battery Industry Volume (K Unit), by Technology Type 2025 & 2033
- Figure 13: Europe Cordless Power Tool Battery Industry Revenue Share (%), by Technology Type 2025 & 2033
- Figure 14: Europe Cordless Power Tool Battery Industry Volume Share (%), by Technology Type 2025 & 2033
- Figure 15: Europe Cordless Power Tool Battery Industry Revenue (Million), by Country 2025 & 2033
- Figure 16: Europe Cordless Power Tool Battery Industry Volume (K Unit), by Country 2025 & 2033
- Figure 17: Europe Cordless Power Tool Battery Industry Revenue Share (%), by Country 2025 & 2033
- Figure 18: Europe Cordless Power Tool Battery Industry Volume Share (%), by Country 2025 & 2033
- Figure 19: Asia Pacific Cordless Power Tool Battery Industry Revenue (Million), by Technology Type 2025 & 2033
- Figure 20: Asia Pacific Cordless Power Tool Battery Industry Volume (K Unit), by Technology Type 2025 & 2033
- Figure 21: Asia Pacific Cordless Power Tool Battery Industry Revenue Share (%), by Technology Type 2025 & 2033
- Figure 22: Asia Pacific Cordless Power Tool Battery Industry Volume Share (%), by Technology Type 2025 & 2033
- Figure 23: Asia Pacific Cordless Power Tool Battery Industry Revenue (Million), by Country 2025 & 2033
- Figure 24: Asia Pacific Cordless Power Tool Battery Industry Volume (K Unit), by Country 2025 & 2033
- Figure 25: Asia Pacific Cordless Power Tool Battery Industry Revenue Share (%), by Country 2025 & 2033
- Figure 26: Asia Pacific Cordless Power Tool Battery Industry Volume Share (%), by Country 2025 & 2033
- Figure 27: South America Cordless Power Tool Battery Industry Revenue (Million), by Technology Type 2025 & 2033
- Figure 28: South America Cordless Power Tool Battery Industry Volume (K Unit), by Technology Type 2025 & 2033
- Figure 29: South America Cordless Power Tool Battery Industry Revenue Share (%), by Technology Type 2025 & 2033
- Figure 30: South America Cordless Power Tool Battery Industry Volume Share (%), by Technology Type 2025 & 2033
- Figure 31: South America Cordless Power Tool Battery Industry Revenue (Million), by Country 2025 & 2033
- Figure 32: South America Cordless Power Tool Battery Industry Volume (K Unit), by Country 2025 & 2033
- Figure 33: South America Cordless Power Tool Battery Industry Revenue Share (%), by Country 2025 & 2033
- Figure 34: South America Cordless Power Tool Battery Industry Volume Share (%), by Country 2025 & 2033
- Figure 35: Middle East and Africa Cordless Power Tool Battery Industry Revenue (Million), by Technology Type 2025 & 2033
- Figure 36: Middle East and Africa Cordless Power Tool Battery Industry Volume (K Unit), by Technology Type 2025 & 2033
- Figure 37: Middle East and Africa Cordless Power Tool Battery Industry Revenue Share (%), by Technology Type 2025 & 2033
- Figure 38: Middle East and Africa Cordless Power Tool Battery Industry Volume Share (%), by Technology Type 2025 & 2033
- Figure 39: Middle East and Africa Cordless Power Tool Battery Industry Revenue (Million), by Country 2025 & 2033
- Figure 40: Middle East and Africa Cordless Power Tool Battery Industry Volume (K Unit), by Country 2025 & 2033
- Figure 41: Middle East and Africa Cordless Power Tool Battery Industry Revenue Share (%), by Country 2025 & 2033
- Figure 42: Middle East and Africa Cordless Power Tool Battery Industry Volume Share (%), by Country 2025 & 2033
List of Tables
- Table 1: Global Cordless Power Tool Battery Industry Revenue Million Forecast, by Technology Type 2020 & 2033
- Table 2: Global Cordless Power Tool Battery Industry Volume K Unit Forecast, by Technology Type 2020 & 2033
- Table 3: Global Cordless Power Tool Battery Industry Revenue Million Forecast, by Region 2020 & 2033
- Table 4: Global Cordless Power Tool Battery Industry Volume K Unit Forecast, by Region 2020 & 2033
- Table 5: Global Cordless Power Tool Battery Industry Revenue Million Forecast, by Technology Type 2020 & 2033
- Table 6: Global Cordless Power Tool Battery Industry Volume K Unit Forecast, by Technology Type 2020 & 2033
- Table 7: Global Cordless Power Tool Battery Industry Revenue Million Forecast, by Country 2020 & 2033
- Table 8: Global Cordless Power Tool Battery Industry Volume K Unit Forecast, by Country 2020 & 2033
- Table 9: United States Cordless Power Tool Battery Industry Revenue (Million) Forecast, by Application 2020 & 2033
- Table 10: United States Cordless Power Tool Battery Industry Volume (K Unit) Forecast, by Application 2020 & 2033
- Table 11: Canada Cordless Power Tool Battery Industry Revenue (Million) Forecast, by Application 2020 & 2033
- Table 12: Canada Cordless Power Tool Battery Industry Volume (K Unit) Forecast, by Application 2020 & 2033
- Table 13: Rest of North America Cordless Power Tool Battery Industry Revenue (Million) Forecast, by Application 2020 & 2033
- Table 14: Rest of North America Cordless Power Tool Battery Industry Volume (K Unit) Forecast, by Application 2020 & 2033
- Table 15: Global Cordless Power Tool Battery Industry Revenue Million Forecast, by Technology Type 2020 & 2033
- Table 16: Global Cordless Power Tool Battery Industry Volume K Unit Forecast, by Technology Type 2020 & 2033
- Table 17: Global Cordless Power Tool Battery Industry Revenue Million Forecast, by Country 2020 & 2033
- Table 18: Global Cordless Power Tool Battery Industry Volume K Unit Forecast, by Country 2020 & 2033
- Table 19: Germany Cordless Power Tool Battery Industry Revenue (Million) Forecast, by Application 2020 & 2033
- Table 20: Germany Cordless Power Tool Battery Industry Volume (K Unit) Forecast, by Application 2020 & 2033
- Table 21: France Cordless Power Tool Battery Industry Revenue (Million) Forecast, by Application 2020 & 2033
- Table 22: France Cordless Power Tool Battery Industry Volume (K Unit) Forecast, by Application 2020 & 2033
- Table 23: United Kingdom Cordless Power Tool Battery Industry Revenue (Million) Forecast, by Application 2020 & 2033
- Table 24: United Kingdom Cordless Power Tool Battery Industry Volume (K Unit) Forecast, by Application 2020 & 2033
- Table 25: Italy Cordless Power Tool Battery Industry Revenue (Million) Forecast, by Application 2020 & 2033
- Table 26: Italy Cordless Power Tool Battery Industry Volume (K Unit) Forecast, by Application 2020 & 2033
- Table 27: Rest of Europe Cordless Power Tool Battery Industry Revenue (Million) Forecast, by Application 2020 & 2033
- Table 28: Rest of Europe Cordless Power Tool Battery Industry Volume (K Unit) Forecast, by Application 2020 & 2033
- Table 29: Global Cordless Power Tool Battery Industry Revenue Million Forecast, by Technology Type 2020 & 2033
- Table 30: Global Cordless Power Tool Battery Industry Volume K Unit Forecast, by Technology Type 2020 & 2033
- Table 31: Global Cordless Power Tool Battery Industry Revenue Million Forecast, by Country 2020 & 2033
- Table 32: Global Cordless Power Tool Battery Industry Volume K Unit Forecast, by Country 2020 & 2033
- Table 33: China Cordless Power Tool Battery Industry Revenue (Million) Forecast, by Application 2020 & 2033
- Table 34: China Cordless Power Tool Battery Industry Volume (K Unit) Forecast, by Application 2020 & 2033
- Table 35: India Cordless Power Tool Battery Industry Revenue (Million) Forecast, by Application 2020 & 2033
- Table 36: India Cordless Power Tool Battery Industry Volume (K Unit) Forecast, by Application 2020 & 2033
- Table 37: Japan Cordless Power Tool Battery Industry Revenue (Million) Forecast, by Application 2020 & 2033
- Table 38: Japan Cordless Power Tool Battery Industry Volume (K Unit) Forecast, by Application 2020 & 2033
- Table 39: Australia Cordless Power Tool Battery Industry Revenue (Million) Forecast, by Application 2020 & 2033
- Table 40: Australia Cordless Power Tool Battery Industry Volume (K Unit) Forecast, by Application 2020 & 2033
- Table 41: Rest of Asia Pacific Cordless Power Tool Battery Industry Revenue (Million) Forecast, by Application 2020 & 2033
- Table 42: Rest of Asia Pacific Cordless Power Tool Battery Industry Volume (K Unit) Forecast, by Application 2020 & 2033
- Table 43: Global Cordless Power Tool Battery Industry Revenue Million Forecast, by Technology Type 2020 & 2033
- Table 44: Global Cordless Power Tool Battery Industry Volume K Unit Forecast, by Technology Type 2020 & 2033
- Table 45: Global Cordless Power Tool Battery Industry Revenue Million Forecast, by Country 2020 & 2033
- Table 46: Global Cordless Power Tool Battery Industry Volume K Unit Forecast, by Country 2020 & 2033
- Table 47: Brazil Cordless Power Tool Battery Industry Revenue (Million) Forecast, by Application 2020 & 2033
- Table 48: Brazil Cordless Power Tool Battery Industry Volume (K Unit) Forecast, by Application 2020 & 2033
- Table 49: Argentina Cordless Power Tool Battery Industry Revenue (Million) Forecast, by Application 2020 & 2033
- Table 50: Argentina Cordless Power Tool Battery Industry Volume (K Unit) Forecast, by Application 2020 & 2033
- Table 51: Chile Cordless Power Tool Battery Industry Revenue (Million) Forecast, by Application 2020 & 2033
- Table 52: Chile Cordless Power Tool Battery Industry Volume (K Unit) Forecast, by Application 2020 & 2033
- Table 53: Rest of South America Cordless Power Tool Battery Industry Revenue (Million) Forecast, by Application 2020 & 2033
- Table 54: Rest of South America Cordless Power Tool Battery Industry Volume (K Unit) Forecast, by Application 2020 & 2033
- Table 55: Global Cordless Power Tool Battery Industry Revenue Million Forecast, by Technology Type 2020 & 2033
- Table 56: Global Cordless Power Tool Battery Industry Volume K Unit Forecast, by Technology Type 2020 & 2033
- Table 57: Global Cordless Power Tool Battery Industry Revenue Million Forecast, by Country 2020 & 2033
- Table 58: Global Cordless Power Tool Battery Industry Volume K Unit Forecast, by Country 2020 & 2033
- Table 59: United Arab Emirates Cordless Power Tool Battery Industry Revenue (Million) Forecast, by Application 2020 & 2033
- Table 60: United Arab Emirates Cordless Power Tool Battery Industry Volume (K Unit) Forecast, by Application 2020 & 2033
- Table 61: Saudi Arabia Cordless Power Tool Battery Industry Revenue (Million) Forecast, by Application 2020 & 2033
- Table 62: Saudi Arabia Cordless Power Tool Battery Industry Volume (K Unit) Forecast, by Application 2020 & 2033
- Table 63: Qatar Cordless Power Tool Battery Industry Revenue (Million) Forecast, by Application 2020 & 2033
- Table 64: Qatar Cordless Power Tool Battery Industry Volume (K Unit) Forecast, by Application 2020 & 2033
- Table 65: South Africa Cordless Power Tool Battery Industry Revenue (Million) Forecast, by Application 2020 & 2033
- Table 66: South Africa Cordless Power Tool Battery Industry Volume (K Unit) Forecast, by Application 2020 & 2033
- Table 67: Egypt Cordless Power Tool Battery Industry Revenue (Million) Forecast, by Application 2020 & 2033
- Table 68: Egypt Cordless Power Tool Battery Industry Volume (K Unit) Forecast, by Application 2020 & 2033
- Table 69: Rest of Middle East and Africa Cordless Power Tool Battery Industry Revenue (Million) Forecast, by Application 2020 & 2033
- Table 70: Rest of Middle East and Africa Cordless Power Tool Battery Industry Volume (K Unit) Forecast, by Application 2020 & 2033
Frequently Asked Questions
1. What is the projected Compound Annual Growth Rate (CAGR) of the Cordless Power Tool Battery Industry?
The projected CAGR is approximately 8.30%.
2. Which companies are prominent players in the Cordless Power Tool Battery Industry?
Key companies in the market include Ryobi Limited, Samsung SDI Co Ltd, Stanley Black & Decker Inc, Hitachi Ltd, Techtronic Industries Company Limited, Hilti Corporation*List Not Exhaustive 6 4 Market Ranking/Share (%) Analysi, Sony Group Corporation, Bosch Ltd, Panasonic Corporation, Makita Corporation.
3. What are the main segments of the Cordless Power Tool Battery Industry?
The market segments include Technology Type.
4. Can you provide details about the market size?
The market size is estimated to be USD 2.78 Million as of 2022.
5. What are some drivers contributing to market growth?
4.; Increasing Adoption Of Battery-Powered Power Tools4.; Rapidly Growing Automotive Industry.
6. What are the notable trends driving market growth?
The Lithium-ion Type is Expected to Dominate the Market.
7. Are there any restraints impacting market growth?
4.; High Cost Associated With Cordless Power Tool Equipment.
8. Can you provide examples of recent developments in the market?
In January 2023, Hilti North America, a global leader providing innovative tools, technology, software, and services to the commercial construction industry announced that in 2023 more than 30 new cordless tools will be added to its portfolio of more than 70 existing Nuron battery-powered tools.
9. What pricing options are available for accessing the report?
Pricing options include single-user, multi-user, and enterprise licenses priced at USD 4750, USD 5250, and USD 8750 respectively.
10. Is the market size provided in terms of value or volume?
The market size is provided in terms of value, measured in Million and volume, measured in K Unit.
11. Are there any specific market keywords associated with the report?
Yes, the market keyword associated with the report is "Cordless Power Tool Battery Industry," which aids in identifying and referencing the specific market segment covered.
12. How do I determine which pricing option suits my needs best?
The pricing options vary based on user requirements and access needs. Individual users may opt for single-user licenses, while businesses requiring broader access may choose multi-user or enterprise licenses for cost-effective access to the report.
13. Are there any additional resources or data provided in the Cordless Power Tool Battery Industry report?
While the report offers comprehensive insights, it's advisable to review the specific contents or supplementary materials provided to ascertain if additional resources or data are available.
14. How can I stay updated on further developments or reports in the Cordless Power Tool Battery Industry?
To stay informed about further developments, trends, and reports in the Cordless Power Tool Battery Industry, consider subscribing to industry newsletters, following relevant companies and organizations, or regularly checking reputable industry news sources and publications.
Methodology
Step 1 - Identification of Relevant Samples Size from Population Database


Step 2 - Approaches for Defining Global Market Size (Value, Volume* & Price*)

Note*: In applicable scenarios
Step 3 - Data Sources
Primary Research
- Web Analytics
- Survey Reports
- Research Institute
- Latest Research Reports
- Opinion Leaders
Secondary Research
- Annual Reports
- White Paper
- Latest Press Release
- Industry Association
- Paid Database
- Investor Presentations

Step 4 - Data Triangulation
Involves using different sources of information in order to increase the validity of a study
These sources are likely to be stakeholders in a program - participants, other researchers, program staff, other community members, and so on.
Then we put all data in single framework & apply various statistical tools to find out the dynamic on the market.
During the analysis stage, feedback from the stakeholder groups would be compared to determine areas of agreement as well as areas of divergence