
Key Insights
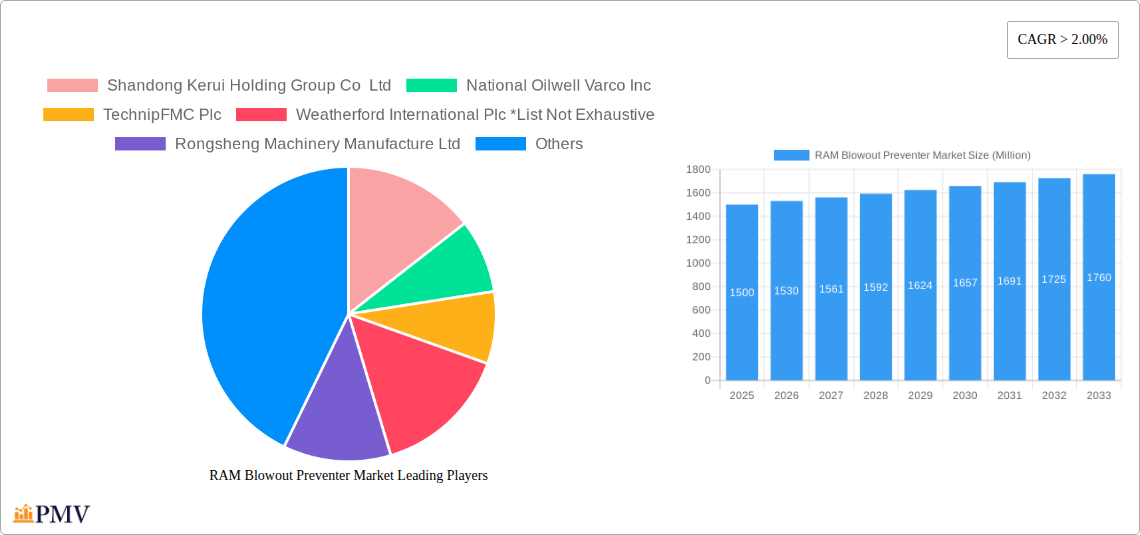
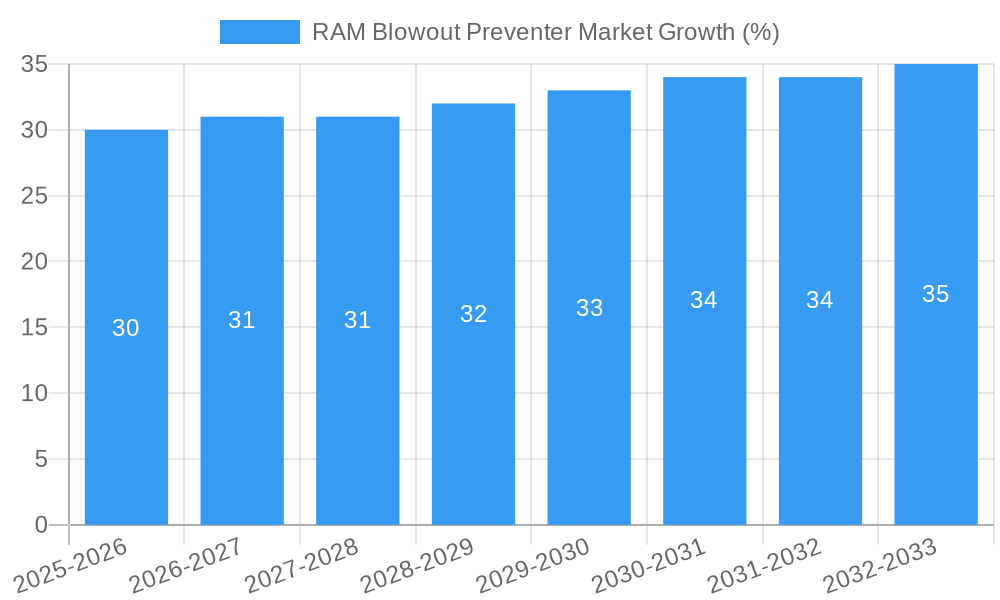
The RAM Blowout Preventer (BOP) market, valued at approximately $1.5 billion in 2025, is experiencing robust growth, projected to maintain a Compound Annual Growth Rate (CAGR) exceeding 2% through 2033. This expansion is fueled primarily by the increasing demand for oil and gas exploration and production activities globally, particularly in offshore environments where RAM BOPs are crucial for well control and safety. Technological advancements, such as the development of more efficient and reliable RAM BOP systems with enhanced automation and remote operation capabilities, are also contributing to market growth. Furthermore, stringent government regulations concerning well integrity and environmental protection are driving adoption across various regions. The market is segmented by type (Annular and RAM BOPs) and location of deployment (onshore and offshore), with the offshore segment expected to dominate due to the higher safety requirements and complexities associated with offshore drilling. Competition is intense, with major players like National Oilwell Varco, TechnipFMC, Weatherford, Baker Hughes, Halliburton, and Schlumberger holding significant market share, while regional players like Shandong Kerui are also gaining traction.
Despite the positive outlook, the market faces certain restraints. Fluctuations in oil and gas prices can directly impact investment in exploration and production, thus influencing the demand for RAM BOPs. Economic downturns and geopolitical instability in key oil and gas producing regions can further hinder market growth. The high initial investment cost associated with purchasing and maintaining these sophisticated systems presents another challenge, particularly for smaller operators. However, the long-term demand driven by the ongoing need for safe and efficient well control is expected to outweigh these challenges, ensuring continued market growth in the forecast period.
RAM Blowout Preventer Market: A Comprehensive Market Report (2019-2033)
This meticulously researched report provides a deep dive into the global RAM Blowout Preventer (BOP) market, offering comprehensive insights into market dynamics, competitive landscapes, and future growth prospects. The study covers the period from 2019 to 2033, with 2025 serving as the base and estimated year. The report is crucial for industry stakeholders, investors, and researchers seeking a detailed understanding of this critical sector within the oil and gas industry. The market is segmented by type (Annular BOP, Ram BOP) and location of deployment (Onshore, Offshore), enabling a granular analysis of market trends and opportunities.
This report is delivered without any further modification needed.
RAM Blowout Preventer Market Market Structure & Competitive Dynamics
The RAM Blowout Preventer market exhibits a moderately concentrated structure, with a handful of major players holding significant market share. These include Shandong Kerui Holding Group Co Ltd, National Oilwell Varco Inc, TechnipFMC Plc, Weatherford International Plc, Rongsheng Machinery Manufacture Ltd, Baker Hughes Company, Halliburton Company, and Schlumberger Company. However, the market also features several smaller, specialized players. The competitive landscape is characterized by intense innovation, with companies continually striving to improve the efficiency, reliability, and safety of their BOP systems. Market share data for 2024 suggests that the top five players collectively hold approximately 65% of the market, with the remaining share distributed amongst numerous smaller players. The M&A activity in the sector has been moderate in recent years, with deal values averaging approximately $XX Million per transaction. Regulatory frameworks, particularly concerning safety and environmental compliance, significantly impact market dynamics. The presence of substitute technologies remains limited, owing to the critical safety function of BOPs. End-user trends towards enhanced safety protocols and stricter regulatory compliance drive demand for advanced BOP systems.
RAM Blowout Preventer Market Industry Trends & Insights
The global RAM Blowout Preventer market is projected to experience a Compound Annual Growth Rate (CAGR) of XX% during the forecast period (2025-2033). Several factors contribute to this growth. The increasing global demand for oil and gas fuels expansion in exploration and production activities, driving the demand for reliable and efficient BOP systems. Technological advancements, such as the incorporation of automation and remote control capabilities, enhance operational efficiency and safety, fostering market growth. Furthermore, the increasing emphasis on stringent safety regulations and environmental protection standards pushes adoption of advanced BOP technologies. Consumer preference for higher-quality, reliable, and safer equipment contributes significantly to market expansion. Market penetration of advanced BOP systems, particularly those incorporating smart technologies and remote diagnostics, is steadily increasing, with an estimated XX% penetration rate in 2024. Competitive dynamics within the market are intensely focused on innovation, technological advancements, and cost optimization.
Dominant Markets & Segments in RAM Blowout Preventer Market
The Offshore segment dominates the RAM Blowout Preventer market, accounting for approximately XX% of the total market value in 2024. This dominance is primarily attributable to the higher risk associated with offshore drilling operations, necessitating robust and reliable BOP systems.
- Key Drivers for Offshore Dominance:
- Higher regulatory compliance requirements.
- Increased complexity and cost of offshore drilling operations.
- Higher demand for advanced BOP systems with enhanced safety features.
- Significant investment in offshore oil and gas exploration and production.
The Ram BOP type holds a larger market share than Annular BOP, primarily driven by its wider applicability across various well types and pressure conditions.
- Key Drivers for Ram BOP Dominance:
- Versatility in handling diverse well conditions.
- Superior sealing capabilities for high-pressure applications.
- Wider acceptance across various regions and operators.
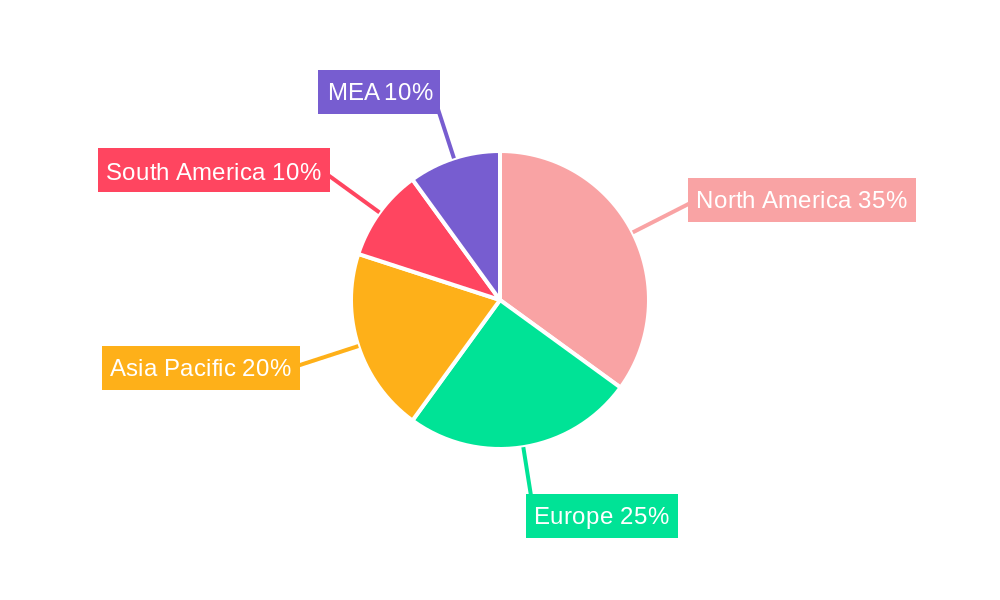
Geographically, the North American market maintains its leading position, driven by significant oil and gas activities in the region. However, the Asia-Pacific region is poised for substantial growth, owing to the rising investments in offshore oil and gas exploration and production.
- Key Drivers for North American Dominance:
- Extensive oil and gas infrastructure.
- Stringent safety regulations.
- High level of technological advancement.
RAM Blowout Preventer Market Product Innovations
Recent product innovations in the RAM Blowout Preventer market focus on enhancing safety, reliability, and efficiency. This includes the development of BOPs with improved sealing mechanisms, advanced control systems, and integrated diagnostic capabilities. The integration of smart sensors and data analytics enhances predictive maintenance and reduces downtime. These innovations cater to the growing demand for improved safety protocols and operational efficiency, aligning perfectly with industry trends and enhancing the competitive advantage of manufacturers.
Report Segmentation & Scope
This report segments the RAM Blowout Preventer market based on Type (Annular BOP, Ram BOP) and Location of Deployment (Onshore, Offshore). The Annular BOP segment is projected to witness a CAGR of XX% during the forecast period, driven by its increasing use in various applications. The Ram BOP segment is anticipated to exhibit a CAGR of XX%, fueled by the rising demand for reliable sealing solutions in high-pressure environments. The Onshore segment is projected to grow at a CAGR of XX%, while the Offshore segment is expected to achieve a CAGR of XX%, reflecting the higher risk and investment in offshore operations. Each segment is characterized by varying competitive dynamics and growth drivers, offering distinct investment opportunities.
Key Drivers of RAM Blowout Preventer Market Growth
Several factors propel the growth of the RAM Blowout Preventer market. Technological advancements, such as automation and remote monitoring, enhance efficiency and safety. Stringent safety regulations across the globe mandate the use of advanced BOP systems, driving market growth. Furthermore, rising global oil and gas demand fuels increased exploration and production activities, stimulating demand for these crucial safety components. Economic factors, including increasing investment in the oil and gas sector, contribute to market expansion.
Challenges in the RAM Blowout Preventer Market Sector
Despite the significant growth opportunities, the RAM Blowout Preventer market faces certain challenges. Stringent regulatory compliance and certification processes present hurdles for manufacturers. Supply chain disruptions and fluctuations in raw material prices can impact profitability. Intense competition among established players and emerging entrants presents ongoing pressure to innovate and optimize costs. These challenges necessitate careful strategic planning and adaptation to maintain market competitiveness. The estimated impact of these challenges on market growth is approximately XX% reduction in projected growth in the year XX.
Leading Players in the RAM Blowout Preventer Market Market
- Shandong Kerui Holding Group Co Ltd
- National Oilwell Varco Inc
- TechnipFMC Plc
- Weatherford International Plc
- Rongsheng Machinery Manufacture Ltd
- Baker Hughes Company
- Halliburton Company
- Schlumberger Company
Key Developments in RAM Blowout Preventer Market Sector
- January 2023: National Oilwell Varco launches a new generation of high-pressure BOP with enhanced safety features.
- June 2022: Baker Hughes announces a strategic partnership to develop advanced BOP control systems.
- October 2021: Weatherford International acquires a specialized BOP manufacturer, expanding its product portfolio.
- Further key developments will be detailed within the full report.
Strategic RAM Blowout Preventer Market Market Outlook
The future of the RAM Blowout Preventer market appears promising, driven by the sustained growth in the global oil and gas industry and the ongoing need for robust safety measures. Technological advancements, coupled with increasing regulatory scrutiny, will continue to shape market dynamics. Strategic opportunities exist for manufacturers to innovate, optimize operations, and cater to the specific needs of diverse market segments. Focus on enhancing safety, reliability, and efficiency will be critical for capturing market share and achieving sustainable growth in the years to come.
RAM Blowout Preventer Market Segmentation
-
1. Type
- 1.1. Annular BOP
- 1.2. Ram BOP
-
2. Location of Deployment
- 2.1. Onshore
- 2.2. Offshore
RAM Blowout Preventer Market Segmentation By Geography
- 1. North America
- 2. Europe
- 3. Asia Pacific
- 4. South America
- 5. Middle East and Africa
RAM Blowout Preventer Market REPORT HIGHLIGHTS
| Aspects | Details |
|---|---|
| Study Period | 2019-2033 |
| Base Year | 2024 |
| Estimated Year | 2025 |
| Forecast Period | 2025-2033 |
| Historical Period | 2019-2024 |
| Growth Rate | CAGR of > 2.00% from 2019-2033 |
| Segmentation |
|
Table of Contents
- 1. Introduction
- 1.1. Research Scope
- 1.2. Market Segmentation
- 1.3. Research Methodology
- 1.4. Definitions and Assumptions
- 2. Executive Summary
- 2.1. Introduction
- 3. Market Dynamics
- 3.1. Introduction
- 3.2. Market Drivers
- 3.2.1. 4.; Growing demand for natural gas and developing gas infrastructure4.; Increasing offshore oil and Gas Exploration Activities
- 3.3. Market Restrains
- 3.3.1. 4.; Adoption of Cleaner Alternatives
- 3.4. Market Trends
- 3.4.1. Offshore Segment to Dominate the Market
- 4. Market Factor Analysis
- 4.1. Porters Five Forces
- 4.2. Supply/Value Chain
- 4.3. PESTEL analysis
- 4.4. Market Entropy
- 4.5. Patent/Trademark Analysis
- 5. Global RAM Blowout Preventer Market Analysis, Insights and Forecast, 2019-2031
- 5.1. Market Analysis, Insights and Forecast - by Type
- 5.1.1. Annular BOP
- 5.1.2. Ram BOP
- 5.2. Market Analysis, Insights and Forecast - by Location of Deployment
- 5.2.1. Onshore
- 5.2.2. Offshore
- 5.3. Market Analysis, Insights and Forecast - by Region
- 5.3.1. North America
- 5.3.2. Europe
- 5.3.3. Asia Pacific
- 5.3.4. South America
- 5.3.5. Middle East and Africa
- 5.1. Market Analysis, Insights and Forecast - by Type
- 6. North America RAM Blowout Preventer Market Analysis, Insights and Forecast, 2019-2031
- 6.1. Market Analysis, Insights and Forecast - by Type
- 6.1.1. Annular BOP
- 6.1.2. Ram BOP
- 6.2. Market Analysis, Insights and Forecast - by Location of Deployment
- 6.2.1. Onshore
- 6.2.2. Offshore
- 6.1. Market Analysis, Insights and Forecast - by Type
- 7. Europe RAM Blowout Preventer Market Analysis, Insights and Forecast, 2019-2031
- 7.1. Market Analysis, Insights and Forecast - by Type
- 7.1.1. Annular BOP
- 7.1.2. Ram BOP
- 7.2. Market Analysis, Insights and Forecast - by Location of Deployment
- 7.2.1. Onshore
- 7.2.2. Offshore
- 7.1. Market Analysis, Insights and Forecast - by Type
- 8. Asia Pacific RAM Blowout Preventer Market Analysis, Insights and Forecast, 2019-2031
- 8.1. Market Analysis, Insights and Forecast - by Type
- 8.1.1. Annular BOP
- 8.1.2. Ram BOP
- 8.2. Market Analysis, Insights and Forecast - by Location of Deployment
- 8.2.1. Onshore
- 8.2.2. Offshore
- 8.1. Market Analysis, Insights and Forecast - by Type
- 9. South America RAM Blowout Preventer Market Analysis, Insights and Forecast, 2019-2031
- 9.1. Market Analysis, Insights and Forecast - by Type
- 9.1.1. Annular BOP
- 9.1.2. Ram BOP
- 9.2. Market Analysis, Insights and Forecast - by Location of Deployment
- 9.2.1. Onshore
- 9.2.2. Offshore
- 9.1. Market Analysis, Insights and Forecast - by Type
- 10. Middle East and Africa RAM Blowout Preventer Market Analysis, Insights and Forecast, 2019-2031
- 10.1. Market Analysis, Insights and Forecast - by Type
- 10.1.1. Annular BOP
- 10.1.2. Ram BOP
- 10.2. Market Analysis, Insights and Forecast - by Location of Deployment
- 10.2.1. Onshore
- 10.2.2. Offshore
- 10.1. Market Analysis, Insights and Forecast - by Type
- 11. North America RAM Blowout Preventer Market Analysis, Insights and Forecast, 2019-2031
- 11.1. Market Analysis, Insights and Forecast - By Country/Sub-region
- 11.1.1 United States
- 11.1.2 Canada
- 11.1.3 Mexico
- 12. Europe RAM Blowout Preventer Market Analysis, Insights and Forecast, 2019-2031
- 12.1. Market Analysis, Insights and Forecast - By Country/Sub-region
- 12.1.1 Germany
- 12.1.2 United Kingdom
- 12.1.3 France
- 12.1.4 Spain
- 12.1.5 Italy
- 12.1.6 Spain
- 12.1.7 Belgium
- 12.1.8 Netherland
- 12.1.9 Nordics
- 12.1.10 Rest of Europe
- 13. Asia Pacific RAM Blowout Preventer Market Analysis, Insights and Forecast, 2019-2031
- 13.1. Market Analysis, Insights and Forecast - By Country/Sub-region
- 13.1.1 China
- 13.1.2 Japan
- 13.1.3 India
- 13.1.4 South Korea
- 13.1.5 Southeast Asia
- 13.1.6 Australia
- 13.1.7 Indonesia
- 13.1.8 Phillipes
- 13.1.9 Singapore
- 13.1.10 Thailandc
- 13.1.11 Rest of Asia Pacific
- 14. South America RAM Blowout Preventer Market Analysis, Insights and Forecast, 2019-2031
- 14.1. Market Analysis, Insights and Forecast - By Country/Sub-region
- 14.1.1 Brazil
- 14.1.2 Argentina
- 14.1.3 Peru
- 14.1.4 Chile
- 14.1.5 Colombia
- 14.1.6 Ecuador
- 14.1.7 Venezuela
- 14.1.8 Rest of South America
- 15. North America RAM Blowout Preventer Market Analysis, Insights and Forecast, 2019-2031
- 15.1. Market Analysis, Insights and Forecast - By Country/Sub-region
- 15.1.1 United States
- 15.1.2 Canada
- 15.1.3 Mexico
- 16. MEA RAM Blowout Preventer Market Analysis, Insights and Forecast, 2019-2031
- 16.1. Market Analysis, Insights and Forecast - By Country/Sub-region
- 16.1.1 United Arab Emirates
- 16.1.2 Saudi Arabia
- 16.1.3 South Africa
- 16.1.4 Rest of Middle East and Africa
- 17. Competitive Analysis
- 17.1. Global Market Share Analysis 2024
- 17.2. Company Profiles
- 17.2.1 Shandong Kerui Holding Group Co Ltd
- 17.2.1.1. Overview
- 17.2.1.2. Products
- 17.2.1.3. SWOT Analysis
- 17.2.1.4. Recent Developments
- 17.2.1.5. Financials (Based on Availability)
- 17.2.2 National Oilwell Varco Inc
- 17.2.2.1. Overview
- 17.2.2.2. Products
- 17.2.2.3. SWOT Analysis
- 17.2.2.4. Recent Developments
- 17.2.2.5. Financials (Based on Availability)
- 17.2.3 TechnipFMC Plc
- 17.2.3.1. Overview
- 17.2.3.2. Products
- 17.2.3.3. SWOT Analysis
- 17.2.3.4. Recent Developments
- 17.2.3.5. Financials (Based on Availability)
- 17.2.4 Weatherford International Plc *List Not Exhaustive
- 17.2.4.1. Overview
- 17.2.4.2. Products
- 17.2.4.3. SWOT Analysis
- 17.2.4.4. Recent Developments
- 17.2.4.5. Financials (Based on Availability)
- 17.2.5 Rongsheng Machinery Manufacture Ltd
- 17.2.5.1. Overview
- 17.2.5.2. Products
- 17.2.5.3. SWOT Analysis
- 17.2.5.4. Recent Developments
- 17.2.5.5. Financials (Based on Availability)
- 17.2.6 Baker Hughes Company
- 17.2.6.1. Overview
- 17.2.6.2. Products
- 17.2.6.3. SWOT Analysis
- 17.2.6.4. Recent Developments
- 17.2.6.5. Financials (Based on Availability)
- 17.2.7 Halliburton Company
- 17.2.7.1. Overview
- 17.2.7.2. Products
- 17.2.7.3. SWOT Analysis
- 17.2.7.4. Recent Developments
- 17.2.7.5. Financials (Based on Availability)
- 17.2.8 Schlumberger Company
- 17.2.8.1. Overview
- 17.2.8.2. Products
- 17.2.8.3. SWOT Analysis
- 17.2.8.4. Recent Developments
- 17.2.8.5. Financials (Based on Availability)
- 17.2.1 Shandong Kerui Holding Group Co Ltd
List of Figures
- Figure 1: Global RAM Blowout Preventer Market Revenue Breakdown (Million, %) by Region 2024 & 2032
- Figure 2: North America RAM Blowout Preventer Market Revenue (Million), by Country 2024 & 2032
- Figure 3: North America RAM Blowout Preventer Market Revenue Share (%), by Country 2024 & 2032
- Figure 4: Europe RAM Blowout Preventer Market Revenue (Million), by Country 2024 & 2032
- Figure 5: Europe RAM Blowout Preventer Market Revenue Share (%), by Country 2024 & 2032
- Figure 6: Asia Pacific RAM Blowout Preventer Market Revenue (Million), by Country 2024 & 2032
- Figure 7: Asia Pacific RAM Blowout Preventer Market Revenue Share (%), by Country 2024 & 2032
- Figure 8: South America RAM Blowout Preventer Market Revenue (Million), by Country 2024 & 2032
- Figure 9: South America RAM Blowout Preventer Market Revenue Share (%), by Country 2024 & 2032
- Figure 10: North America RAM Blowout Preventer Market Revenue (Million), by Country 2024 & 2032
- Figure 11: North America RAM Blowout Preventer Market Revenue Share (%), by Country 2024 & 2032
- Figure 12: MEA RAM Blowout Preventer Market Revenue (Million), by Country 2024 & 2032
- Figure 13: MEA RAM Blowout Preventer Market Revenue Share (%), by Country 2024 & 2032
- Figure 14: North America RAM Blowout Preventer Market Revenue (Million), by Type 2024 & 2032
- Figure 15: North America RAM Blowout Preventer Market Revenue Share (%), by Type 2024 & 2032
- Figure 16: North America RAM Blowout Preventer Market Revenue (Million), by Location of Deployment 2024 & 2032
- Figure 17: North America RAM Blowout Preventer Market Revenue Share (%), by Location of Deployment 2024 & 2032
- Figure 18: North America RAM Blowout Preventer Market Revenue (Million), by Country 2024 & 2032
- Figure 19: North America RAM Blowout Preventer Market Revenue Share (%), by Country 2024 & 2032
- Figure 20: Europe RAM Blowout Preventer Market Revenue (Million), by Type 2024 & 2032
- Figure 21: Europe RAM Blowout Preventer Market Revenue Share (%), by Type 2024 & 2032
- Figure 22: Europe RAM Blowout Preventer Market Revenue (Million), by Location of Deployment 2024 & 2032
- Figure 23: Europe RAM Blowout Preventer Market Revenue Share (%), by Location of Deployment 2024 & 2032
- Figure 24: Europe RAM Blowout Preventer Market Revenue (Million), by Country 2024 & 2032
- Figure 25: Europe RAM Blowout Preventer Market Revenue Share (%), by Country 2024 & 2032
- Figure 26: Asia Pacific RAM Blowout Preventer Market Revenue (Million), by Type 2024 & 2032
- Figure 27: Asia Pacific RAM Blowout Preventer Market Revenue Share (%), by Type 2024 & 2032
- Figure 28: Asia Pacific RAM Blowout Preventer Market Revenue (Million), by Location of Deployment 2024 & 2032
- Figure 29: Asia Pacific RAM Blowout Preventer Market Revenue Share (%), by Location of Deployment 2024 & 2032
- Figure 30: Asia Pacific RAM Blowout Preventer Market Revenue (Million), by Country 2024 & 2032
- Figure 31: Asia Pacific RAM Blowout Preventer Market Revenue Share (%), by Country 2024 & 2032
- Figure 32: South America RAM Blowout Preventer Market Revenue (Million), by Type 2024 & 2032
- Figure 33: South America RAM Blowout Preventer Market Revenue Share (%), by Type 2024 & 2032
- Figure 34: South America RAM Blowout Preventer Market Revenue (Million), by Location of Deployment 2024 & 2032
- Figure 35: South America RAM Blowout Preventer Market Revenue Share (%), by Location of Deployment 2024 & 2032
- Figure 36: South America RAM Blowout Preventer Market Revenue (Million), by Country 2024 & 2032
- Figure 37: South America RAM Blowout Preventer Market Revenue Share (%), by Country 2024 & 2032
- Figure 38: Middle East and Africa RAM Blowout Preventer Market Revenue (Million), by Type 2024 & 2032
- Figure 39: Middle East and Africa RAM Blowout Preventer Market Revenue Share (%), by Type 2024 & 2032
- Figure 40: Middle East and Africa RAM Blowout Preventer Market Revenue (Million), by Location of Deployment 2024 & 2032
- Figure 41: Middle East and Africa RAM Blowout Preventer Market Revenue Share (%), by Location of Deployment 2024 & 2032
- Figure 42: Middle East and Africa RAM Blowout Preventer Market Revenue (Million), by Country 2024 & 2032
- Figure 43: Middle East and Africa RAM Blowout Preventer Market Revenue Share (%), by Country 2024 & 2032
List of Tables
- Table 1: Global RAM Blowout Preventer Market Revenue Million Forecast, by Region 2019 & 2032
- Table 2: Global RAM Blowout Preventer Market Revenue Million Forecast, by Type 2019 & 2032
- Table 3: Global RAM Blowout Preventer Market Revenue Million Forecast, by Location of Deployment 2019 & 2032
- Table 4: Global RAM Blowout Preventer Market Revenue Million Forecast, by Region 2019 & 2032
- Table 5: Global RAM Blowout Preventer Market Revenue Million Forecast, by Country 2019 & 2032
- Table 6: United States RAM Blowout Preventer Market Revenue (Million) Forecast, by Application 2019 & 2032
- Table 7: Canada RAM Blowout Preventer Market Revenue (Million) Forecast, by Application 2019 & 2032
- Table 8: Mexico RAM Blowout Preventer Market Revenue (Million) Forecast, by Application 2019 & 2032
- Table 9: Global RAM Blowout Preventer Market Revenue Million Forecast, by Country 2019 & 2032
- Table 10: Germany RAM Blowout Preventer Market Revenue (Million) Forecast, by Application 2019 & 2032
- Table 11: United Kingdom RAM Blowout Preventer Market Revenue (Million) Forecast, by Application 2019 & 2032
- Table 12: France RAM Blowout Preventer Market Revenue (Million) Forecast, by Application 2019 & 2032
- Table 13: Spain RAM Blowout Preventer Market Revenue (Million) Forecast, by Application 2019 & 2032
- Table 14: Italy RAM Blowout Preventer Market Revenue (Million) Forecast, by Application 2019 & 2032
- Table 15: Spain RAM Blowout Preventer Market Revenue (Million) Forecast, by Application 2019 & 2032
- Table 16: Belgium RAM Blowout Preventer Market Revenue (Million) Forecast, by Application 2019 & 2032
- Table 17: Netherland RAM Blowout Preventer Market Revenue (Million) Forecast, by Application 2019 & 2032
- Table 18: Nordics RAM Blowout Preventer Market Revenue (Million) Forecast, by Application 2019 & 2032
- Table 19: Rest of Europe RAM Blowout Preventer Market Revenue (Million) Forecast, by Application 2019 & 2032
- Table 20: Global RAM Blowout Preventer Market Revenue Million Forecast, by Country 2019 & 2032
- Table 21: China RAM Blowout Preventer Market Revenue (Million) Forecast, by Application 2019 & 2032
- Table 22: Japan RAM Blowout Preventer Market Revenue (Million) Forecast, by Application 2019 & 2032
- Table 23: India RAM Blowout Preventer Market Revenue (Million) Forecast, by Application 2019 & 2032
- Table 24: South Korea RAM Blowout Preventer Market Revenue (Million) Forecast, by Application 2019 & 2032
- Table 25: Southeast Asia RAM Blowout Preventer Market Revenue (Million) Forecast, by Application 2019 & 2032
- Table 26: Australia RAM Blowout Preventer Market Revenue (Million) Forecast, by Application 2019 & 2032
- Table 27: Indonesia RAM Blowout Preventer Market Revenue (Million) Forecast, by Application 2019 & 2032
- Table 28: Phillipes RAM Blowout Preventer Market Revenue (Million) Forecast, by Application 2019 & 2032
- Table 29: Singapore RAM Blowout Preventer Market Revenue (Million) Forecast, by Application 2019 & 2032
- Table 30: Thailandc RAM Blowout Preventer Market Revenue (Million) Forecast, by Application 2019 & 2032
- Table 31: Rest of Asia Pacific RAM Blowout Preventer Market Revenue (Million) Forecast, by Application 2019 & 2032
- Table 32: Global RAM Blowout Preventer Market Revenue Million Forecast, by Country 2019 & 2032
- Table 33: Brazil RAM Blowout Preventer Market Revenue (Million) Forecast, by Application 2019 & 2032
- Table 34: Argentina RAM Blowout Preventer Market Revenue (Million) Forecast, by Application 2019 & 2032
- Table 35: Peru RAM Blowout Preventer Market Revenue (Million) Forecast, by Application 2019 & 2032
- Table 36: Chile RAM Blowout Preventer Market Revenue (Million) Forecast, by Application 2019 & 2032
- Table 37: Colombia RAM Blowout Preventer Market Revenue (Million) Forecast, by Application 2019 & 2032
- Table 38: Ecuador RAM Blowout Preventer Market Revenue (Million) Forecast, by Application 2019 & 2032
- Table 39: Venezuela RAM Blowout Preventer Market Revenue (Million) Forecast, by Application 2019 & 2032
- Table 40: Rest of South America RAM Blowout Preventer Market Revenue (Million) Forecast, by Application 2019 & 2032
- Table 41: Global RAM Blowout Preventer Market Revenue Million Forecast, by Country 2019 & 2032
- Table 42: United States RAM Blowout Preventer Market Revenue (Million) Forecast, by Application 2019 & 2032
- Table 43: Canada RAM Blowout Preventer Market Revenue (Million) Forecast, by Application 2019 & 2032
- Table 44: Mexico RAM Blowout Preventer Market Revenue (Million) Forecast, by Application 2019 & 2032
- Table 45: Global RAM Blowout Preventer Market Revenue Million Forecast, by Country 2019 & 2032
- Table 46: United Arab Emirates RAM Blowout Preventer Market Revenue (Million) Forecast, by Application 2019 & 2032
- Table 47: Saudi Arabia RAM Blowout Preventer Market Revenue (Million) Forecast, by Application 2019 & 2032
- Table 48: South Africa RAM Blowout Preventer Market Revenue (Million) Forecast, by Application 2019 & 2032
- Table 49: Rest of Middle East and Africa RAM Blowout Preventer Market Revenue (Million) Forecast, by Application 2019 & 2032
- Table 50: Global RAM Blowout Preventer Market Revenue Million Forecast, by Type 2019 & 2032
- Table 51: Global RAM Blowout Preventer Market Revenue Million Forecast, by Location of Deployment 2019 & 2032
- Table 52: Global RAM Blowout Preventer Market Revenue Million Forecast, by Country 2019 & 2032
- Table 53: Global RAM Blowout Preventer Market Revenue Million Forecast, by Type 2019 & 2032
- Table 54: Global RAM Blowout Preventer Market Revenue Million Forecast, by Location of Deployment 2019 & 2032
- Table 55: Global RAM Blowout Preventer Market Revenue Million Forecast, by Country 2019 & 2032
- Table 56: Global RAM Blowout Preventer Market Revenue Million Forecast, by Type 2019 & 2032
- Table 57: Global RAM Blowout Preventer Market Revenue Million Forecast, by Location of Deployment 2019 & 2032
- Table 58: Global RAM Blowout Preventer Market Revenue Million Forecast, by Country 2019 & 2032
- Table 59: Global RAM Blowout Preventer Market Revenue Million Forecast, by Type 2019 & 2032
- Table 60: Global RAM Blowout Preventer Market Revenue Million Forecast, by Location of Deployment 2019 & 2032
- Table 61: Global RAM Blowout Preventer Market Revenue Million Forecast, by Country 2019 & 2032
- Table 62: Global RAM Blowout Preventer Market Revenue Million Forecast, by Type 2019 & 2032
- Table 63: Global RAM Blowout Preventer Market Revenue Million Forecast, by Location of Deployment 2019 & 2032
- Table 64: Global RAM Blowout Preventer Market Revenue Million Forecast, by Country 2019 & 2032
Frequently Asked Questions
1. What is the projected Compound Annual Growth Rate (CAGR) of the RAM Blowout Preventer Market?
The projected CAGR is approximately > 2.00%.
2. Which companies are prominent players in the RAM Blowout Preventer Market?
Key companies in the market include Shandong Kerui Holding Group Co Ltd, National Oilwell Varco Inc, TechnipFMC Plc, Weatherford International Plc *List Not Exhaustive, Rongsheng Machinery Manufacture Ltd, Baker Hughes Company, Halliburton Company, Schlumberger Company.
3. What are the main segments of the RAM Blowout Preventer Market?
The market segments include Type, Location of Deployment.
4. Can you provide details about the market size?
The market size is estimated to be USD XX Million as of 2022.
5. What are some drivers contributing to market growth?
4.; Growing demand for natural gas and developing gas infrastructure4.; Increasing offshore oil and Gas Exploration Activities.
6. What are the notable trends driving market growth?
Offshore Segment to Dominate the Market.
7. Are there any restraints impacting market growth?
4.; Adoption of Cleaner Alternatives.
8. Can you provide examples of recent developments in the market?
N/A
9. What pricing options are available for accessing the report?
Pricing options include single-user, multi-user, and enterprise licenses priced at USD 4750, USD 5250, and USD 8750 respectively.
10. Is the market size provided in terms of value or volume?
The market size is provided in terms of value, measured in Million.
11. Are there any specific market keywords associated with the report?
Yes, the market keyword associated with the report is "RAM Blowout Preventer Market," which aids in identifying and referencing the specific market segment covered.
12. How do I determine which pricing option suits my needs best?
The pricing options vary based on user requirements and access needs. Individual users may opt for single-user licenses, while businesses requiring broader access may choose multi-user or enterprise licenses for cost-effective access to the report.
13. Are there any additional resources or data provided in the RAM Blowout Preventer Market report?
While the report offers comprehensive insights, it's advisable to review the specific contents or supplementary materials provided to ascertain if additional resources or data are available.
14. How can I stay updated on further developments or reports in the RAM Blowout Preventer Market?
To stay informed about further developments, trends, and reports in the RAM Blowout Preventer Market, consider subscribing to industry newsletters, following relevant companies and organizations, or regularly checking reputable industry news sources and publications.
Methodology
Step 1 - Identification of Relevant Samples Size from Population Database


Step 2 - Approaches for Defining Global Market Size (Value, Volume* & Price*)

Note*: In applicable scenarios
Step 3 - Data Sources
Primary Research
- Web Analytics
- Survey Reports
- Research Institute
- Latest Research Reports
- Opinion Leaders
Secondary Research
- Annual Reports
- White Paper
- Latest Press Release
- Industry Association
- Paid Database
- Investor Presentations

Step 4 - Data Triangulation
Involves using different sources of information in order to increase the validity of a study
These sources are likely to be stakeholders in a program - participants, other researchers, program staff, other community members, and so on.
Then we put all data in single framework & apply various statistical tools to find out the dynamic on the market.
During the analysis stage, feedback from the stakeholder groups would be compared to determine areas of agreement as well as areas of divergence


