
Key Insights
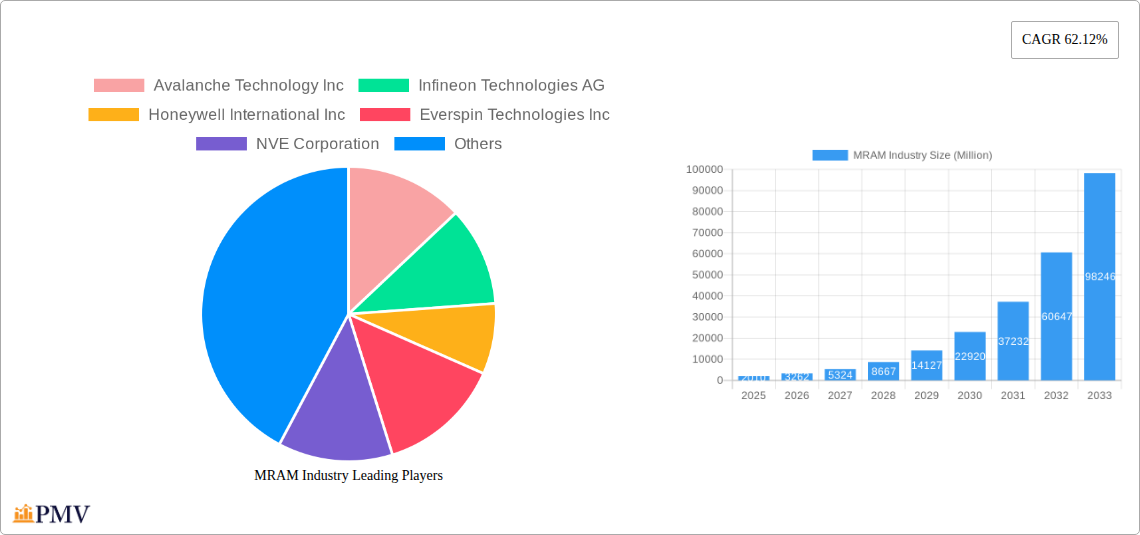
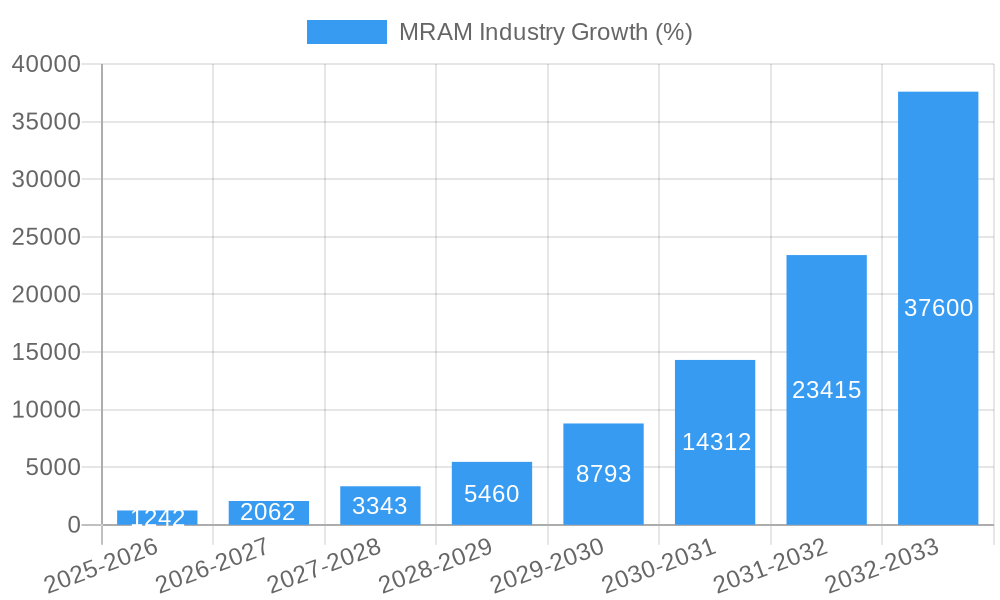
The MRAM (Magnetoresistive Random Access Memory) market is experiencing explosive growth, projected to reach \$2.01 billion in 2025 and exhibiting a remarkable Compound Annual Growth Rate (CAGR) of 62.12%. This surge is driven by several key factors. The increasing demand for high-speed, low-power, and non-volatile memory solutions across diverse applications is a primary driver. Specifically, the automotive, consumer electronics, and enterprise storage sectors are fueling this growth, demanding improved performance and reliability in their devices. Technological advancements in Toggle MRAM and Spin-transfer Torque MRAM are further contributing to market expansion. The availability of both stand-alone and embedded MRAM solutions caters to a broader range of applications and system architectures, widening the market's appeal. Furthermore, the growing adoption of artificial intelligence and machine learning, requiring robust and energy-efficient memory solutions, is bolstering market demand. Leading companies like Infineon, Samsung, and Intel are heavily investing in R&D and production, contributing significantly to market maturity and widespread adoption.
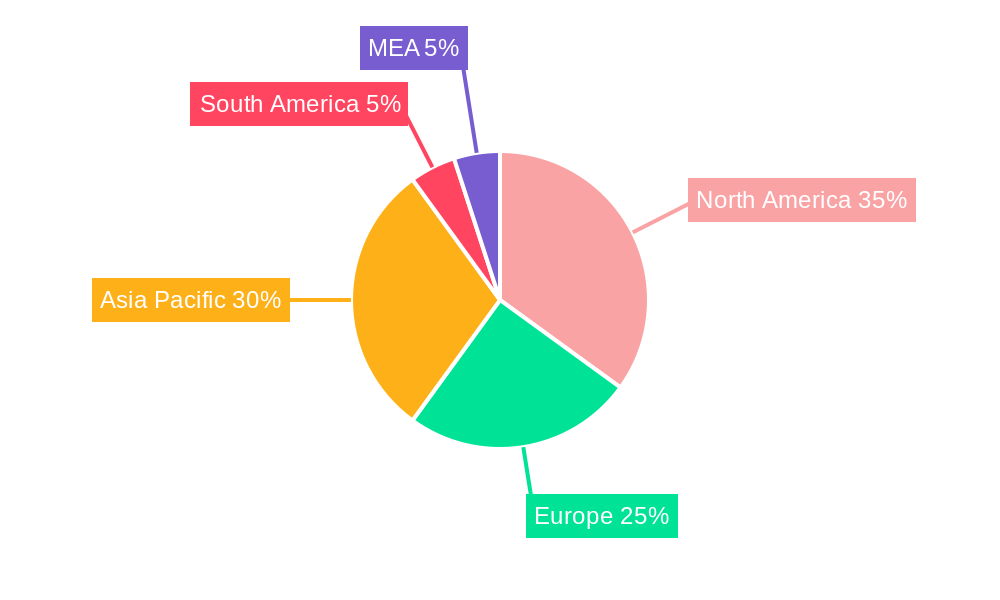
However, certain restraints are anticipated. High manufacturing costs associated with advanced MRAM technologies, along with potential supply chain constraints, could temporarily hinder growth. Nevertheless, the long-term outlook remains overwhelmingly positive. As MRAM technology matures and production scales, costs are likely to decrease, driving further market penetration. The ongoing miniaturization of electronic devices and the ever-increasing demand for data storage and processing capacity will continue to present significant opportunities for MRAM adoption across all targeted segments. The regional distribution reflects this global demand, with North America and Asia-Pacific currently leading the market.
MRAM Industry Market Report: 2019-2033
This comprehensive report provides an in-depth analysis of the Magnetoresistive Random Access Memory (MRAM) industry, covering market size, growth projections, competitive landscape, and key technological advancements from 2019 to 2033. With a base year of 2025 and a forecast period of 2025-2033, this report is an essential resource for industry professionals, investors, and researchers seeking actionable insights into this rapidly evolving sector. The study period covers 2019-2024 (historical period) and projects to 2033. The estimated market value in 2025 is xx Million.
MRAM Industry Market Structure & Competitive Dynamics
The MRAM market is characterized by a dynamic interplay of established players and emerging innovators. Market concentration is moderate, with several key players holding significant market share, but a fragmented landscape of smaller companies driving innovation. The industry benefits from a supportive regulatory environment, primarily driven by government initiatives promoting semiconductor advancement. However, competition from alternative memory technologies such as NAND flash and SRAM presents ongoing challenges. M&A activity has been relatively consistent, with deal values fluctuating according to market conditions.
- Market Concentration: Moderate, with the top 5 players holding an estimated xx% market share in 2025.
- Innovation Ecosystems: Strong collaboration between research institutions, technology providers, and end-users fuels continuous advancements.
- Regulatory Frameworks: Generally supportive of technological innovation in the semiconductor sector.
- Product Substitutes: NAND flash, SRAM, and emerging technologies such as ReRAM pose competitive threats.
- End-User Trends: Increasing demand from diverse sectors, including automotive, consumer electronics, and data centers, drives market expansion.
- M&A Activity: Significant M&A activity, with estimated total deal values exceeding xx Million in the period 2019-2024. This includes strategic acquisitions to expand product portfolios and consolidate market share.
MRAM Industry Trends & Insights
The MRAM industry is experiencing robust growth, fueled by several key factors. The increasing demand for high-performance, low-power memory solutions across diverse applications is a major driver. Technological advancements, particularly in STT-MRAM and SOT-MRAM technologies, are enhancing MRAM's capabilities, improving speed, density, and endurance. Consumer preferences for faster and more energy-efficient devices are significantly impacting market dynamics. The competitive landscape is characterized by intense innovation and strategic partnerships, further accelerating market expansion. The Compound Annual Growth Rate (CAGR) for the MRAM market during the forecast period (2025-2033) is projected to be xx%, and market penetration is expected to reach xx% by 2033.
Dominant Markets & Segments in MRAM Industry
The automotive sector is currently the leading application segment for MRAM, driven by the increasing need for high-performance memory in advanced driver-assistance systems (ADAS) and autonomous vehicles. Within MRAM types, Spin-transfer Torque MRAM (STT-MRAM) holds the largest market share due to its maturity and widespread adoption. Embedded MRAM offerings dominate the market due to their integration into various systems.
- Leading Region: North America and Asia-Pacific are currently leading in MRAM adoption and manufacturing.
- Key Drivers (Automotive Segment):
- Increasing adoption of ADAS and autonomous driving features.
- Stringent automotive safety regulations.
- Growing demand for high-performance in-vehicle infotainment systems.
- Dominant MRAM Type: STT-MRAM due to higher maturity and cost-effectiveness.
- Dominant Offering: Embedded MRAM, owing to its ease of integration into various systems.
- Regional Dominance Analysis: North America's dominance stems from strong R&D and manufacturing capabilities, while Asia-Pacific leads in production and consumer electronics applications.
MRAM Industry Product Innovations
Recent advancements in MRAM technology focus on enhancing density, reducing power consumption, and improving write speeds. STT-MRAM continues to be the dominant technology, but SOT-MRAM is gaining traction with its potential for higher integration density and faster write speeds. Innovations in manufacturing processes are leading to cost reductions and increased production volumes, making MRAM more competitive. The market fit for MRAM is continuously expanding, driven by the increasing need for non-volatile memory in various applications demanding high performance and low power consumption.
Report Segmentation & Scope
This report segments the MRAM market based on several key parameters:
Type: Toggle MRAM, Spin-transfer Torque MRAM (STT-MRAM), Spin-orbit Torque MRAM (SOT-MRAM). STT-MRAM is currently the largest segment, while SOT-MRAM is expected to exhibit the highest growth rate during the forecast period.
Offering: Stand-alone and Embedded. The embedded segment holds a larger market share due to its integration in various systems.
Application: Consumer Electronics, Robotics, Enterprise Storage, Automotive, Aerospace and Defense, and Other Applications. Automotive and consumer electronics are the dominant application segments.
Each segment's growth projections, market size, and competitive dynamics are comprehensively analyzed in the report.
Key Drivers of MRAM Industry Growth
The growth of the MRAM industry is driven by several factors:
- Technological Advancements: Continuous improvements in STT-MRAM and emerging SOT-MRAM technologies are enhancing performance and reducing costs.
- Increased Demand: The rising demand for high-speed, low-power memory solutions across multiple sectors is pushing market expansion.
- Government Support: Government initiatives promoting semiconductor development provide a favorable regulatory environment.
- Strategic Partnerships: Collaborations between technology providers and end-users accelerate innovation and market penetration.
Challenges in the MRAM Industry Sector
Despite its growth potential, the MRAM industry faces several challenges:
- High Manufacturing Costs: Compared to other memory technologies, MRAM production remains relatively expensive, limiting its wider adoption.
- Supply Chain Disruptions: Global supply chain vulnerabilities can impact production and availability of MRAM devices.
- Competition from Alternative Technologies: The competitive pressure from established technologies such as NAND flash and SRAM remains substantial.
Leading Players in the MRAM Industry Market
- Avalanche Technology Inc
- Infineon Technologies AG
- Honeywell International Inc
- Everspin Technologies Inc
- NVE Corporation
- Samsung Electronics Co Ltd
- Tower Semiconductor
- Qualcomm Incorporated
- HFC Semiconductor Corporation
- Spin Transfer Technologies
- Crocus Nano Electronics LLC
- Numem
- Intel Corporation
Key Developments in MRAM Industry Sector
September 2022: Avalanche Technology Inc. and United Microelectronics Corporation (UMC) launched high-reliability Persistent SRAM (P-SRAM) memory devices based on STT-MRAM technology, enhancing density, reliability, endurance, and power efficiency.
July 2021: Researchers at IIT Delhi and the National University of Singapore achieved higher integration density in SOT-MRAMs, demonstrating advancements in reliability and writing speed compared to STT-MRAM.
Strategic MRAM Industry Market Outlook
The future of the MRAM industry is bright, with significant growth potential driven by continuous technological advancements, expanding applications, and increasing demand. Strategic opportunities exist for companies focusing on developing next-generation SOT-MRAM technologies, expanding into new application areas (such as AI and edge computing), and establishing robust supply chains. The market is poised for considerable expansion, fueled by innovations in materials science, device architecture, and manufacturing processes. The strategic focus should be on enhancing cost-effectiveness and improving performance to capture a larger market share.
MRAM Industry Segmentation
-
1. Type
- 1.1. Toggle MRAM
- 1.2. Spin-transfer Torque MRAM
-
2. Offering
- 2.1. Stand-alone
- 2.2. Embedded
-
3. Application
- 3.1. Consumer Electronics
- 3.2. Robotics
- 3.3. Enterprise Storage
- 3.4. Automotive
- 3.5. Aerospace and Defense
- 3.6. Other Applications
MRAM Industry Segmentation By Geography
- 1. North America
- 2. Europe
- 3. Asia Pacific
- 4. Latin America
- 5. Middle East and Africa
MRAM Industry REPORT HIGHLIGHTS
| Aspects | Details |
|---|---|
| Study Period | 2019-2033 |
| Base Year | 2024 |
| Estimated Year | 2025 |
| Forecast Period | 2025-2033 |
| Historical Period | 2019-2024 |
| Growth Rate | CAGR of 62.12% from 2019-2033 |
| Segmentation |
|
Table of Contents
- 1. Introduction
- 1.1. Research Scope
- 1.2. Market Segmentation
- 1.3. Research Methodology
- 1.4. Definitions and Assumptions
- 2. Executive Summary
- 2.1. Introduction
- 3. Market Dynamics
- 3.1. Introduction
- 3.2. Market Drivers
- 3.2.1. Increasing Demand for Miniaturization of Electronic Devices; Increased Use of MRAM in RFID Tags
- 3.3. Market Restrains
- 3.3.1. Increasing Preference for Live Person Interaction
- 3.4. Market Trends
- 3.4.1. Consumer Electronics May Experience Significant Growth
- 4. Market Factor Analysis
- 4.1. Porters Five Forces
- 4.2. Supply/Value Chain
- 4.3. PESTEL analysis
- 4.4. Market Entropy
- 4.5. Patent/Trademark Analysis
- 5. Global MRAM Industry Analysis, Insights and Forecast, 2019-2031
- 5.1. Market Analysis, Insights and Forecast - by Type
- 5.1.1. Toggle MRAM
- 5.1.2. Spin-transfer Torque MRAM
- 5.2. Market Analysis, Insights and Forecast - by Offering
- 5.2.1. Stand-alone
- 5.2.2. Embedded
- 5.3. Market Analysis, Insights and Forecast - by Application
- 5.3.1. Consumer Electronics
- 5.3.2. Robotics
- 5.3.3. Enterprise Storage
- 5.3.4. Automotive
- 5.3.5. Aerospace and Defense
- 5.3.6. Other Applications
- 5.4. Market Analysis, Insights and Forecast - by Region
- 5.4.1. North America
- 5.4.2. Europe
- 5.4.3. Asia Pacific
- 5.4.4. Latin America
- 5.4.5. Middle East and Africa
- 5.1. Market Analysis, Insights and Forecast - by Type
- 6. North America MRAM Industry Analysis, Insights and Forecast, 2019-2031
- 6.1. Market Analysis, Insights and Forecast - by Type
- 6.1.1. Toggle MRAM
- 6.1.2. Spin-transfer Torque MRAM
- 6.2. Market Analysis, Insights and Forecast - by Offering
- 6.2.1. Stand-alone
- 6.2.2. Embedded
- 6.3. Market Analysis, Insights and Forecast - by Application
- 6.3.1. Consumer Electronics
- 6.3.2. Robotics
- 6.3.3. Enterprise Storage
- 6.3.4. Automotive
- 6.3.5. Aerospace and Defense
- 6.3.6. Other Applications
- 6.1. Market Analysis, Insights and Forecast - by Type
- 7. Europe MRAM Industry Analysis, Insights and Forecast, 2019-2031
- 7.1. Market Analysis, Insights and Forecast - by Type
- 7.1.1. Toggle MRAM
- 7.1.2. Spin-transfer Torque MRAM
- 7.2. Market Analysis, Insights and Forecast - by Offering
- 7.2.1. Stand-alone
- 7.2.2. Embedded
- 7.3. Market Analysis, Insights and Forecast - by Application
- 7.3.1. Consumer Electronics
- 7.3.2. Robotics
- 7.3.3. Enterprise Storage
- 7.3.4. Automotive
- 7.3.5. Aerospace and Defense
- 7.3.6. Other Applications
- 7.1. Market Analysis, Insights and Forecast - by Type
- 8. Asia Pacific MRAM Industry Analysis, Insights and Forecast, 2019-2031
- 8.1. Market Analysis, Insights and Forecast - by Type
- 8.1.1. Toggle MRAM
- 8.1.2. Spin-transfer Torque MRAM
- 8.2. Market Analysis, Insights and Forecast - by Offering
- 8.2.1. Stand-alone
- 8.2.2. Embedded
- 8.3. Market Analysis, Insights and Forecast - by Application
- 8.3.1. Consumer Electronics
- 8.3.2. Robotics
- 8.3.3. Enterprise Storage
- 8.3.4. Automotive
- 8.3.5. Aerospace and Defense
- 8.3.6. Other Applications
- 8.1. Market Analysis, Insights and Forecast - by Type
- 9. Latin America MRAM Industry Analysis, Insights and Forecast, 2019-2031
- 9.1. Market Analysis, Insights and Forecast - by Type
- 9.1.1. Toggle MRAM
- 9.1.2. Spin-transfer Torque MRAM
- 9.2. Market Analysis, Insights and Forecast - by Offering
- 9.2.1. Stand-alone
- 9.2.2. Embedded
- 9.3. Market Analysis, Insights and Forecast - by Application
- 9.3.1. Consumer Electronics
- 9.3.2. Robotics
- 9.3.3. Enterprise Storage
- 9.3.4. Automotive
- 9.3.5. Aerospace and Defense
- 9.3.6. Other Applications
- 9.1. Market Analysis, Insights and Forecast - by Type
- 10. Middle East and Africa MRAM Industry Analysis, Insights and Forecast, 2019-2031
- 10.1. Market Analysis, Insights and Forecast - by Type
- 10.1.1. Toggle MRAM
- 10.1.2. Spin-transfer Torque MRAM
- 10.2. Market Analysis, Insights and Forecast - by Offering
- 10.2.1. Stand-alone
- 10.2.2. Embedded
- 10.3. Market Analysis, Insights and Forecast - by Application
- 10.3.1. Consumer Electronics
- 10.3.2. Robotics
- 10.3.3. Enterprise Storage
- 10.3.4. Automotive
- 10.3.5. Aerospace and Defense
- 10.3.6. Other Applications
- 10.1. Market Analysis, Insights and Forecast - by Type
- 11. North America MRAM Industry Analysis, Insights and Forecast, 2019-2031
- 11.1. Market Analysis, Insights and Forecast - By Country/Sub-region
- 11.1.1 United States
- 11.1.2 Canada
- 11.1.3 Mexico
- 12. Europe MRAM Industry Analysis, Insights and Forecast, 2019-2031
- 12.1. Market Analysis, Insights and Forecast - By Country/Sub-region
- 12.1.1 Germany
- 12.1.2 United Kingdom
- 12.1.3 France
- 12.1.4 Spain
- 12.1.5 Italy
- 12.1.6 Spain
- 12.1.7 Belgium
- 12.1.8 Netherland
- 12.1.9 Nordics
- 12.1.10 Rest of Europe
- 13. Asia Pacific MRAM Industry Analysis, Insights and Forecast, 2019-2031
- 13.1. Market Analysis, Insights and Forecast - By Country/Sub-region
- 13.1.1 China
- 13.1.2 Japan
- 13.1.3 India
- 13.1.4 South Korea
- 13.1.5 Southeast Asia
- 13.1.6 Australia
- 13.1.7 Indonesia
- 13.1.8 Phillipes
- 13.1.9 Singapore
- 13.1.10 Thailandc
- 13.1.11 Rest of Asia Pacific
- 14. South America MRAM Industry Analysis, Insights and Forecast, 2019-2031
- 14.1. Market Analysis, Insights and Forecast - By Country/Sub-region
- 14.1.1 Brazil
- 14.1.2 Argentina
- 14.1.3 Peru
- 14.1.4 Chile
- 14.1.5 Colombia
- 14.1.6 Ecuador
- 14.1.7 Venezuela
- 14.1.8 Rest of South America
- 15. North America MRAM Industry Analysis, Insights and Forecast, 2019-2031
- 15.1. Market Analysis, Insights and Forecast - By Country/Sub-region
- 15.1.1 United States
- 15.1.2 Canada
- 15.1.3 Mexico
- 16. MEA MRAM Industry Analysis, Insights and Forecast, 2019-2031
- 16.1. Market Analysis, Insights and Forecast - By Country/Sub-region
- 16.1.1 United Arab Emirates
- 16.1.2 Saudi Arabia
- 16.1.3 South Africa
- 16.1.4 Rest of Middle East and Africa
- 17. Competitive Analysis
- 17.1. Global Market Share Analysis 2024
- 17.2. Company Profiles
- 17.2.1 Avalanche Technology Inc
- 17.2.1.1. Overview
- 17.2.1.2. Products
- 17.2.1.3. SWOT Analysis
- 17.2.1.4. Recent Developments
- 17.2.1.5. Financials (Based on Availability)
- 17.2.2 Infineon Technologies AG
- 17.2.2.1. Overview
- 17.2.2.2. Products
- 17.2.2.3. SWOT Analysis
- 17.2.2.4. Recent Developments
- 17.2.2.5. Financials (Based on Availability)
- 17.2.3 Honeywell International Inc
- 17.2.3.1. Overview
- 17.2.3.2. Products
- 17.2.3.3. SWOT Analysis
- 17.2.3.4. Recent Developments
- 17.2.3.5. Financials (Based on Availability)
- 17.2.4 Everspin Technologies Inc
- 17.2.4.1. Overview
- 17.2.4.2. Products
- 17.2.4.3. SWOT Analysis
- 17.2.4.4. Recent Developments
- 17.2.4.5. Financials (Based on Availability)
- 17.2.5 NVE Corporation
- 17.2.5.1. Overview
- 17.2.5.2. Products
- 17.2.5.3. SWOT Analysis
- 17.2.5.4. Recent Developments
- 17.2.5.5. Financials (Based on Availability)
- 17.2.6 Samsung Electronics Co Ltd
- 17.2.6.1. Overview
- 17.2.6.2. Products
- 17.2.6.3. SWOT Analysis
- 17.2.6.4. Recent Developments
- 17.2.6.5. Financials (Based on Availability)
- 17.2.7 Tower Semiconductor
- 17.2.7.1. Overview
- 17.2.7.2. Products
- 17.2.7.3. SWOT Analysis
- 17.2.7.4. Recent Developments
- 17.2.7.5. Financials (Based on Availability)
- 17.2.8 Qualcomm Incorporated
- 17.2.8.1. Overview
- 17.2.8.2. Products
- 17.2.8.3. SWOT Analysis
- 17.2.8.4. Recent Developments
- 17.2.8.5. Financials (Based on Availability)
- 17.2.9 HFC Semiconductor Corporation
- 17.2.9.1. Overview
- 17.2.9.2. Products
- 17.2.9.3. SWOT Analysis
- 17.2.9.4. Recent Developments
- 17.2.9.5. Financials (Based on Availability)
- 17.2.10 Spin Transfer Technologies
- 17.2.10.1. Overview
- 17.2.10.2. Products
- 17.2.10.3. SWOT Analysis
- 17.2.10.4. Recent Developments
- 17.2.10.5. Financials (Based on Availability)
- 17.2.11 Crocus Nano Electronics LLC
- 17.2.11.1. Overview
- 17.2.11.2. Products
- 17.2.11.3. SWOT Analysis
- 17.2.11.4. Recent Developments
- 17.2.11.5. Financials (Based on Availability)
- 17.2.12 Numem
- 17.2.12.1. Overview
- 17.2.12.2. Products
- 17.2.12.3. SWOT Analysis
- 17.2.12.4. Recent Developments
- 17.2.12.5. Financials (Based on Availability)
- 17.2.13 Intel Corporation
- 17.2.13.1. Overview
- 17.2.13.2. Products
- 17.2.13.3. SWOT Analysis
- 17.2.13.4. Recent Developments
- 17.2.13.5. Financials (Based on Availability)
- 17.2.1 Avalanche Technology Inc
List of Figures
- Figure 1: Global MRAM Industry Revenue Breakdown (Million, %) by Region 2024 & 2032
- Figure 2: Global MRAM Industry Volume Breakdown (K Unit, %) by Region 2024 & 2032
- Figure 3: North America MRAM Industry Revenue (Million), by Country 2024 & 2032
- Figure 4: North America MRAM Industry Volume (K Unit), by Country 2024 & 2032
- Figure 5: North America MRAM Industry Revenue Share (%), by Country 2024 & 2032
- Figure 6: North America MRAM Industry Volume Share (%), by Country 2024 & 2032
- Figure 7: Europe MRAM Industry Revenue (Million), by Country 2024 & 2032
- Figure 8: Europe MRAM Industry Volume (K Unit), by Country 2024 & 2032
- Figure 9: Europe MRAM Industry Revenue Share (%), by Country 2024 & 2032
- Figure 10: Europe MRAM Industry Volume Share (%), by Country 2024 & 2032
- Figure 11: Asia Pacific MRAM Industry Revenue (Million), by Country 2024 & 2032
- Figure 12: Asia Pacific MRAM Industry Volume (K Unit), by Country 2024 & 2032
- Figure 13: Asia Pacific MRAM Industry Revenue Share (%), by Country 2024 & 2032
- Figure 14: Asia Pacific MRAM Industry Volume Share (%), by Country 2024 & 2032
- Figure 15: South America MRAM Industry Revenue (Million), by Country 2024 & 2032
- Figure 16: South America MRAM Industry Volume (K Unit), by Country 2024 & 2032
- Figure 17: South America MRAM Industry Revenue Share (%), by Country 2024 & 2032
- Figure 18: South America MRAM Industry Volume Share (%), by Country 2024 & 2032
- Figure 19: North America MRAM Industry Revenue (Million), by Country 2024 & 2032
- Figure 20: North America MRAM Industry Volume (K Unit), by Country 2024 & 2032
- Figure 21: North America MRAM Industry Revenue Share (%), by Country 2024 & 2032
- Figure 22: North America MRAM Industry Volume Share (%), by Country 2024 & 2032
- Figure 23: MEA MRAM Industry Revenue (Million), by Country 2024 & 2032
- Figure 24: MEA MRAM Industry Volume (K Unit), by Country 2024 & 2032
- Figure 25: MEA MRAM Industry Revenue Share (%), by Country 2024 & 2032
- Figure 26: MEA MRAM Industry Volume Share (%), by Country 2024 & 2032
- Figure 27: North America MRAM Industry Revenue (Million), by Type 2024 & 2032
- Figure 28: North America MRAM Industry Volume (K Unit), by Type 2024 & 2032
- Figure 29: North America MRAM Industry Revenue Share (%), by Type 2024 & 2032
- Figure 30: North America MRAM Industry Volume Share (%), by Type 2024 & 2032
- Figure 31: North America MRAM Industry Revenue (Million), by Offering 2024 & 2032
- Figure 32: North America MRAM Industry Volume (K Unit), by Offering 2024 & 2032
- Figure 33: North America MRAM Industry Revenue Share (%), by Offering 2024 & 2032
- Figure 34: North America MRAM Industry Volume Share (%), by Offering 2024 & 2032
- Figure 35: North America MRAM Industry Revenue (Million), by Application 2024 & 2032
- Figure 36: North America MRAM Industry Volume (K Unit), by Application 2024 & 2032
- Figure 37: North America MRAM Industry Revenue Share (%), by Application 2024 & 2032
- Figure 38: North America MRAM Industry Volume Share (%), by Application 2024 & 2032
- Figure 39: North America MRAM Industry Revenue (Million), by Country 2024 & 2032
- Figure 40: North America MRAM Industry Volume (K Unit), by Country 2024 & 2032
- Figure 41: North America MRAM Industry Revenue Share (%), by Country 2024 & 2032
- Figure 42: North America MRAM Industry Volume Share (%), by Country 2024 & 2032
- Figure 43: Europe MRAM Industry Revenue (Million), by Type 2024 & 2032
- Figure 44: Europe MRAM Industry Volume (K Unit), by Type 2024 & 2032
- Figure 45: Europe MRAM Industry Revenue Share (%), by Type 2024 & 2032
- Figure 46: Europe MRAM Industry Volume Share (%), by Type 2024 & 2032
- Figure 47: Europe MRAM Industry Revenue (Million), by Offering 2024 & 2032
- Figure 48: Europe MRAM Industry Volume (K Unit), by Offering 2024 & 2032
- Figure 49: Europe MRAM Industry Revenue Share (%), by Offering 2024 & 2032
- Figure 50: Europe MRAM Industry Volume Share (%), by Offering 2024 & 2032
- Figure 51: Europe MRAM Industry Revenue (Million), by Application 2024 & 2032
- Figure 52: Europe MRAM Industry Volume (K Unit), by Application 2024 & 2032
- Figure 53: Europe MRAM Industry Revenue Share (%), by Application 2024 & 2032
- Figure 54: Europe MRAM Industry Volume Share (%), by Application 2024 & 2032
- Figure 55: Europe MRAM Industry Revenue (Million), by Country 2024 & 2032
- Figure 56: Europe MRAM Industry Volume (K Unit), by Country 2024 & 2032
- Figure 57: Europe MRAM Industry Revenue Share (%), by Country 2024 & 2032
- Figure 58: Europe MRAM Industry Volume Share (%), by Country 2024 & 2032
- Figure 59: Asia Pacific MRAM Industry Revenue (Million), by Type 2024 & 2032
- Figure 60: Asia Pacific MRAM Industry Volume (K Unit), by Type 2024 & 2032
- Figure 61: Asia Pacific MRAM Industry Revenue Share (%), by Type 2024 & 2032
- Figure 62: Asia Pacific MRAM Industry Volume Share (%), by Type 2024 & 2032
- Figure 63: Asia Pacific MRAM Industry Revenue (Million), by Offering 2024 & 2032
- Figure 64: Asia Pacific MRAM Industry Volume (K Unit), by Offering 2024 & 2032
- Figure 65: Asia Pacific MRAM Industry Revenue Share (%), by Offering 2024 & 2032
- Figure 66: Asia Pacific MRAM Industry Volume Share (%), by Offering 2024 & 2032
- Figure 67: Asia Pacific MRAM Industry Revenue (Million), by Application 2024 & 2032
- Figure 68: Asia Pacific MRAM Industry Volume (K Unit), by Application 2024 & 2032
- Figure 69: Asia Pacific MRAM Industry Revenue Share (%), by Application 2024 & 2032
- Figure 70: Asia Pacific MRAM Industry Volume Share (%), by Application 2024 & 2032
- Figure 71: Asia Pacific MRAM Industry Revenue (Million), by Country 2024 & 2032
- Figure 72: Asia Pacific MRAM Industry Volume (K Unit), by Country 2024 & 2032
- Figure 73: Asia Pacific MRAM Industry Revenue Share (%), by Country 2024 & 2032
- Figure 74: Asia Pacific MRAM Industry Volume Share (%), by Country 2024 & 2032
- Figure 75: Latin America MRAM Industry Revenue (Million), by Type 2024 & 2032
- Figure 76: Latin America MRAM Industry Volume (K Unit), by Type 2024 & 2032
- Figure 77: Latin America MRAM Industry Revenue Share (%), by Type 2024 & 2032
- Figure 78: Latin America MRAM Industry Volume Share (%), by Type 2024 & 2032
- Figure 79: Latin America MRAM Industry Revenue (Million), by Offering 2024 & 2032
- Figure 80: Latin America MRAM Industry Volume (K Unit), by Offering 2024 & 2032
- Figure 81: Latin America MRAM Industry Revenue Share (%), by Offering 2024 & 2032
- Figure 82: Latin America MRAM Industry Volume Share (%), by Offering 2024 & 2032
- Figure 83: Latin America MRAM Industry Revenue (Million), by Application 2024 & 2032
- Figure 84: Latin America MRAM Industry Volume (K Unit), by Application 2024 & 2032
- Figure 85: Latin America MRAM Industry Revenue Share (%), by Application 2024 & 2032
- Figure 86: Latin America MRAM Industry Volume Share (%), by Application 2024 & 2032
- Figure 87: Latin America MRAM Industry Revenue (Million), by Country 2024 & 2032
- Figure 88: Latin America MRAM Industry Volume (K Unit), by Country 2024 & 2032
- Figure 89: Latin America MRAM Industry Revenue Share (%), by Country 2024 & 2032
- Figure 90: Latin America MRAM Industry Volume Share (%), by Country 2024 & 2032
- Figure 91: Middle East and Africa MRAM Industry Revenue (Million), by Type 2024 & 2032
- Figure 92: Middle East and Africa MRAM Industry Volume (K Unit), by Type 2024 & 2032
- Figure 93: Middle East and Africa MRAM Industry Revenue Share (%), by Type 2024 & 2032
- Figure 94: Middle East and Africa MRAM Industry Volume Share (%), by Type 2024 & 2032
- Figure 95: Middle East and Africa MRAM Industry Revenue (Million), by Offering 2024 & 2032
- Figure 96: Middle East and Africa MRAM Industry Volume (K Unit), by Offering 2024 & 2032
- Figure 97: Middle East and Africa MRAM Industry Revenue Share (%), by Offering 2024 & 2032
- Figure 98: Middle East and Africa MRAM Industry Volume Share (%), by Offering 2024 & 2032
- Figure 99: Middle East and Africa MRAM Industry Revenue (Million), by Application 2024 & 2032
- Figure 100: Middle East and Africa MRAM Industry Volume (K Unit), by Application 2024 & 2032
- Figure 101: Middle East and Africa MRAM Industry Revenue Share (%), by Application 2024 & 2032
- Figure 102: Middle East and Africa MRAM Industry Volume Share (%), by Application 2024 & 2032
- Figure 103: Middle East and Africa MRAM Industry Revenue (Million), by Country 2024 & 2032
- Figure 104: Middle East and Africa MRAM Industry Volume (K Unit), by Country 2024 & 2032
- Figure 105: Middle East and Africa MRAM Industry Revenue Share (%), by Country 2024 & 2032
- Figure 106: Middle East and Africa MRAM Industry Volume Share (%), by Country 2024 & 2032
List of Tables
- Table 1: Global MRAM Industry Revenue Million Forecast, by Region 2019 & 2032
- Table 2: Global MRAM Industry Volume K Unit Forecast, by Region 2019 & 2032
- Table 3: Global MRAM Industry Revenue Million Forecast, by Type 2019 & 2032
- Table 4: Global MRAM Industry Volume K Unit Forecast, by Type 2019 & 2032
- Table 5: Global MRAM Industry Revenue Million Forecast, by Offering 2019 & 2032
- Table 6: Global MRAM Industry Volume K Unit Forecast, by Offering 2019 & 2032
- Table 7: Global MRAM Industry Revenue Million Forecast, by Application 2019 & 2032
- Table 8: Global MRAM Industry Volume K Unit Forecast, by Application 2019 & 2032
- Table 9: Global MRAM Industry Revenue Million Forecast, by Region 2019 & 2032
- Table 10: Global MRAM Industry Volume K Unit Forecast, by Region 2019 & 2032
- Table 11: Global MRAM Industry Revenue Million Forecast, by Country 2019 & 2032
- Table 12: Global MRAM Industry Volume K Unit Forecast, by Country 2019 & 2032
- Table 13: United States MRAM Industry Revenue (Million) Forecast, by Application 2019 & 2032
- Table 14: United States MRAM Industry Volume (K Unit) Forecast, by Application 2019 & 2032
- Table 15: Canada MRAM Industry Revenue (Million) Forecast, by Application 2019 & 2032
- Table 16: Canada MRAM Industry Volume (K Unit) Forecast, by Application 2019 & 2032
- Table 17: Mexico MRAM Industry Revenue (Million) Forecast, by Application 2019 & 2032
- Table 18: Mexico MRAM Industry Volume (K Unit) Forecast, by Application 2019 & 2032
- Table 19: Global MRAM Industry Revenue Million Forecast, by Country 2019 & 2032
- Table 20: Global MRAM Industry Volume K Unit Forecast, by Country 2019 & 2032
- Table 21: Germany MRAM Industry Revenue (Million) Forecast, by Application 2019 & 2032
- Table 22: Germany MRAM Industry Volume (K Unit) Forecast, by Application 2019 & 2032
- Table 23: United Kingdom MRAM Industry Revenue (Million) Forecast, by Application 2019 & 2032
- Table 24: United Kingdom MRAM Industry Volume (K Unit) Forecast, by Application 2019 & 2032
- Table 25: France MRAM Industry Revenue (Million) Forecast, by Application 2019 & 2032
- Table 26: France MRAM Industry Volume (K Unit) Forecast, by Application 2019 & 2032
- Table 27: Spain MRAM Industry Revenue (Million) Forecast, by Application 2019 & 2032
- Table 28: Spain MRAM Industry Volume (K Unit) Forecast, by Application 2019 & 2032
- Table 29: Italy MRAM Industry Revenue (Million) Forecast, by Application 2019 & 2032
- Table 30: Italy MRAM Industry Volume (K Unit) Forecast, by Application 2019 & 2032
- Table 31: Spain MRAM Industry Revenue (Million) Forecast, by Application 2019 & 2032
- Table 32: Spain MRAM Industry Volume (K Unit) Forecast, by Application 2019 & 2032
- Table 33: Belgium MRAM Industry Revenue (Million) Forecast, by Application 2019 & 2032
- Table 34: Belgium MRAM Industry Volume (K Unit) Forecast, by Application 2019 & 2032
- Table 35: Netherland MRAM Industry Revenue (Million) Forecast, by Application 2019 & 2032
- Table 36: Netherland MRAM Industry Volume (K Unit) Forecast, by Application 2019 & 2032
- Table 37: Nordics MRAM Industry Revenue (Million) Forecast, by Application 2019 & 2032
- Table 38: Nordics MRAM Industry Volume (K Unit) Forecast, by Application 2019 & 2032
- Table 39: Rest of Europe MRAM Industry Revenue (Million) Forecast, by Application 2019 & 2032
- Table 40: Rest of Europe MRAM Industry Volume (K Unit) Forecast, by Application 2019 & 2032
- Table 41: Global MRAM Industry Revenue Million Forecast, by Country 2019 & 2032
- Table 42: Global MRAM Industry Volume K Unit Forecast, by Country 2019 & 2032
- Table 43: China MRAM Industry Revenue (Million) Forecast, by Application 2019 & 2032
- Table 44: China MRAM Industry Volume (K Unit) Forecast, by Application 2019 & 2032
- Table 45: Japan MRAM Industry Revenue (Million) Forecast, by Application 2019 & 2032
- Table 46: Japan MRAM Industry Volume (K Unit) Forecast, by Application 2019 & 2032
- Table 47: India MRAM Industry Revenue (Million) Forecast, by Application 2019 & 2032
- Table 48: India MRAM Industry Volume (K Unit) Forecast, by Application 2019 & 2032
- Table 49: South Korea MRAM Industry Revenue (Million) Forecast, by Application 2019 & 2032
- Table 50: South Korea MRAM Industry Volume (K Unit) Forecast, by Application 2019 & 2032
- Table 51: Southeast Asia MRAM Industry Revenue (Million) Forecast, by Application 2019 & 2032
- Table 52: Southeast Asia MRAM Industry Volume (K Unit) Forecast, by Application 2019 & 2032
- Table 53: Australia MRAM Industry Revenue (Million) Forecast, by Application 2019 & 2032
- Table 54: Australia MRAM Industry Volume (K Unit) Forecast, by Application 2019 & 2032
- Table 55: Indonesia MRAM Industry Revenue (Million) Forecast, by Application 2019 & 2032
- Table 56: Indonesia MRAM Industry Volume (K Unit) Forecast, by Application 2019 & 2032
- Table 57: Phillipes MRAM Industry Revenue (Million) Forecast, by Application 2019 & 2032
- Table 58: Phillipes MRAM Industry Volume (K Unit) Forecast, by Application 2019 & 2032
- Table 59: Singapore MRAM Industry Revenue (Million) Forecast, by Application 2019 & 2032
- Table 60: Singapore MRAM Industry Volume (K Unit) Forecast, by Application 2019 & 2032
- Table 61: Thailandc MRAM Industry Revenue (Million) Forecast, by Application 2019 & 2032
- Table 62: Thailandc MRAM Industry Volume (K Unit) Forecast, by Application 2019 & 2032
- Table 63: Rest of Asia Pacific MRAM Industry Revenue (Million) Forecast, by Application 2019 & 2032
- Table 64: Rest of Asia Pacific MRAM Industry Volume (K Unit) Forecast, by Application 2019 & 2032
- Table 65: Global MRAM Industry Revenue Million Forecast, by Country 2019 & 2032
- Table 66: Global MRAM Industry Volume K Unit Forecast, by Country 2019 & 2032
- Table 67: Brazil MRAM Industry Revenue (Million) Forecast, by Application 2019 & 2032
- Table 68: Brazil MRAM Industry Volume (K Unit) Forecast, by Application 2019 & 2032
- Table 69: Argentina MRAM Industry Revenue (Million) Forecast, by Application 2019 & 2032
- Table 70: Argentina MRAM Industry Volume (K Unit) Forecast, by Application 2019 & 2032
- Table 71: Peru MRAM Industry Revenue (Million) Forecast, by Application 2019 & 2032
- Table 72: Peru MRAM Industry Volume (K Unit) Forecast, by Application 2019 & 2032
- Table 73: Chile MRAM Industry Revenue (Million) Forecast, by Application 2019 & 2032
- Table 74: Chile MRAM Industry Volume (K Unit) Forecast, by Application 2019 & 2032
- Table 75: Colombia MRAM Industry Revenue (Million) Forecast, by Application 2019 & 2032
- Table 76: Colombia MRAM Industry Volume (K Unit) Forecast, by Application 2019 & 2032
- Table 77: Ecuador MRAM Industry Revenue (Million) Forecast, by Application 2019 & 2032
- Table 78: Ecuador MRAM Industry Volume (K Unit) Forecast, by Application 2019 & 2032
- Table 79: Venezuela MRAM Industry Revenue (Million) Forecast, by Application 2019 & 2032
- Table 80: Venezuela MRAM Industry Volume (K Unit) Forecast, by Application 2019 & 2032
- Table 81: Rest of South America MRAM Industry Revenue (Million) Forecast, by Application 2019 & 2032
- Table 82: Rest of South America MRAM Industry Volume (K Unit) Forecast, by Application 2019 & 2032
- Table 83: Global MRAM Industry Revenue Million Forecast, by Country 2019 & 2032
- Table 84: Global MRAM Industry Volume K Unit Forecast, by Country 2019 & 2032
- Table 85: United States MRAM Industry Revenue (Million) Forecast, by Application 2019 & 2032
- Table 86: United States MRAM Industry Volume (K Unit) Forecast, by Application 2019 & 2032
- Table 87: Canada MRAM Industry Revenue (Million) Forecast, by Application 2019 & 2032
- Table 88: Canada MRAM Industry Volume (K Unit) Forecast, by Application 2019 & 2032
- Table 89: Mexico MRAM Industry Revenue (Million) Forecast, by Application 2019 & 2032
- Table 90: Mexico MRAM Industry Volume (K Unit) Forecast, by Application 2019 & 2032
- Table 91: Global MRAM Industry Revenue Million Forecast, by Country 2019 & 2032
- Table 92: Global MRAM Industry Volume K Unit Forecast, by Country 2019 & 2032
- Table 93: United Arab Emirates MRAM Industry Revenue (Million) Forecast, by Application 2019 & 2032
- Table 94: United Arab Emirates MRAM Industry Volume (K Unit) Forecast, by Application 2019 & 2032
- Table 95: Saudi Arabia MRAM Industry Revenue (Million) Forecast, by Application 2019 & 2032
- Table 96: Saudi Arabia MRAM Industry Volume (K Unit) Forecast, by Application 2019 & 2032
- Table 97: South Africa MRAM Industry Revenue (Million) Forecast, by Application 2019 & 2032
- Table 98: South Africa MRAM Industry Volume (K Unit) Forecast, by Application 2019 & 2032
- Table 99: Rest of Middle East and Africa MRAM Industry Revenue (Million) Forecast, by Application 2019 & 2032
- Table 100: Rest of Middle East and Africa MRAM Industry Volume (K Unit) Forecast, by Application 2019 & 2032
- Table 101: Global MRAM Industry Revenue Million Forecast, by Type 2019 & 2032
- Table 102: Global MRAM Industry Volume K Unit Forecast, by Type 2019 & 2032
- Table 103: Global MRAM Industry Revenue Million Forecast, by Offering 2019 & 2032
- Table 104: Global MRAM Industry Volume K Unit Forecast, by Offering 2019 & 2032
- Table 105: Global MRAM Industry Revenue Million Forecast, by Application 2019 & 2032
- Table 106: Global MRAM Industry Volume K Unit Forecast, by Application 2019 & 2032
- Table 107: Global MRAM Industry Revenue Million Forecast, by Country 2019 & 2032
- Table 108: Global MRAM Industry Volume K Unit Forecast, by Country 2019 & 2032
- Table 109: Global MRAM Industry Revenue Million Forecast, by Type 2019 & 2032
- Table 110: Global MRAM Industry Volume K Unit Forecast, by Type 2019 & 2032
- Table 111: Global MRAM Industry Revenue Million Forecast, by Offering 2019 & 2032
- Table 112: Global MRAM Industry Volume K Unit Forecast, by Offering 2019 & 2032
- Table 113: Global MRAM Industry Revenue Million Forecast, by Application 2019 & 2032
- Table 114: Global MRAM Industry Volume K Unit Forecast, by Application 2019 & 2032
- Table 115: Global MRAM Industry Revenue Million Forecast, by Country 2019 & 2032
- Table 116: Global MRAM Industry Volume K Unit Forecast, by Country 2019 & 2032
- Table 117: Global MRAM Industry Revenue Million Forecast, by Type 2019 & 2032
- Table 118: Global MRAM Industry Volume K Unit Forecast, by Type 2019 & 2032
- Table 119: Global MRAM Industry Revenue Million Forecast, by Offering 2019 & 2032
- Table 120: Global MRAM Industry Volume K Unit Forecast, by Offering 2019 & 2032
- Table 121: Global MRAM Industry Revenue Million Forecast, by Application 2019 & 2032
- Table 122: Global MRAM Industry Volume K Unit Forecast, by Application 2019 & 2032
- Table 123: Global MRAM Industry Revenue Million Forecast, by Country 2019 & 2032
- Table 124: Global MRAM Industry Volume K Unit Forecast, by Country 2019 & 2032
- Table 125: Global MRAM Industry Revenue Million Forecast, by Type 2019 & 2032
- Table 126: Global MRAM Industry Volume K Unit Forecast, by Type 2019 & 2032
- Table 127: Global MRAM Industry Revenue Million Forecast, by Offering 2019 & 2032
- Table 128: Global MRAM Industry Volume K Unit Forecast, by Offering 2019 & 2032
- Table 129: Global MRAM Industry Revenue Million Forecast, by Application 2019 & 2032
- Table 130: Global MRAM Industry Volume K Unit Forecast, by Application 2019 & 2032
- Table 131: Global MRAM Industry Revenue Million Forecast, by Country 2019 & 2032
- Table 132: Global MRAM Industry Volume K Unit Forecast, by Country 2019 & 2032
- Table 133: Global MRAM Industry Revenue Million Forecast, by Type 2019 & 2032
- Table 134: Global MRAM Industry Volume K Unit Forecast, by Type 2019 & 2032
- Table 135: Global MRAM Industry Revenue Million Forecast, by Offering 2019 & 2032
- Table 136: Global MRAM Industry Volume K Unit Forecast, by Offering 2019 & 2032
- Table 137: Global MRAM Industry Revenue Million Forecast, by Application 2019 & 2032
- Table 138: Global MRAM Industry Volume K Unit Forecast, by Application 2019 & 2032
- Table 139: Global MRAM Industry Revenue Million Forecast, by Country 2019 & 2032
- Table 140: Global MRAM Industry Volume K Unit Forecast, by Country 2019 & 2032
Frequently Asked Questions
1. What is the projected Compound Annual Growth Rate (CAGR) of the MRAM Industry?
The projected CAGR is approximately 62.12%.
2. Which companies are prominent players in the MRAM Industry?
Key companies in the market include Avalanche Technology Inc, Infineon Technologies AG, Honeywell International Inc, Everspin Technologies Inc, NVE Corporation, Samsung Electronics Co Ltd, Tower Semiconductor, Qualcomm Incorporated, HFC Semiconductor Corporation, Spin Transfer Technologies, Crocus Nano Electronics LLC, Numem, Intel Corporation.
3. What are the main segments of the MRAM Industry?
The market segments include Type, Offering, Application.
4. Can you provide details about the market size?
The market size is estimated to be USD 2.01 Million as of 2022.
5. What are some drivers contributing to market growth?
Increasing Demand for Miniaturization of Electronic Devices; Increased Use of MRAM in RFID Tags.
6. What are the notable trends driving market growth?
Consumer Electronics May Experience Significant Growth.
7. Are there any restraints impacting market growth?
Increasing Preference for Live Person Interaction.
8. Can you provide examples of recent developments in the market?
September 2022 - Avalanche Technology, a next-generation MRAM technology provider, and United Microelectronics Corporation (UMC), a semiconductor foundry, launched their new high-reliability Persistent SRAM (P-SRAM) memory devices through UMC's 22nm process technology. The memory device would be based on Avalanche Technology's latest generation of Spin Transfer Torque Magneto-resistive RAM (STT-MRAM) technology and would offer its customers significant density, reliability, endurance, and power benefits over the existing non-volatile solutions.
9. What pricing options are available for accessing the report?
Pricing options include single-user, multi-user, and enterprise licenses priced at USD 4750, USD 5250, and USD 8750 respectively.
10. Is the market size provided in terms of value or volume?
The market size is provided in terms of value, measured in Million and volume, measured in K Unit.
11. Are there any specific market keywords associated with the report?
Yes, the market keyword associated with the report is "MRAM Industry," which aids in identifying and referencing the specific market segment covered.
12. How do I determine which pricing option suits my needs best?
The pricing options vary based on user requirements and access needs. Individual users may opt for single-user licenses, while businesses requiring broader access may choose multi-user or enterprise licenses for cost-effective access to the report.
13. Are there any additional resources or data provided in the MRAM Industry report?
While the report offers comprehensive insights, it's advisable to review the specific contents or supplementary materials provided to ascertain if additional resources or data are available.
14. How can I stay updated on further developments or reports in the MRAM Industry?
To stay informed about further developments, trends, and reports in the MRAM Industry, consider subscribing to industry newsletters, following relevant companies and organizations, or regularly checking reputable industry news sources and publications.
Methodology
Step 1 - Identification of Relevant Samples Size from Population Database


Step 2 - Approaches for Defining Global Market Size (Value, Volume* & Price*)

Note*: In applicable scenarios
Step 3 - Data Sources
Primary Research
- Web Analytics
- Survey Reports
- Research Institute
- Latest Research Reports
- Opinion Leaders
Secondary Research
- Annual Reports
- White Paper
- Latest Press Release
- Industry Association
- Paid Database
- Investor Presentations

Step 4 - Data Triangulation
Involves using different sources of information in order to increase the validity of a study
These sources are likely to be stakeholders in a program - participants, other researchers, program staff, other community members, and so on.
Then we put all data in single framework & apply various statistical tools to find out the dynamic on the market.
During the analysis stage, feedback from the stakeholder groups would be compared to determine areas of agreement as well as areas of divergence


