


Key Insights
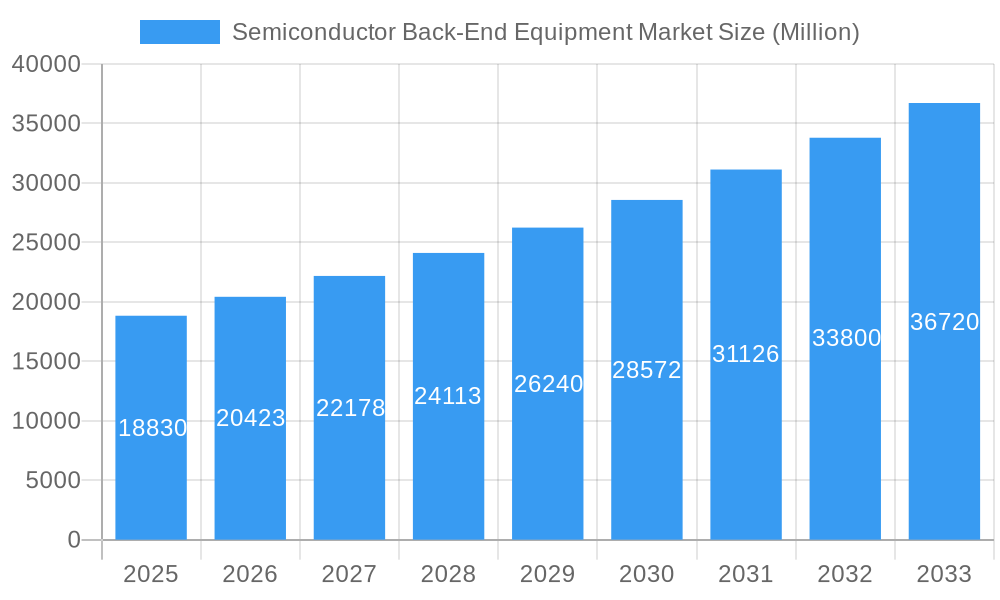
The Semiconductor Back-End Equipment market is experiencing robust growth, projected to reach \$18.83 billion in 2025 and maintain a Compound Annual Growth Rate (CAGR) of 8.75% from 2025 to 2033. This expansion is fueled by several key drivers. The increasing demand for advanced semiconductor devices in diverse applications, such as smartphones, automobiles, and high-performance computing, necessitates sophisticated back-end equipment. Miniaturization trends in electronics are pushing the boundaries of chip packaging, leading to a greater need for precision equipment in processes like dicing, bonding, and assembly. Furthermore, the rising adoption of advanced packaging technologies, including 3D stacking and system-in-package (SiP), is significantly contributing to market growth. Technological advancements in equipment, offering higher throughput, improved precision, and automation capabilities, are also key drivers. While challenges exist, such as the cyclical nature of the semiconductor industry and potential supply chain disruptions, the long-term outlook remains positive, driven by sustained demand and innovation.

Semiconductor Back-End Equipment Market Market Size (In Billion)

The market is segmented by equipment type into Metrology and Inspection, Dicing, Bonding, Assembly, and Packaging. North America and Asia Pacific currently dominate the market, but the Asia Pacific region is expected to witness the fastest growth due to its strong manufacturing base and increasing investment in semiconductor fabrication facilities. Companies such as Advantest, KLA, Teradyne, Nordson, Applied Materials, ASML, Screen Holdings, Onto Innovation, Tokyo Electron, and Lam Research are major players, competing based on technological innovation, product portfolio breadth, and global reach. The competitive landscape is characterized by strategic partnerships, mergers and acquisitions, and continuous R&D investment to develop cutting-edge solutions that meet the evolving needs of the semiconductor industry. The forecast period of 2025-2033 anticipates continued expansion, driven by the ongoing demand for higher performance and more compact semiconductor devices.
Semiconductor Back-End Equipment Market Company Market Share
Semiconductor Back-End Equipment Market: A Comprehensive Report (2019-2033)
This comprehensive report provides an in-depth analysis of the Semiconductor Back-End Equipment market, offering valuable insights into market dynamics, competitive landscapes, and future growth prospects. The study period spans from 2019 to 2033, with 2025 serving as the base and estimated year. The forecast period covers 2025-2033, while the historical period encompasses 2019-2024. The report meticulously examines various market segments, including Metrology and Inspection, Dicing, Bonding, Assembly and Packaging, and profiles key players such as Advantest Corporation, KLA Corporation, Teradyne Inc, Nordson Corporation, Applied Materials Inc, ASML Holding N.V., Screen Holdings Co. Ltd, Onto Innovation Inc, Tokyo Electron Limited, and LAM Research Corporation. The report's detailed analysis empowers businesses to make informed decisions and capitalize on emerging opportunities within this rapidly evolving market. The total market size in 2025 is estimated at xx Million.
Semiconductor Back-End Equipment Market Market Structure & Competitive Dynamics
The Semiconductor Back-End Equipment market exhibits a moderately consolidated structure, with a few major players holding significant market share. The market is characterized by intense competition, driven by technological advancements and the increasing demand for sophisticated semiconductor devices. Innovation ecosystems play a crucial role, with companies investing heavily in R&D to develop advanced equipment and processes. Regulatory frameworks, such as export controls and environmental regulations, influence market dynamics. Product substitution is a key aspect, with companies constantly seeking to improve efficiency and reduce costs. End-user trends, particularly in the automotive, consumer electronics, and data center sectors, significantly impact market demand. M&A activities are frequent, aiming to consolidate market share, access new technologies, and expand into new geographical markets. Recent M&A deals have involved xx Million in total value in the last 3 years.
- Market Concentration: The top 5 players account for approximately xx% of the market share in 2025.
- Innovation Ecosystems: Strong collaborations between equipment manufacturers, semiconductor manufacturers, and research institutions drive innovation.
- Regulatory Frameworks: Stringent environmental regulations are influencing the development of more sustainable equipment.
- Product Substitutes: The emergence of advanced packaging techniques is leading to the adoption of new equipment types.
- End-User Trends: The rising demand for high-performance computing and AI is fueling market growth.
- M&A Activities: Consolidation through mergers and acquisitions is a prominent trend, aiming to enhance scale and competitiveness.
Semiconductor Back-End Equipment Market Industry Trends & Insights
The Semiconductor Back-End Equipment market is experiencing robust growth, driven by several key factors. The increasing demand for advanced semiconductor devices, fueled by the proliferation of smartphones, IoT devices, and high-performance computing, is a primary driver. Technological disruptions, such as the development of advanced packaging technologies (e.g., 3D integration and chiplets), are reshaping the market landscape. Consumer preferences for smaller, faster, and more energy-efficient devices are creating a demand for sophisticated back-end equipment. The market is witnessing intense competitive dynamics, with companies constantly striving to innovate and differentiate their offerings. The Compound Annual Growth Rate (CAGR) during the forecast period (2025-2033) is projected to be xx%. Market penetration for advanced packaging equipment is expected to reach xx% by 2033.
Dominant Markets & Segments in Semiconductor Back-End Equipment Market
The Asia-Pacific region, particularly Taiwan, South Korea, and China, dominates the Semiconductor Back-End Equipment market, accounting for xx% of the global market in 2025. This dominance is attributed to a confluence of factors:
- Key Drivers in Asia-Pacific:
- Strong government support for the semiconductor industry.
- Presence of major semiconductor manufacturers.
- Robust infrastructure and skilled workforce.
- Significant investments in research and development.
The Assembly and Packaging segment holds the largest market share among the different equipment types (Metrology and Inspection, Dicing, Bonding, Assembly and Packaging), driven by the increasing complexity of semiconductor packaging technologies. This segment is expected to maintain its leadership throughout the forecast period, experiencing a CAGR of xx% from 2025 to 2033.
Semiconductor Back-End Equipment Market Product Innovations
Recent innovations focus on enhancing throughput, precision, and automation in back-end processes. Advanced metrology and inspection systems provide real-time feedback for improved yield and quality control. Automated assembly and packaging solutions are crucial for reducing manufacturing costs and increasing production efficiency. The development of new materials and processes, such as extreme ultraviolet (EUV) lithography and advanced packaging techniques, necessitates continuous innovation in back-end equipment. This trend is shaping the market's competitive landscape, favoring companies that invest heavily in R&D and have strong technological capabilities.
Report Segmentation & Scope
By Type:
- Metrology and Inspection: This segment encompasses equipment for measuring and inspecting wafers and packages at various stages of the back-end process. The market is expected to grow at a CAGR of xx% during the forecast period.
- Dicing: This segment involves equipment used for cutting wafers into individual dies. The market size for dicing equipment is estimated at xx Million in 2025.
- Bonding: This segment includes equipment for bonding dies to substrates or interconnects. The market is highly competitive, with various technologies vying for market share.
- Assembly and Packaging: This segment encompasses the broadest range of equipment, including those used for wire bonding, flip-chip bonding, and advanced packaging technologies. This is the largest segment and will likely continue to grow at a faster rate than other segments.
Key Drivers of Semiconductor Back-End Equipment Market Growth
The Semiconductor Back-End Equipment market is driven by several factors, including the increasing demand for advanced semiconductor devices, technological advancements in packaging techniques (such as 3D integration and heterogeneous integration), and the rising need for automation and higher precision in manufacturing. Government initiatives promoting domestic semiconductor manufacturing also contribute to market growth. Moreover, the expanding applications of semiconductors across various industries, particularly in automotive, consumer electronics, and data centers, further fuel market expansion.
Challenges in the Semiconductor Back-End Equipment Market Sector
The Semiconductor Back-End Equipment market faces challenges, including the high cost of advanced equipment, stringent environmental regulations, and the complex supply chain dynamics. The increasing geopolitical tensions and trade restrictions pose additional risks to market stability. Intense competition among established players and new entrants also presents challenges for profitability. Fluctuations in semiconductor demand due to economic cycles can negatively impact market growth. The combined effect of these challenges could lead to a xx% decrease in market growth if not addressed proactively.
Leading Players in the Semiconductor Back-End Equipment Market Market
- Advantest Corporation
- KLA Corporation
- Teradyne Inc
- Nordson Corporation
- Applied Materials Inc
- ASML Holding N.V.
- Screen Holdings Co. Ltd
- Onto Innovation Inc
- Tokyo Electron Limited
- LAM Research Corporation
Key Developments in Semiconductor Back-End Equipment Market Sector
- December 2023: Tokyo Electron announced the development of Extreme Laser Lift Off (XLO) technology for 3D integration of advanced semiconductor devices.
- December 2023: Advantest Corporation unveiled two new products for the AI and HPC markets, including the HA1200 die-level handler and the ATC 2-kW option for the M487x handler series.
Strategic Semiconductor Back-End Equipment Market Market Outlook
The Semiconductor Back-End Equipment market is poised for substantial growth in the coming years. Continued advancements in semiconductor technology, the increasing demand for high-performance computing and AI, and the growing adoption of advanced packaging techniques will create significant opportunities for market players. Strategic partnerships, technological innovation, and expansion into emerging markets will be crucial for success. The market is anticipated to witness a significant increase in the demand for automated and high-precision equipment, creating a promising outlook for companies that invest in R&D and offer innovative solutions.
Semiconductor Back-End Equipment Market Segmentation
-
1. Type
- 1.1. Metrology and Inspection
- 1.2. Dicing
- 1.3. Bonding
- 1.4. Assembly and Packaging
-
2. End-Use Industry
- 2.1. Semiconductors
- 2.2. Electronics
- 2.3. Automotive
- 2.4. Medical
- 2.5. Defense
Semiconductor Back-End Equipment Market Segmentation By Geography
- 1. United States
- 2. Europe
- 3. China
- 4. South Korea
- 5. Taiwan
- 6. Japan
- 7. Rest of the Asia Pacific
- 8. Rest of the World
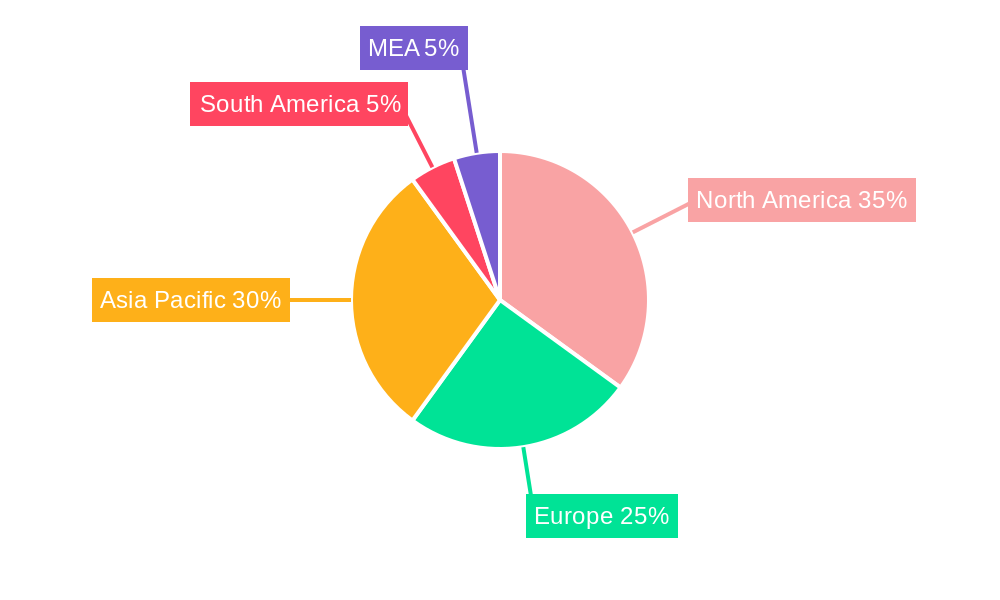
Semiconductor Back-End Equipment Market Regional Market Share
Geographic Coverage of Semiconductor Back-End Equipment Market
Semiconductor Back-End Equipment Market REPORT HIGHLIGHTS
| Aspects | Details |
|---|---|
| Study Period | 2020-2034 |
| Base Year | 2025 |
| Estimated Year | 2026 |
| Forecast Period | 2026-2034 |
| Historical Period | 2020-2025 |
| Growth Rate | CAGR of 8.75% from 2020-2034 |
| Segmentation |
|
Table of Contents
- 1. Introduction
- 1.1. Research Scope
- 1.2. Market Segmentation
- 1.3. Research Methodology
- 1.4. Definitions and Assumptions
- 2. Executive Summary
- 2.1. Introduction
- 3. Market Dynamics
- 3.1. Introduction
- 3.2. Market Drivers
- 3.2.1. Increasing Demand for Semiconductors in Electric and Hybrid Vehicles; Demand for Setting Up New Foundries (International Chip Shortage)
- 3.3. Market Restrains
- 3.3.1. High Setup Costs; Constant Evolution of Products Influencing Demand
- 3.4. Market Trends
- 3.4.1. Assembly and Packaging Segment is Expected to Witness Significant Growth
- 4. Market Factor Analysis
- 4.1. Porters Five Forces
- 4.2. Supply/Value Chain
- 4.3. PESTEL analysis
- 4.4. Market Entropy
- 4.5. Patent/Trademark Analysis
- 5. Global Semiconductor Back-End Equipment Market Analysis, Insights and Forecast, 2020-2032
- 5.1. Market Analysis, Insights and Forecast - by Type
- 5.1.1. Metrology and Inspection
- 5.1.2. Dicing
- 5.1.3. Bonding
- 5.1.4. Assembly and Packaging
- 5.2. Market Analysis, Insights and Forecast - by End-Use Industry
- 5.2.1. Semiconductors
- 5.2.2. Electronics
- 5.2.3. Automotive
- 5.2.4. Medical
- 5.2.5. Defense
- 5.3. Market Analysis, Insights and Forecast - by Region
- 5.3.1. United States
- 5.3.2. Europe
- 5.3.3. China
- 5.3.4. South Korea
- 5.3.5. Taiwan
- 5.3.6. Japan
- 5.3.7. Rest of the Asia Pacific
- 5.3.8. Rest of the World
- 5.1. Market Analysis, Insights and Forecast - by Type
- 6. United States Semiconductor Back-End Equipment Market Analysis, Insights and Forecast, 2020-2032
- 6.1. Market Analysis, Insights and Forecast - by Type
- 6.1.1. Metrology and Inspection
- 6.1.2. Dicing
- 6.1.3. Bonding
- 6.1.4. Assembly and Packaging
- 6.2. Market Analysis, Insights and Forecast - by End-Use Industry
- 6.2.1. Semiconductors
- 6.2.2. Electronics
- 6.2.3. Automotive
- 6.2.4. Medical
- 6.2.5. Defense
- 6.1. Market Analysis, Insights and Forecast - by Type
- 7. Europe Semiconductor Back-End Equipment Market Analysis, Insights and Forecast, 2020-2032
- 7.1. Market Analysis, Insights and Forecast - by Type
- 7.1.1. Metrology and Inspection
- 7.1.2. Dicing
- 7.1.3. Bonding
- 7.1.4. Assembly and Packaging
- 7.2. Market Analysis, Insights and Forecast - by End-Use Industry
- 7.2.1. Semiconductors
- 7.2.2. Electronics
- 7.2.3. Automotive
- 7.2.4. Medical
- 7.2.5. Defense
- 7.1. Market Analysis, Insights and Forecast - by Type
- 8. China Semiconductor Back-End Equipment Market Analysis, Insights and Forecast, 2020-2032
- 8.1. Market Analysis, Insights and Forecast - by Type
- 8.1.1. Metrology and Inspection
- 8.1.2. Dicing
- 8.1.3. Bonding
- 8.1.4. Assembly and Packaging
- 8.2. Market Analysis, Insights and Forecast - by End-Use Industry
- 8.2.1. Semiconductors
- 8.2.2. Electronics
- 8.2.3. Automotive
- 8.2.4. Medical
- 8.2.5. Defense
- 8.1. Market Analysis, Insights and Forecast - by Type
- 9. South Korea Semiconductor Back-End Equipment Market Analysis, Insights and Forecast, 2020-2032
- 9.1. Market Analysis, Insights and Forecast - by Type
- 9.1.1. Metrology and Inspection
- 9.1.2. Dicing
- 9.1.3. Bonding
- 9.1.4. Assembly and Packaging
- 9.2. Market Analysis, Insights and Forecast - by End-Use Industry
- 9.2.1. Semiconductors
- 9.2.2. Electronics
- 9.2.3. Automotive
- 9.2.4. Medical
- 9.2.5. Defense
- 9.1. Market Analysis, Insights and Forecast - by Type
- 10. Taiwan Semiconductor Back-End Equipment Market Analysis, Insights and Forecast, 2020-2032
- 10.1. Market Analysis, Insights and Forecast - by Type
- 10.1.1. Metrology and Inspection
- 10.1.2. Dicing
- 10.1.3. Bonding
- 10.1.4. Assembly and Packaging
- 10.2. Market Analysis, Insights and Forecast - by End-Use Industry
- 10.2.1. Semiconductors
- 10.2.2. Electronics
- 10.2.3. Automotive
- 10.2.4. Medical
- 10.2.5. Defense
- 10.1. Market Analysis, Insights and Forecast - by Type
- 11. Japan Semiconductor Back-End Equipment Market Analysis, Insights and Forecast, 2020-2032
- 11.1. Market Analysis, Insights and Forecast - by Type
- 11.1.1. Metrology and Inspection
- 11.1.2. Dicing
- 11.1.3. Bonding
- 11.1.4. Assembly and Packaging
- 11.2. Market Analysis, Insights and Forecast - by End-Use Industry
- 11.2.1. Semiconductors
- 11.2.2. Electronics
- 11.2.3. Automotive
- 11.2.4. Medical
- 11.2.5. Defense
- 11.1. Market Analysis, Insights and Forecast - by Type
- 12. Rest of the Asia Pacific Semiconductor Back-End Equipment Market Analysis, Insights and Forecast, 2020-2032
- 12.1. Market Analysis, Insights and Forecast - by Type
- 12.1.1. Metrology and Inspection
- 12.1.2. Dicing
- 12.1.3. Bonding
- 12.1.4. Assembly and Packaging
- 12.2. Market Analysis, Insights and Forecast - by End-Use Industry
- 12.2.1. Semiconductors
- 12.2.2. Electronics
- 12.2.3. Automotive
- 12.2.4. Medical
- 12.2.5. Defense
- 12.1. Market Analysis, Insights and Forecast - by Type
- 13. Rest of the World Semiconductor Back-End Equipment Market Analysis, Insights and Forecast, 2020-2032
- 13.1. Market Analysis, Insights and Forecast - by Type
- 13.1.1. Metrology and Inspection
- 13.1.2. Dicing
- 13.1.3. Bonding
- 13.1.4. Assembly and Packaging
- 13.2. Market Analysis, Insights and Forecast - by End-Use Industry
- 13.2.1. Semiconductors
- 13.2.2. Electronics
- 13.2.3. Automotive
- 13.2.4. Medical
- 13.2.5. Defense
- 13.1. Market Analysis, Insights and Forecast - by Type
- 14. Competitive Analysis
- 14.1. Global Market Share Analysis 2025
- 14.2. Company Profiles
- 14.2.1 Advantest Corporation
- 14.2.1.1. Overview
- 14.2.1.2. Products
- 14.2.1.3. SWOT Analysis
- 14.2.1.4. Recent Developments
- 14.2.1.5. Financials (Based on Availability)
- 14.2.2 KLA Corporation
- 14.2.2.1. Overview
- 14.2.2.2. Products
- 14.2.2.3. SWOT Analysis
- 14.2.2.4. Recent Developments
- 14.2.2.5. Financials (Based on Availability)
- 14.2.3 Teradyne Inc
- 14.2.3.1. Overview
- 14.2.3.2. Products
- 14.2.3.3. SWOT Analysis
- 14.2.3.4. Recent Developments
- 14.2.3.5. Financials (Based on Availability)
- 14.2.4 Nordson Corporatio
- 14.2.4.1. Overview
- 14.2.4.2. Products
- 14.2.4.3. SWOT Analysis
- 14.2.4.4. Recent Developments
- 14.2.4.5. Financials (Based on Availability)
- 14.2.5 Applied Materials Inc
- 14.2.5.1. Overview
- 14.2.5.2. Products
- 14.2.5.3. SWOT Analysis
- 14.2.5.4. Recent Developments
- 14.2.5.5. Financials (Based on Availability)
- 14.2.6 ASML Holding N V
- 14.2.6.1. Overview
- 14.2.6.2. Products
- 14.2.6.3. SWOT Analysis
- 14.2.6.4. Recent Developments
- 14.2.6.5. Financials (Based on Availability)
- 14.2.7 Screen Holdings Co Ltd
- 14.2.7.1. Overview
- 14.2.7.2. Products
- 14.2.7.3. SWOT Analysis
- 14.2.7.4. Recent Developments
- 14.2.7.5. Financials (Based on Availability)
- 14.2.8 Onto Innovation Inc
- 14.2.8.1. Overview
- 14.2.8.2. Products
- 14.2.8.3. SWOT Analysis
- 14.2.8.4. Recent Developments
- 14.2.8.5. Financials (Based on Availability)
- 14.2.9 Tokyo Electron Limited
- 14.2.9.1. Overview
- 14.2.9.2. Products
- 14.2.9.3. SWOT Analysis
- 14.2.9.4. Recent Developments
- 14.2.9.5. Financials (Based on Availability)
- 14.2.10 LAM Research Corporation
- 14.2.10.1. Overview
- 14.2.10.2. Products
- 14.2.10.3. SWOT Analysis
- 14.2.10.4. Recent Developments
- 14.2.10.5. Financials (Based on Availability)
- 14.2.1 Advantest Corporation
List of Figures
- Figure 1: Global Semiconductor Back-End Equipment Market Revenue Breakdown (Million, %) by Region 2025 & 2033
- Figure 2: Global Semiconductor Back-End Equipment Market Volume Breakdown (K Unit, %) by Region 2025 & 2033
- Figure 3: United States Semiconductor Back-End Equipment Market Revenue (Million), by Type 2025 & 2033
- Figure 4: United States Semiconductor Back-End Equipment Market Volume (K Unit), by Type 2025 & 2033
- Figure 5: United States Semiconductor Back-End Equipment Market Revenue Share (%), by Type 2025 & 2033
- Figure 6: United States Semiconductor Back-End Equipment Market Volume Share (%), by Type 2025 & 2033
- Figure 7: United States Semiconductor Back-End Equipment Market Revenue (Million), by End-Use Industry 2025 & 2033
- Figure 8: United States Semiconductor Back-End Equipment Market Volume (K Unit), by End-Use Industry 2025 & 2033
- Figure 9: United States Semiconductor Back-End Equipment Market Revenue Share (%), by End-Use Industry 2025 & 2033
- Figure 10: United States Semiconductor Back-End Equipment Market Volume Share (%), by End-Use Industry 2025 & 2033
- Figure 11: United States Semiconductor Back-End Equipment Market Revenue (Million), by Country 2025 & 2033
- Figure 12: United States Semiconductor Back-End Equipment Market Volume (K Unit), by Country 2025 & 2033
- Figure 13: United States Semiconductor Back-End Equipment Market Revenue Share (%), by Country 2025 & 2033
- Figure 14: United States Semiconductor Back-End Equipment Market Volume Share (%), by Country 2025 & 2033
- Figure 15: Europe Semiconductor Back-End Equipment Market Revenue (Million), by Type 2025 & 2033
- Figure 16: Europe Semiconductor Back-End Equipment Market Volume (K Unit), by Type 2025 & 2033
- Figure 17: Europe Semiconductor Back-End Equipment Market Revenue Share (%), by Type 2025 & 2033
- Figure 18: Europe Semiconductor Back-End Equipment Market Volume Share (%), by Type 2025 & 2033
- Figure 19: Europe Semiconductor Back-End Equipment Market Revenue (Million), by End-Use Industry 2025 & 2033
- Figure 20: Europe Semiconductor Back-End Equipment Market Volume (K Unit), by End-Use Industry 2025 & 2033
- Figure 21: Europe Semiconductor Back-End Equipment Market Revenue Share (%), by End-Use Industry 2025 & 2033
- Figure 22: Europe Semiconductor Back-End Equipment Market Volume Share (%), by End-Use Industry 2025 & 2033
- Figure 23: Europe Semiconductor Back-End Equipment Market Revenue (Million), by Country 2025 & 2033
- Figure 24: Europe Semiconductor Back-End Equipment Market Volume (K Unit), by Country 2025 & 2033
- Figure 25: Europe Semiconductor Back-End Equipment Market Revenue Share (%), by Country 2025 & 2033
- Figure 26: Europe Semiconductor Back-End Equipment Market Volume Share (%), by Country 2025 & 2033
- Figure 27: China Semiconductor Back-End Equipment Market Revenue (Million), by Type 2025 & 2033
- Figure 28: China Semiconductor Back-End Equipment Market Volume (K Unit), by Type 2025 & 2033
- Figure 29: China Semiconductor Back-End Equipment Market Revenue Share (%), by Type 2025 & 2033
- Figure 30: China Semiconductor Back-End Equipment Market Volume Share (%), by Type 2025 & 2033
- Figure 31: China Semiconductor Back-End Equipment Market Revenue (Million), by End-Use Industry 2025 & 2033
- Figure 32: China Semiconductor Back-End Equipment Market Volume (K Unit), by End-Use Industry 2025 & 2033
- Figure 33: China Semiconductor Back-End Equipment Market Revenue Share (%), by End-Use Industry 2025 & 2033
- Figure 34: China Semiconductor Back-End Equipment Market Volume Share (%), by End-Use Industry 2025 & 2033
- Figure 35: China Semiconductor Back-End Equipment Market Revenue (Million), by Country 2025 & 2033
- Figure 36: China Semiconductor Back-End Equipment Market Volume (K Unit), by Country 2025 & 2033
- Figure 37: China Semiconductor Back-End Equipment Market Revenue Share (%), by Country 2025 & 2033
- Figure 38: China Semiconductor Back-End Equipment Market Volume Share (%), by Country 2025 & 2033
- Figure 39: South Korea Semiconductor Back-End Equipment Market Revenue (Million), by Type 2025 & 2033
- Figure 40: South Korea Semiconductor Back-End Equipment Market Volume (K Unit), by Type 2025 & 2033
- Figure 41: South Korea Semiconductor Back-End Equipment Market Revenue Share (%), by Type 2025 & 2033
- Figure 42: South Korea Semiconductor Back-End Equipment Market Volume Share (%), by Type 2025 & 2033
- Figure 43: South Korea Semiconductor Back-End Equipment Market Revenue (Million), by End-Use Industry 2025 & 2033
- Figure 44: South Korea Semiconductor Back-End Equipment Market Volume (K Unit), by End-Use Industry 2025 & 2033
- Figure 45: South Korea Semiconductor Back-End Equipment Market Revenue Share (%), by End-Use Industry 2025 & 2033
- Figure 46: South Korea Semiconductor Back-End Equipment Market Volume Share (%), by End-Use Industry 2025 & 2033
- Figure 47: South Korea Semiconductor Back-End Equipment Market Revenue (Million), by Country 2025 & 2033
- Figure 48: South Korea Semiconductor Back-End Equipment Market Volume (K Unit), by Country 2025 & 2033
- Figure 49: South Korea Semiconductor Back-End Equipment Market Revenue Share (%), by Country 2025 & 2033
- Figure 50: South Korea Semiconductor Back-End Equipment Market Volume Share (%), by Country 2025 & 2033
- Figure 51: Taiwan Semiconductor Back-End Equipment Market Revenue (Million), by Type 2025 & 2033
- Figure 52: Taiwan Semiconductor Back-End Equipment Market Volume (K Unit), by Type 2025 & 2033
- Figure 53: Taiwan Semiconductor Back-End Equipment Market Revenue Share (%), by Type 2025 & 2033
- Figure 54: Taiwan Semiconductor Back-End Equipment Market Volume Share (%), by Type 2025 & 2033
- Figure 55: Taiwan Semiconductor Back-End Equipment Market Revenue (Million), by End-Use Industry 2025 & 2033
- Figure 56: Taiwan Semiconductor Back-End Equipment Market Volume (K Unit), by End-Use Industry 2025 & 2033
- Figure 57: Taiwan Semiconductor Back-End Equipment Market Revenue Share (%), by End-Use Industry 2025 & 2033
- Figure 58: Taiwan Semiconductor Back-End Equipment Market Volume Share (%), by End-Use Industry 2025 & 2033
- Figure 59: Taiwan Semiconductor Back-End Equipment Market Revenue (Million), by Country 2025 & 2033
- Figure 60: Taiwan Semiconductor Back-End Equipment Market Volume (K Unit), by Country 2025 & 2033
- Figure 61: Taiwan Semiconductor Back-End Equipment Market Revenue Share (%), by Country 2025 & 2033
- Figure 62: Taiwan Semiconductor Back-End Equipment Market Volume Share (%), by Country 2025 & 2033
- Figure 63: Japan Semiconductor Back-End Equipment Market Revenue (Million), by Type 2025 & 2033
- Figure 64: Japan Semiconductor Back-End Equipment Market Volume (K Unit), by Type 2025 & 2033
- Figure 65: Japan Semiconductor Back-End Equipment Market Revenue Share (%), by Type 2025 & 2033
- Figure 66: Japan Semiconductor Back-End Equipment Market Volume Share (%), by Type 2025 & 2033
- Figure 67: Japan Semiconductor Back-End Equipment Market Revenue (Million), by End-Use Industry 2025 & 2033
- Figure 68: Japan Semiconductor Back-End Equipment Market Volume (K Unit), by End-Use Industry 2025 & 2033
- Figure 69: Japan Semiconductor Back-End Equipment Market Revenue Share (%), by End-Use Industry 2025 & 2033
- Figure 70: Japan Semiconductor Back-End Equipment Market Volume Share (%), by End-Use Industry 2025 & 2033
- Figure 71: Japan Semiconductor Back-End Equipment Market Revenue (Million), by Country 2025 & 2033
- Figure 72: Japan Semiconductor Back-End Equipment Market Volume (K Unit), by Country 2025 & 2033
- Figure 73: Japan Semiconductor Back-End Equipment Market Revenue Share (%), by Country 2025 & 2033
- Figure 74: Japan Semiconductor Back-End Equipment Market Volume Share (%), by Country 2025 & 2033
- Figure 75: Rest of the Asia Pacific Semiconductor Back-End Equipment Market Revenue (Million), by Type 2025 & 2033
- Figure 76: Rest of the Asia Pacific Semiconductor Back-End Equipment Market Volume (K Unit), by Type 2025 & 2033
- Figure 77: Rest of the Asia Pacific Semiconductor Back-End Equipment Market Revenue Share (%), by Type 2025 & 2033
- Figure 78: Rest of the Asia Pacific Semiconductor Back-End Equipment Market Volume Share (%), by Type 2025 & 2033
- Figure 79: Rest of the Asia Pacific Semiconductor Back-End Equipment Market Revenue (Million), by End-Use Industry 2025 & 2033
- Figure 80: Rest of the Asia Pacific Semiconductor Back-End Equipment Market Volume (K Unit), by End-Use Industry 2025 & 2033
- Figure 81: Rest of the Asia Pacific Semiconductor Back-End Equipment Market Revenue Share (%), by End-Use Industry 2025 & 2033
- Figure 82: Rest of the Asia Pacific Semiconductor Back-End Equipment Market Volume Share (%), by End-Use Industry 2025 & 2033
- Figure 83: Rest of the Asia Pacific Semiconductor Back-End Equipment Market Revenue (Million), by Country 2025 & 2033
- Figure 84: Rest of the Asia Pacific Semiconductor Back-End Equipment Market Volume (K Unit), by Country 2025 & 2033
- Figure 85: Rest of the Asia Pacific Semiconductor Back-End Equipment Market Revenue Share (%), by Country 2025 & 2033
- Figure 86: Rest of the Asia Pacific Semiconductor Back-End Equipment Market Volume Share (%), by Country 2025 & 2033
- Figure 87: Rest of the World Semiconductor Back-End Equipment Market Revenue (Million), by Type 2025 & 2033
- Figure 88: Rest of the World Semiconductor Back-End Equipment Market Volume (K Unit), by Type 2025 & 2033
- Figure 89: Rest of the World Semiconductor Back-End Equipment Market Revenue Share (%), by Type 2025 & 2033
- Figure 90: Rest of the World Semiconductor Back-End Equipment Market Volume Share (%), by Type 2025 & 2033
- Figure 91: Rest of the World Semiconductor Back-End Equipment Market Revenue (Million), by End-Use Industry 2025 & 2033
- Figure 92: Rest of the World Semiconductor Back-End Equipment Market Volume (K Unit), by End-Use Industry 2025 & 2033
- Figure 93: Rest of the World Semiconductor Back-End Equipment Market Revenue Share (%), by End-Use Industry 2025 & 2033
- Figure 94: Rest of the World Semiconductor Back-End Equipment Market Volume Share (%), by End-Use Industry 2025 & 2033
- Figure 95: Rest of the World Semiconductor Back-End Equipment Market Revenue (Million), by Country 2025 & 2033
- Figure 96: Rest of the World Semiconductor Back-End Equipment Market Volume (K Unit), by Country 2025 & 2033
- Figure 97: Rest of the World Semiconductor Back-End Equipment Market Revenue Share (%), by Country 2025 & 2033
- Figure 98: Rest of the World Semiconductor Back-End Equipment Market Volume Share (%), by Country 2025 & 2033
List of Tables
- Table 1: Global Semiconductor Back-End Equipment Market Revenue Million Forecast, by Type 2020 & 2033
- Table 2: Global Semiconductor Back-End Equipment Market Volume K Unit Forecast, by Type 2020 & 2033
- Table 3: Global Semiconductor Back-End Equipment Market Revenue Million Forecast, by End-Use Industry 2020 & 2033
- Table 4: Global Semiconductor Back-End Equipment Market Volume K Unit Forecast, by End-Use Industry 2020 & 2033
- Table 5: Global Semiconductor Back-End Equipment Market Revenue Million Forecast, by Region 2020 & 2033
- Table 6: Global Semiconductor Back-End Equipment Market Volume K Unit Forecast, by Region 2020 & 2033
- Table 7: Global Semiconductor Back-End Equipment Market Revenue Million Forecast, by Type 2020 & 2033
- Table 8: Global Semiconductor Back-End Equipment Market Volume K Unit Forecast, by Type 2020 & 2033
- Table 9: Global Semiconductor Back-End Equipment Market Revenue Million Forecast, by End-Use Industry 2020 & 2033
- Table 10: Global Semiconductor Back-End Equipment Market Volume K Unit Forecast, by End-Use Industry 2020 & 2033
- Table 11: Global Semiconductor Back-End Equipment Market Revenue Million Forecast, by Country 2020 & 2033
- Table 12: Global Semiconductor Back-End Equipment Market Volume K Unit Forecast, by Country 2020 & 2033
- Table 13: Global Semiconductor Back-End Equipment Market Revenue Million Forecast, by Type 2020 & 2033
- Table 14: Global Semiconductor Back-End Equipment Market Volume K Unit Forecast, by Type 2020 & 2033
- Table 15: Global Semiconductor Back-End Equipment Market Revenue Million Forecast, by End-Use Industry 2020 & 2033
- Table 16: Global Semiconductor Back-End Equipment Market Volume K Unit Forecast, by End-Use Industry 2020 & 2033
- Table 17: Global Semiconductor Back-End Equipment Market Revenue Million Forecast, by Country 2020 & 2033
- Table 18: Global Semiconductor Back-End Equipment Market Volume K Unit Forecast, by Country 2020 & 2033
- Table 19: Global Semiconductor Back-End Equipment Market Revenue Million Forecast, by Type 2020 & 2033
- Table 20: Global Semiconductor Back-End Equipment Market Volume K Unit Forecast, by Type 2020 & 2033
- Table 21: Global Semiconductor Back-End Equipment Market Revenue Million Forecast, by End-Use Industry 2020 & 2033
- Table 22: Global Semiconductor Back-End Equipment Market Volume K Unit Forecast, by End-Use Industry 2020 & 2033
- Table 23: Global Semiconductor Back-End Equipment Market Revenue Million Forecast, by Country 2020 & 2033
- Table 24: Global Semiconductor Back-End Equipment Market Volume K Unit Forecast, by Country 2020 & 2033
- Table 25: Global Semiconductor Back-End Equipment Market Revenue Million Forecast, by Type 2020 & 2033
- Table 26: Global Semiconductor Back-End Equipment Market Volume K Unit Forecast, by Type 2020 & 2033
- Table 27: Global Semiconductor Back-End Equipment Market Revenue Million Forecast, by End-Use Industry 2020 & 2033
- Table 28: Global Semiconductor Back-End Equipment Market Volume K Unit Forecast, by End-Use Industry 2020 & 2033
- Table 29: Global Semiconductor Back-End Equipment Market Revenue Million Forecast, by Country 2020 & 2033
- Table 30: Global Semiconductor Back-End Equipment Market Volume K Unit Forecast, by Country 2020 & 2033
- Table 31: Global Semiconductor Back-End Equipment Market Revenue Million Forecast, by Type 2020 & 2033
- Table 32: Global Semiconductor Back-End Equipment Market Volume K Unit Forecast, by Type 2020 & 2033
- Table 33: Global Semiconductor Back-End Equipment Market Revenue Million Forecast, by End-Use Industry 2020 & 2033
- Table 34: Global Semiconductor Back-End Equipment Market Volume K Unit Forecast, by End-Use Industry 2020 & 2033
- Table 35: Global Semiconductor Back-End Equipment Market Revenue Million Forecast, by Country 2020 & 2033
- Table 36: Global Semiconductor Back-End Equipment Market Volume K Unit Forecast, by Country 2020 & 2033
- Table 37: Global Semiconductor Back-End Equipment Market Revenue Million Forecast, by Type 2020 & 2033
- Table 38: Global Semiconductor Back-End Equipment Market Volume K Unit Forecast, by Type 2020 & 2033
- Table 39: Global Semiconductor Back-End Equipment Market Revenue Million Forecast, by End-Use Industry 2020 & 2033
- Table 40: Global Semiconductor Back-End Equipment Market Volume K Unit Forecast, by End-Use Industry 2020 & 2033
- Table 41: Global Semiconductor Back-End Equipment Market Revenue Million Forecast, by Country 2020 & 2033
- Table 42: Global Semiconductor Back-End Equipment Market Volume K Unit Forecast, by Country 2020 & 2033
- Table 43: Global Semiconductor Back-End Equipment Market Revenue Million Forecast, by Type 2020 & 2033
- Table 44: Global Semiconductor Back-End Equipment Market Volume K Unit Forecast, by Type 2020 & 2033
- Table 45: Global Semiconductor Back-End Equipment Market Revenue Million Forecast, by End-Use Industry 2020 & 2033
- Table 46: Global Semiconductor Back-End Equipment Market Volume K Unit Forecast, by End-Use Industry 2020 & 2033
- Table 47: Global Semiconductor Back-End Equipment Market Revenue Million Forecast, by Country 2020 & 2033
- Table 48: Global Semiconductor Back-End Equipment Market Volume K Unit Forecast, by Country 2020 & 2033
- Table 49: Global Semiconductor Back-End Equipment Market Revenue Million Forecast, by Type 2020 & 2033
- Table 50: Global Semiconductor Back-End Equipment Market Volume K Unit Forecast, by Type 2020 & 2033
- Table 51: Global Semiconductor Back-End Equipment Market Revenue Million Forecast, by End-Use Industry 2020 & 2033
- Table 52: Global Semiconductor Back-End Equipment Market Volume K Unit Forecast, by End-Use Industry 2020 & 2033
- Table 53: Global Semiconductor Back-End Equipment Market Revenue Million Forecast, by Country 2020 & 2033
- Table 54: Global Semiconductor Back-End Equipment Market Volume K Unit Forecast, by Country 2020 & 2033
Frequently Asked Questions
1. What is the projected Compound Annual Growth Rate (CAGR) of the Semiconductor Back-End Equipment Market?
The projected CAGR is approximately 8.75%.
2. Which companies are prominent players in the Semiconductor Back-End Equipment Market?
Key companies in the market include Advantest Corporation, KLA Corporation, Teradyne Inc, Nordson Corporatio, Applied Materials Inc, ASML Holding N V, Screen Holdings Co Ltd, Onto Innovation Inc, Tokyo Electron Limited, LAM Research Corporation.
3. What are the main segments of the Semiconductor Back-End Equipment Market?
The market segments include Type, End-Use Industry.
4. Can you provide details about the market size?
The market size is estimated to be USD 18.83 Million as of 2022.
5. What are some drivers contributing to market growth?
Increasing Demand for Semiconductors in Electric and Hybrid Vehicles; Demand for Setting Up New Foundries (International Chip Shortage).
6. What are the notable trends driving market growth?
Assembly and Packaging Segment is Expected to Witness Significant Growth.
7. Are there any restraints impacting market growth?
High Setup Costs; Constant Evolution of Products Influencing Demand.
8. Can you provide examples of recent developments in the market?
December 2023: Tokyo Electron announced that it has developed an Extreme Laser Lift Off (XLO) technology that contributes to innovations in 3D integration of advanced semiconductor devices adopting permanent wafer bonding. This new technology for two permanently bonded silicon wafers uses a laser to separate the top silicon substrate from the bottom substrate with an integrated circuit layer.
9. What pricing options are available for accessing the report?
Pricing options include single-user, multi-user, and enterprise licenses priced at USD 4750, USD 5250, and USD 8750 respectively.
10. Is the market size provided in terms of value or volume?
The market size is provided in terms of value, measured in Million and volume, measured in K Unit.
11. Are there any specific market keywords associated with the report?
Yes, the market keyword associated with the report is "Semiconductor Back-End Equipment Market," which aids in identifying and referencing the specific market segment covered.
12. How do I determine which pricing option suits my needs best?
The pricing options vary based on user requirements and access needs. Individual users may opt for single-user licenses, while businesses requiring broader access may choose multi-user or enterprise licenses for cost-effective access to the report.
13. Are there any additional resources or data provided in the Semiconductor Back-End Equipment Market report?
While the report offers comprehensive insights, it's advisable to review the specific contents or supplementary materials provided to ascertain if additional resources or data are available.
14. How can I stay updated on further developments or reports in the Semiconductor Back-End Equipment Market?
To stay informed about further developments, trends, and reports in the Semiconductor Back-End Equipment Market, consider subscribing to industry newsletters, following relevant companies and organizations, or regularly checking reputable industry news sources and publications.
Methodology
Step 1 - Identification of Relevant Samples Size from Population Database


Step 2 - Approaches for Defining Global Market Size (Value, Volume* & Price*)

Note*: In applicable scenarios
Step 3 - Data Sources
Primary Research
- Web Analytics
- Survey Reports
- Research Institute
- Latest Research Reports
- Opinion Leaders
Secondary Research
- Annual Reports
- White Paper
- Latest Press Release
- Industry Association
- Paid Database
- Investor Presentations

Step 4 - Data Triangulation
Involves using different sources of information in order to increase the validity of a study
These sources are likely to be stakeholders in a program - participants, other researchers, program staff, other community members, and so on.
Then we put all data in single framework & apply various statistical tools to find out the dynamic on the market.
During the analysis stage, feedback from the stakeholder groups would be compared to determine areas of agreement as well as areas of divergence