
Key Insights
The MEA Demand Response Management Systems (DRMS) market is experiencing robust growth, driven by increasing electricity demand, rising energy costs, and the urgent need for grid stability and efficiency improvements across the region. The market's expansion is fueled by government initiatives promoting renewable energy integration and smart grid technologies. Countries like Saudi Arabia and the UAE are leading the adoption of DRMS, investing heavily in infrastructure upgrades and smart metering deployments. Furthermore, the increasing penetration of distributed generation resources, such as rooftop solar, necessitates advanced DRMS to manage fluctuating power supply and demand. While the initial investment in DRMS can be substantial, the long-term benefits in terms of cost savings, reduced grid congestion, and enhanced reliability are compelling incentives for utilities and industrial consumers. The market is segmented into conventional and automated DRMS, with a clear trend towards the latter, driven by technological advancements and the potential for greater efficiency and automation.
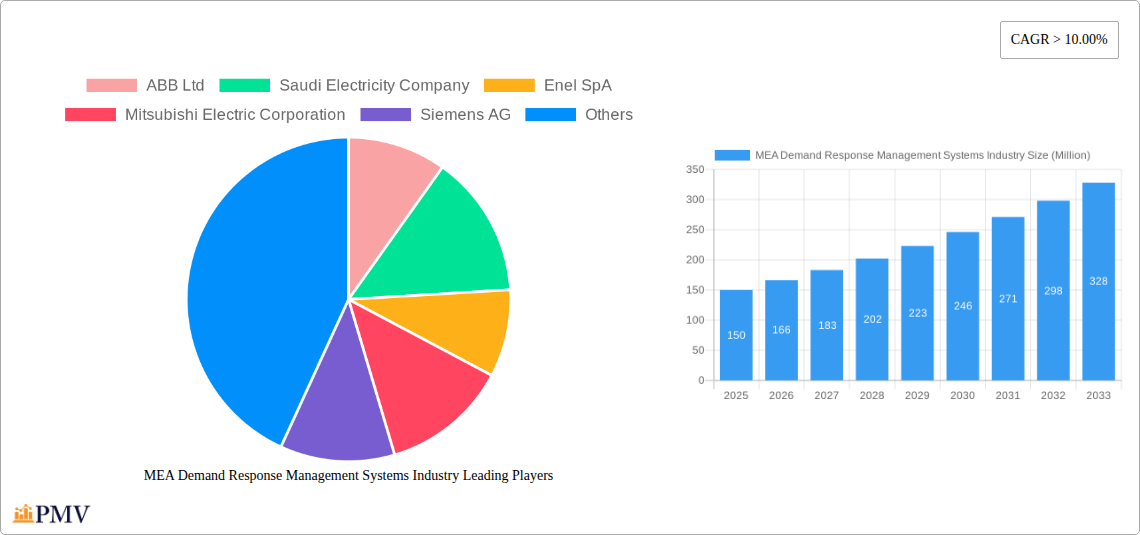
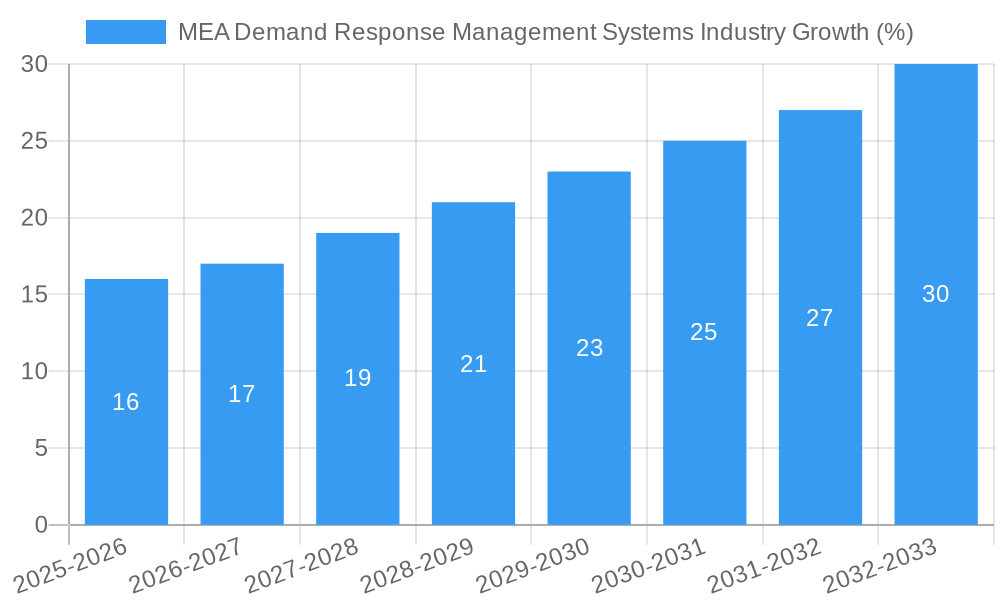
The competitive landscape is characterized by a mix of international players and regional companies. International vendors like ABB, Siemens, and Schneider Electric are leveraging their global expertise and established presence to secure market share, while local players are focusing on adapting their solutions to the specific needs and challenges of the MEA region. The growth trajectory of the MEA DRMS market is projected to remain strong throughout the forecast period (2025-2033), with a Compound Annual Growth Rate (CAGR) exceeding 10%. While challenges remain – including regulatory hurdles, technological maturity, and the need for skilled workforce development – the long-term prospects for DRMS adoption in the MEA region are exceptionally positive, given the region's ongoing economic development and energy transition efforts. The market size, although not specified, can be reasonably inferred to be significantly influenced by factors such as population growth, industrial expansion, and government policies.
MEA Demand Response Management Systems Industry: A Comprehensive Market Report (2019-2033)
This comprehensive report provides an in-depth analysis of the Middle East and Africa (MEA) Demand Response Management Systems industry, offering invaluable insights for stakeholders seeking to navigate this rapidly evolving market. The report covers the period 2019-2033, with a focus on the forecast period 2025-2033, using 2025 as the base year and estimated year. The market is segmented by type: Conventional Demand Response and Automated Demand Response. Key players analyzed include ABB Ltd, Saudi Electricity Company, Enel SpA, Mitsubishi Electric Corporation, Siemens AG, Alstom SA, Eaton Corporation PLC, Schneider Electric, and General Electric Company. The total market size in 2025 is estimated at xx Million.
MEA Demand Response Management Systems Industry Market Structure & Competitive Dynamics
The MEA Demand Response Management Systems market exhibits a moderately concentrated structure, with several multinational corporations holding significant market share. ABB Ltd, Siemens AG, and Schneider Electric are among the leading players, commanding a combined market share of approximately xx%. The market is characterized by intense competition, driven by continuous technological advancements and evolving regulatory landscapes. Innovation ecosystems are emerging, with several startups and smaller players focusing on niche applications and specialized solutions.
The regulatory framework varies across MEA countries, impacting market dynamics and investment decisions. Government initiatives aimed at energy efficiency and sustainability are fostering market growth, while the presence of product substitutes, particularly traditional energy management approaches, poses a challenge. End-user trends towards automation and digitalization are driving demand for sophisticated Demand Response Management Systems. Mergers and acquisitions (M&A) activity has been relatively modest in recent years, with deal values totaling approximately xx Million in the historical period (2019-2024). However, increased consolidation is expected in the forecast period as larger players seek to expand their market presence.
- Market Concentration: Moderately concentrated, with top three players holding xx% market share.
- Innovation Ecosystems: Emerging, with startups focusing on niche solutions.
- Regulatory Frameworks: Vary across MEA countries, impacting market growth.
- M&A Activity (2019-2024): Total deal value approximately xx Million.
MEA Demand Response Management Systems Industry Industry Trends & Insights
The MEA Demand Response Management Systems market is experiencing robust growth, driven by several key factors. The rising energy demand across the region, coupled with increasing electricity prices and a growing focus on sustainability, is creating a favorable environment for the adoption of Demand Response Management Systems. Technological advancements, such as the integration of artificial intelligence (AI) and machine learning (ML) in automated demand response systems, are further enhancing market growth. Consumer preferences are shifting towards energy-efficient solutions, driving demand for advanced systems. The market is also witnessing increased competition, pushing players to innovate and offer cost-effective solutions. The CAGR for the forecast period (2025-2033) is estimated at xx%, with market penetration expected to reach xx% by 2033.
Dominant Markets & Segments in MEA Demand Response Management Systems Industry
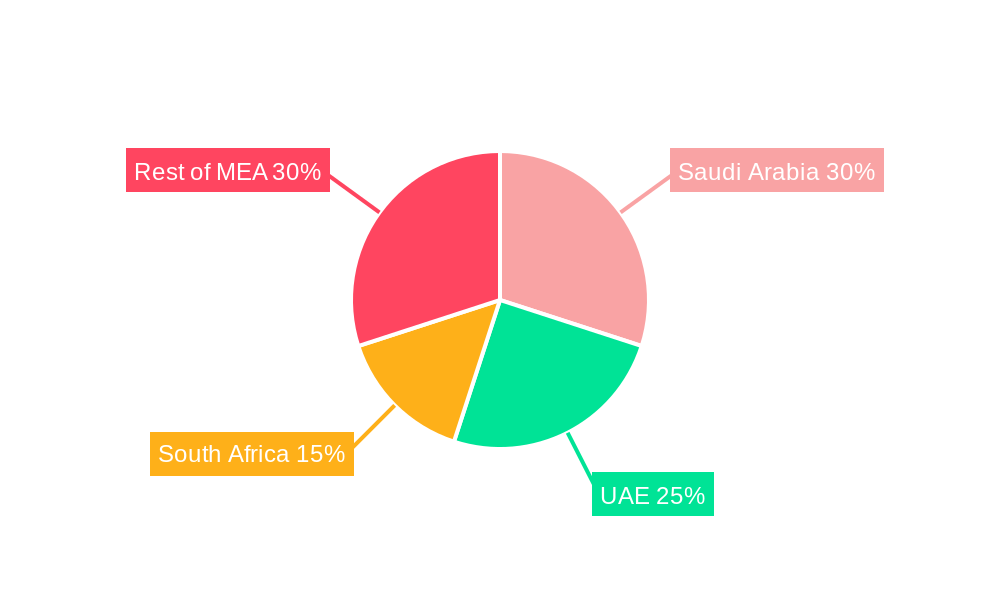
The UAE and Saudi Arabia are currently the dominant markets in the MEA region for Demand Response Management Systems, driven by substantial investments in infrastructure development, supportive government policies promoting energy efficiency, and a high concentration of large industrial and commercial consumers.
- Key Drivers in the UAE and Saudi Arabia:
- Significant investments in renewable energy infrastructure.
- Supportive government policies promoting energy efficiency and sustainability.
- High concentration of large industrial and commercial consumers.
- Growing adoption of smart grid technologies.
Automated Demand Response systems are experiencing faster growth compared to conventional systems, owing to their advanced capabilities and enhanced efficiency. This segment is projected to capture a larger market share in the coming years, driven by the increasing adoption of smart grid technologies and IoT devices.
MEA Demand Response Management Systems Industry Product Innovations
Recent product innovations in the MEA Demand Response Management Systems market focus on advanced analytics, AI-powered optimization, and enhanced integration with smart grid infrastructure. New systems offer improved accuracy in forecasting energy consumption, more efficient load management capabilities, and better integration with renewable energy sources. These innovations are geared toward improving overall energy efficiency, reducing operational costs, and enhancing grid stability. The market fit for these products is strong, driven by the rising demand for sophisticated and cost-effective solutions.
Report Segmentation & Scope
The report segments the MEA Demand Response Management Systems market by type:
Conventional Demand Response: This segment encompasses traditional demand response programs, relying on manual interventions and direct communication with consumers. The market size for this segment in 2025 is estimated at xx Million, with a projected CAGR of xx% during the forecast period. Competition in this segment is relatively moderate.
Automated Demand Response: This segment comprises advanced systems leveraging automation and smart technologies for real-time load management. The market size for this segment in 2025 is projected at xx Million, exhibiting a higher CAGR of xx% due to increasing technological advancements and consumer adoption. Competition in this segment is more intense, reflecting the rapid pace of innovation.
Key Drivers of MEA Demand Response Management Systems Industry Growth
The MEA Demand Response Management Systems market is propelled by several key drivers. Government regulations promoting energy efficiency and sustainability are creating a favorable environment for market growth. Increasing energy demand and rising electricity prices are incentivizing businesses and consumers to adopt energy-saving solutions. Technological advancements in automated demand response systems are improving efficiency and reducing operational costs. Finally, growing awareness of climate change and the need to reduce carbon emissions are further driving market expansion.
Challenges in the MEA Demand Response Management Systems Industry Sector
Despite significant growth potential, the MEA Demand Response Management Systems market faces certain challenges. Regulatory inconsistencies across different MEA countries can create barriers to market entry and expansion. Supply chain disruptions, particularly concerning the availability of advanced technologies and components, can impact the deployment of new systems. Furthermore, competition from established players and the emergence of new entrants can exert pressure on profit margins. These factors collectively impede rapid market growth, although they do not pose insurmountable obstacles. The overall impact on growth is estimated at a reduction of xx% in the projected market size.
Leading Players in the MEA Demand Response Management Systems Industry Market
- ABB Ltd
- Saudi Electricity Company
- Enel SpA
- Mitsubishi Electric Corporation
- Siemens AG
- Alstom SA
- Eaton Corporation PLC
- Schneider Electric
- General Electric Company
Key Developments in MEA Demand Response Management Systems Industry Sector
- November 2022: The Abu Dhabi Department of Economic Development (ADDED) expanded the Energy Tariff Incentive Programme (ETIP 2.0), offering preferential rates for gas and electricity to the industrial sector based on economic impact, Emiratisation rate, and energy management efficiency. This significantly incentivizes adoption of Demand Response Management Systems.
- April 2022: The Ministry of Energy and Infrastructure launched a database to monitor energy and water consumption in UAE government buildings. This initiative, part of the National Water and Energy Demand Management Programme (NWEDMP), will help identify areas for improvement and drive further adoption of efficient systems.
Strategic MEA Demand Response Management Systems Industry Market Outlook
The MEA Demand Response Management Systems market presents significant growth opportunities in the coming years. Continued investments in renewable energy infrastructure, supportive government policies, and increasing energy demand will drive market expansion. Technological advancements, particularly in AI and IoT, will further enhance the efficiency and effectiveness of Demand Response Management Systems. Companies focusing on innovation, strategic partnerships, and adapting to the evolving regulatory landscape will be best positioned to capitalize on the substantial growth potential.
MEA Demand Response Management Systems Industry Segmentation
-
1. Type
- 1.1. Conventional Demand Response
- 1.2. Automated Demand Response
-
2. Geography
- 2.1. United Arab Emirates
- 2.2. Saudi Arabian
- 2.3. South Africa
- 2.4. Res of Middle-East and Africa
MEA Demand Response Management Systems Industry Segmentation By Geography
- 1. United Arab Emirates
- 2. Saudi Arabian
- 3. South Africa
- 4. Res of Middle East and Africa
MEA Demand Response Management Systems Industry REPORT HIGHLIGHTS
| Aspects | Details |
|---|---|
| Study Period | 2019-2033 |
| Base Year | 2024 |
| Estimated Year | 2025 |
| Forecast Period | 2025-2033 |
| Historical Period | 2019-2024 |
| Growth Rate | CAGR of > 10.00% from 2019-2033 |
| Segmentation |
|
Table of Contents
- 1. Introduction
- 1.1. Research Scope
- 1.2. Market Segmentation
- 1.3. Research Methodology
- 1.4. Definitions and Assumptions
- 2. Executive Summary
- 2.1. Introduction
- 3. Market Dynamics
- 3.1. Introduction
- 3.2. Market Drivers
- 3.2.1. 4.; Need for Efficient Energy Management Systems4.; Growing Penetration of Renewable Energy Sources
- 3.3. Market Restrains
- 3.3.1. 4.; Privacy Concerns on the Industrial Demand Response Management Systems
- 3.4. Market Trends
- 3.4.1. Automated Demand Response System to Grow at the Fastest Rate
- 4. Market Factor Analysis
- 4.1. Porters Five Forces
- 4.2. Supply/Value Chain
- 4.3. PESTEL analysis
- 4.4. Market Entropy
- 4.5. Patent/Trademark Analysis
- 5. Global MEA Demand Response Management Systems Industry Analysis, Insights and Forecast, 2019-2031
- 5.1. Market Analysis, Insights and Forecast - by Type
- 5.1.1. Conventional Demand Response
- 5.1.2. Automated Demand Response
- 5.2. Market Analysis, Insights and Forecast - by Geography
- 5.2.1. United Arab Emirates
- 5.2.2. Saudi Arabian
- 5.2.3. South Africa
- 5.2.4. Res of Middle-East and Africa
- 5.3. Market Analysis, Insights and Forecast - by Region
- 5.3.1. United Arab Emirates
- 5.3.2. Saudi Arabian
- 5.3.3. South Africa
- 5.3.4. Res of Middle East and Africa
- 5.1. Market Analysis, Insights and Forecast - by Type
- 6. United Arab Emirates MEA Demand Response Management Systems Industry Analysis, Insights and Forecast, 2019-2031
- 6.1. Market Analysis, Insights and Forecast - by Type
- 6.1.1. Conventional Demand Response
- 6.1.2. Automated Demand Response
- 6.2. Market Analysis, Insights and Forecast - by Geography
- 6.2.1. United Arab Emirates
- 6.2.2. Saudi Arabian
- 6.2.3. South Africa
- 6.2.4. Res of Middle-East and Africa
- 6.1. Market Analysis, Insights and Forecast - by Type
- 7. Saudi Arabian MEA Demand Response Management Systems Industry Analysis, Insights and Forecast, 2019-2031
- 7.1. Market Analysis, Insights and Forecast - by Type
- 7.1.1. Conventional Demand Response
- 7.1.2. Automated Demand Response
- 7.2. Market Analysis, Insights and Forecast - by Geography
- 7.2.1. United Arab Emirates
- 7.2.2. Saudi Arabian
- 7.2.3. South Africa
- 7.2.4. Res of Middle-East and Africa
- 7.1. Market Analysis, Insights and Forecast - by Type
- 8. South Africa MEA Demand Response Management Systems Industry Analysis, Insights and Forecast, 2019-2031
- 8.1. Market Analysis, Insights and Forecast - by Type
- 8.1.1. Conventional Demand Response
- 8.1.2. Automated Demand Response
- 8.2. Market Analysis, Insights and Forecast - by Geography
- 8.2.1. United Arab Emirates
- 8.2.2. Saudi Arabian
- 8.2.3. South Africa
- 8.2.4. Res of Middle-East and Africa
- 8.1. Market Analysis, Insights and Forecast - by Type
- 9. Res of Middle East and Africa MEA Demand Response Management Systems Industry Analysis, Insights and Forecast, 2019-2031
- 9.1. Market Analysis, Insights and Forecast - by Type
- 9.1.1. Conventional Demand Response
- 9.1.2. Automated Demand Response
- 9.2. Market Analysis, Insights and Forecast - by Geography
- 9.2.1. United Arab Emirates
- 9.2.2. Saudi Arabian
- 9.2.3. South Africa
- 9.2.4. Res of Middle-East and Africa
- 9.1. Market Analysis, Insights and Forecast - by Type
- 10. North America MEA Demand Response Management Systems Industry Analysis, Insights and Forecast, 2019-2031
- 10.1. Market Analysis, Insights and Forecast - By Country/Sub-region
- 10.1.1 United States
- 10.1.2 Canada
- 10.1.3 Mexico
- 11. Europe MEA Demand Response Management Systems Industry Analysis, Insights and Forecast, 2019-2031
- 11.1. Market Analysis, Insights and Forecast - By Country/Sub-region
- 11.1.1 Germany
- 11.1.2 United Kingdom
- 11.1.3 France
- 11.1.4 Spain
- 11.1.5 Italy
- 11.1.6 Spain
- 11.1.7 Belgium
- 11.1.8 Netherland
- 11.1.9 Nordics
- 11.1.10 Rest of Europe
- 12. Asia Pacific MEA Demand Response Management Systems Industry Analysis, Insights and Forecast, 2019-2031
- 12.1. Market Analysis, Insights and Forecast - By Country/Sub-region
- 12.1.1 China
- 12.1.2 Japan
- 12.1.3 India
- 12.1.4 South Korea
- 12.1.5 Southeast Asia
- 12.1.6 Australia
- 12.1.7 Indonesia
- 12.1.8 Phillipes
- 12.1.9 Singapore
- 12.1.10 Thailandc
- 12.1.11 Rest of Asia Pacific
- 13. South America MEA Demand Response Management Systems Industry Analysis, Insights and Forecast, 2019-2031
- 13.1. Market Analysis, Insights and Forecast - By Country/Sub-region
- 13.1.1 Brazil
- 13.1.2 Argentina
- 13.1.3 Peru
- 13.1.4 Chile
- 13.1.5 Colombia
- 13.1.6 Ecuador
- 13.1.7 Venezuela
- 13.1.8 Rest of South America
- 14. MEA MEA Demand Response Management Systems Industry Analysis, Insights and Forecast, 2019-2031
- 14.1. Market Analysis, Insights and Forecast - By Country/Sub-region
- 14.1.1 United Arab Emirates
- 14.1.2 Saudi Arabia
- 14.1.3 South Africa
- 14.1.4 Rest of Middle East and Africa
- 15. Competitive Analysis
- 15.1. Global Market Share Analysis 2024
- 15.2. Company Profiles
- 15.2.1 ABB Ltd
- 15.2.1.1. Overview
- 15.2.1.2. Products
- 15.2.1.3. SWOT Analysis
- 15.2.1.4. Recent Developments
- 15.2.1.5. Financials (Based on Availability)
- 15.2.2 Saudi Electricity Company
- 15.2.2.1. Overview
- 15.2.2.2. Products
- 15.2.2.3. SWOT Analysis
- 15.2.2.4. Recent Developments
- 15.2.2.5. Financials (Based on Availability)
- 15.2.3 Enel SpA
- 15.2.3.1. Overview
- 15.2.3.2. Products
- 15.2.3.3. SWOT Analysis
- 15.2.3.4. Recent Developments
- 15.2.3.5. Financials (Based on Availability)
- 15.2.4 Mitsubishi Electric Corporation
- 15.2.4.1. Overview
- 15.2.4.2. Products
- 15.2.4.3. SWOT Analysis
- 15.2.4.4. Recent Developments
- 15.2.4.5. Financials (Based on Availability)
- 15.2.5 Siemens AG
- 15.2.5.1. Overview
- 15.2.5.2. Products
- 15.2.5.3. SWOT Analysis
- 15.2.5.4. Recent Developments
- 15.2.5.5. Financials (Based on Availability)
- 15.2.6 Alstom SA
- 15.2.6.1. Overview
- 15.2.6.2. Products
- 15.2.6.3. SWOT Analysis
- 15.2.6.4. Recent Developments
- 15.2.6.5. Financials (Based on Availability)
- 15.2.7 Eaton Corporation PLC
- 15.2.7.1. Overview
- 15.2.7.2. Products
- 15.2.7.3. SWOT Analysis
- 15.2.7.4. Recent Developments
- 15.2.7.5. Financials (Based on Availability)
- 15.2.8 Schneider Electric
- 15.2.8.1. Overview
- 15.2.8.2. Products
- 15.2.8.3. SWOT Analysis
- 15.2.8.4. Recent Developments
- 15.2.8.5. Financials (Based on Availability)
- 15.2.9 General Electric Company
- 15.2.9.1. Overview
- 15.2.9.2. Products
- 15.2.9.3. SWOT Analysis
- 15.2.9.4. Recent Developments
- 15.2.9.5. Financials (Based on Availability)
- 15.2.1 ABB Ltd
List of Figures
- Figure 1: Global MEA Demand Response Management Systems Industry Revenue Breakdown (Million, %) by Region 2024 & 2032
- Figure 2: North America MEA Demand Response Management Systems Industry Revenue (Million), by Country 2024 & 2032
- Figure 3: North America MEA Demand Response Management Systems Industry Revenue Share (%), by Country 2024 & 2032
- Figure 4: Europe MEA Demand Response Management Systems Industry Revenue (Million), by Country 2024 & 2032
- Figure 5: Europe MEA Demand Response Management Systems Industry Revenue Share (%), by Country 2024 & 2032
- Figure 6: Asia Pacific MEA Demand Response Management Systems Industry Revenue (Million), by Country 2024 & 2032
- Figure 7: Asia Pacific MEA Demand Response Management Systems Industry Revenue Share (%), by Country 2024 & 2032
- Figure 8: South America MEA Demand Response Management Systems Industry Revenue (Million), by Country 2024 & 2032
- Figure 9: South America MEA Demand Response Management Systems Industry Revenue Share (%), by Country 2024 & 2032
- Figure 10: MEA MEA Demand Response Management Systems Industry Revenue (Million), by Country 2024 & 2032
- Figure 11: MEA MEA Demand Response Management Systems Industry Revenue Share (%), by Country 2024 & 2032
- Figure 12: United Arab Emirates MEA Demand Response Management Systems Industry Revenue (Million), by Type 2024 & 2032
- Figure 13: United Arab Emirates MEA Demand Response Management Systems Industry Revenue Share (%), by Type 2024 & 2032
- Figure 14: United Arab Emirates MEA Demand Response Management Systems Industry Revenue (Million), by Geography 2024 & 2032
- Figure 15: United Arab Emirates MEA Demand Response Management Systems Industry Revenue Share (%), by Geography 2024 & 2032
- Figure 16: United Arab Emirates MEA Demand Response Management Systems Industry Revenue (Million), by Country 2024 & 2032
- Figure 17: United Arab Emirates MEA Demand Response Management Systems Industry Revenue Share (%), by Country 2024 & 2032
- Figure 18: Saudi Arabian MEA Demand Response Management Systems Industry Revenue (Million), by Type 2024 & 2032
- Figure 19: Saudi Arabian MEA Demand Response Management Systems Industry Revenue Share (%), by Type 2024 & 2032
- Figure 20: Saudi Arabian MEA Demand Response Management Systems Industry Revenue (Million), by Geography 2024 & 2032
- Figure 21: Saudi Arabian MEA Demand Response Management Systems Industry Revenue Share (%), by Geography 2024 & 2032
- Figure 22: Saudi Arabian MEA Demand Response Management Systems Industry Revenue (Million), by Country 2024 & 2032
- Figure 23: Saudi Arabian MEA Demand Response Management Systems Industry Revenue Share (%), by Country 2024 & 2032
- Figure 24: South Africa MEA Demand Response Management Systems Industry Revenue (Million), by Type 2024 & 2032
- Figure 25: South Africa MEA Demand Response Management Systems Industry Revenue Share (%), by Type 2024 & 2032
- Figure 26: South Africa MEA Demand Response Management Systems Industry Revenue (Million), by Geography 2024 & 2032
- Figure 27: South Africa MEA Demand Response Management Systems Industry Revenue Share (%), by Geography 2024 & 2032
- Figure 28: South Africa MEA Demand Response Management Systems Industry Revenue (Million), by Country 2024 & 2032
- Figure 29: South Africa MEA Demand Response Management Systems Industry Revenue Share (%), by Country 2024 & 2032
- Figure 30: Res of Middle East and Africa MEA Demand Response Management Systems Industry Revenue (Million), by Type 2024 & 2032
- Figure 31: Res of Middle East and Africa MEA Demand Response Management Systems Industry Revenue Share (%), by Type 2024 & 2032
- Figure 32: Res of Middle East and Africa MEA Demand Response Management Systems Industry Revenue (Million), by Geography 2024 & 2032
- Figure 33: Res of Middle East and Africa MEA Demand Response Management Systems Industry Revenue Share (%), by Geography 2024 & 2032
- Figure 34: Res of Middle East and Africa MEA Demand Response Management Systems Industry Revenue (Million), by Country 2024 & 2032
- Figure 35: Res of Middle East and Africa MEA Demand Response Management Systems Industry Revenue Share (%), by Country 2024 & 2032
List of Tables
- Table 1: Global MEA Demand Response Management Systems Industry Revenue Million Forecast, by Region 2019 & 2032
- Table 2: Global MEA Demand Response Management Systems Industry Revenue Million Forecast, by Type 2019 & 2032
- Table 3: Global MEA Demand Response Management Systems Industry Revenue Million Forecast, by Geography 2019 & 2032
- Table 4: Global MEA Demand Response Management Systems Industry Revenue Million Forecast, by Region 2019 & 2032
- Table 5: Global MEA Demand Response Management Systems Industry Revenue Million Forecast, by Country 2019 & 2032
- Table 6: United States MEA Demand Response Management Systems Industry Revenue (Million) Forecast, by Application 2019 & 2032
- Table 7: Canada MEA Demand Response Management Systems Industry Revenue (Million) Forecast, by Application 2019 & 2032
- Table 8: Mexico MEA Demand Response Management Systems Industry Revenue (Million) Forecast, by Application 2019 & 2032
- Table 9: Global MEA Demand Response Management Systems Industry Revenue Million Forecast, by Country 2019 & 2032
- Table 10: Germany MEA Demand Response Management Systems Industry Revenue (Million) Forecast, by Application 2019 & 2032
- Table 11: United Kingdom MEA Demand Response Management Systems Industry Revenue (Million) Forecast, by Application 2019 & 2032
- Table 12: France MEA Demand Response Management Systems Industry Revenue (Million) Forecast, by Application 2019 & 2032
- Table 13: Spain MEA Demand Response Management Systems Industry Revenue (Million) Forecast, by Application 2019 & 2032
- Table 14: Italy MEA Demand Response Management Systems Industry Revenue (Million) Forecast, by Application 2019 & 2032
- Table 15: Spain MEA Demand Response Management Systems Industry Revenue (Million) Forecast, by Application 2019 & 2032
- Table 16: Belgium MEA Demand Response Management Systems Industry Revenue (Million) Forecast, by Application 2019 & 2032
- Table 17: Netherland MEA Demand Response Management Systems Industry Revenue (Million) Forecast, by Application 2019 & 2032
- Table 18: Nordics MEA Demand Response Management Systems Industry Revenue (Million) Forecast, by Application 2019 & 2032
- Table 19: Rest of Europe MEA Demand Response Management Systems Industry Revenue (Million) Forecast, by Application 2019 & 2032
- Table 20: Global MEA Demand Response Management Systems Industry Revenue Million Forecast, by Country 2019 & 2032
- Table 21: China MEA Demand Response Management Systems Industry Revenue (Million) Forecast, by Application 2019 & 2032
- Table 22: Japan MEA Demand Response Management Systems Industry Revenue (Million) Forecast, by Application 2019 & 2032
- Table 23: India MEA Demand Response Management Systems Industry Revenue (Million) Forecast, by Application 2019 & 2032
- Table 24: South Korea MEA Demand Response Management Systems Industry Revenue (Million) Forecast, by Application 2019 & 2032
- Table 25: Southeast Asia MEA Demand Response Management Systems Industry Revenue (Million) Forecast, by Application 2019 & 2032
- Table 26: Australia MEA Demand Response Management Systems Industry Revenue (Million) Forecast, by Application 2019 & 2032
- Table 27: Indonesia MEA Demand Response Management Systems Industry Revenue (Million) Forecast, by Application 2019 & 2032
- Table 28: Phillipes MEA Demand Response Management Systems Industry Revenue (Million) Forecast, by Application 2019 & 2032
- Table 29: Singapore MEA Demand Response Management Systems Industry Revenue (Million) Forecast, by Application 2019 & 2032
- Table 30: Thailandc MEA Demand Response Management Systems Industry Revenue (Million) Forecast, by Application 2019 & 2032
- Table 31: Rest of Asia Pacific MEA Demand Response Management Systems Industry Revenue (Million) Forecast, by Application 2019 & 2032
- Table 32: Global MEA Demand Response Management Systems Industry Revenue Million Forecast, by Country 2019 & 2032
- Table 33: Brazil MEA Demand Response Management Systems Industry Revenue (Million) Forecast, by Application 2019 & 2032
- Table 34: Argentina MEA Demand Response Management Systems Industry Revenue (Million) Forecast, by Application 2019 & 2032
- Table 35: Peru MEA Demand Response Management Systems Industry Revenue (Million) Forecast, by Application 2019 & 2032
- Table 36: Chile MEA Demand Response Management Systems Industry Revenue (Million) Forecast, by Application 2019 & 2032
- Table 37: Colombia MEA Demand Response Management Systems Industry Revenue (Million) Forecast, by Application 2019 & 2032
- Table 38: Ecuador MEA Demand Response Management Systems Industry Revenue (Million) Forecast, by Application 2019 & 2032
- Table 39: Venezuela MEA Demand Response Management Systems Industry Revenue (Million) Forecast, by Application 2019 & 2032
- Table 40: Rest of South America MEA Demand Response Management Systems Industry Revenue (Million) Forecast, by Application 2019 & 2032
- Table 41: Global MEA Demand Response Management Systems Industry Revenue Million Forecast, by Country 2019 & 2032
- Table 42: United Arab Emirates MEA Demand Response Management Systems Industry Revenue (Million) Forecast, by Application 2019 & 2032
- Table 43: Saudi Arabia MEA Demand Response Management Systems Industry Revenue (Million) Forecast, by Application 2019 & 2032
- Table 44: South Africa MEA Demand Response Management Systems Industry Revenue (Million) Forecast, by Application 2019 & 2032
- Table 45: Rest of Middle East and Africa MEA Demand Response Management Systems Industry Revenue (Million) Forecast, by Application 2019 & 2032
- Table 46: Global MEA Demand Response Management Systems Industry Revenue Million Forecast, by Type 2019 & 2032
- Table 47: Global MEA Demand Response Management Systems Industry Revenue Million Forecast, by Geography 2019 & 2032
- Table 48: Global MEA Demand Response Management Systems Industry Revenue Million Forecast, by Country 2019 & 2032
- Table 49: Global MEA Demand Response Management Systems Industry Revenue Million Forecast, by Type 2019 & 2032
- Table 50: Global MEA Demand Response Management Systems Industry Revenue Million Forecast, by Geography 2019 & 2032
- Table 51: Global MEA Demand Response Management Systems Industry Revenue Million Forecast, by Country 2019 & 2032
- Table 52: Global MEA Demand Response Management Systems Industry Revenue Million Forecast, by Type 2019 & 2032
- Table 53: Global MEA Demand Response Management Systems Industry Revenue Million Forecast, by Geography 2019 & 2032
- Table 54: Global MEA Demand Response Management Systems Industry Revenue Million Forecast, by Country 2019 & 2032
- Table 55: Global MEA Demand Response Management Systems Industry Revenue Million Forecast, by Type 2019 & 2032
- Table 56: Global MEA Demand Response Management Systems Industry Revenue Million Forecast, by Geography 2019 & 2032
- Table 57: Global MEA Demand Response Management Systems Industry Revenue Million Forecast, by Country 2019 & 2032
Frequently Asked Questions
1. What is the projected Compound Annual Growth Rate (CAGR) of the MEA Demand Response Management Systems Industry?
The projected CAGR is approximately > 10.00%.
2. Which companies are prominent players in the MEA Demand Response Management Systems Industry?
Key companies in the market include ABB Ltd, Saudi Electricity Company, Enel SpA, Mitsubishi Electric Corporation, Siemens AG, Alstom SA, Eaton Corporation PLC, Schneider Electric, General Electric Company.
3. What are the main segments of the MEA Demand Response Management Systems Industry?
The market segments include Type, Geography.
4. Can you provide details about the market size?
The market size is estimated to be USD XX Million as of 2022.
5. What are some drivers contributing to market growth?
4.; Need for Efficient Energy Management Systems4.; Growing Penetration of Renewable Energy Sources.
6. What are the notable trends driving market growth?
Automated Demand Response System to Grow at the Fastest Rate.
7. Are there any restraints impacting market growth?
4.; Privacy Concerns on the Industrial Demand Response Management Systems.
8. Can you provide examples of recent developments in the market?
Nov 2022: The Abu Dhabi Department of Economic Development (ADDED) expanded the Energy Tariff Incentive Programme (ETIP 2.0) by offering preferential rates for gas and electricity to the industrial sector based on eligibility criteria that include economic impact, Emiratisation rate, and energy management efficiency.
9. What pricing options are available for accessing the report?
Pricing options include single-user, multi-user, and enterprise licenses priced at USD 4750, USD 5250, and USD 8750 respectively.
10. Is the market size provided in terms of value or volume?
The market size is provided in terms of value, measured in Million.
11. Are there any specific market keywords associated with the report?
Yes, the market keyword associated with the report is "MEA Demand Response Management Systems Industry," which aids in identifying and referencing the specific market segment covered.
12. How do I determine which pricing option suits my needs best?
The pricing options vary based on user requirements and access needs. Individual users may opt for single-user licenses, while businesses requiring broader access may choose multi-user or enterprise licenses for cost-effective access to the report.
13. Are there any additional resources or data provided in the MEA Demand Response Management Systems Industry report?
While the report offers comprehensive insights, it's advisable to review the specific contents or supplementary materials provided to ascertain if additional resources or data are available.
14. How can I stay updated on further developments or reports in the MEA Demand Response Management Systems Industry?
To stay informed about further developments, trends, and reports in the MEA Demand Response Management Systems Industry, consider subscribing to industry newsletters, following relevant companies and organizations, or regularly checking reputable industry news sources and publications.
Methodology
Step 1 - Identification of Relevant Samples Size from Population Database


Step 2 - Approaches for Defining Global Market Size (Value, Volume* & Price*)

Note*: In applicable scenarios
Step 3 - Data Sources
Primary Research
- Web Analytics
- Survey Reports
- Research Institute
- Latest Research Reports
- Opinion Leaders
Secondary Research
- Annual Reports
- White Paper
- Latest Press Release
- Industry Association
- Paid Database
- Investor Presentations

Step 4 - Data Triangulation
Involves using different sources of information in order to increase the validity of a study
These sources are likely to be stakeholders in a program - participants, other researchers, program staff, other community members, and so on.
Then we put all data in single framework & apply various statistical tools to find out the dynamic on the market.
During the analysis stage, feedback from the stakeholder groups would be compared to determine areas of agreement as well as areas of divergence


