
Key Insights
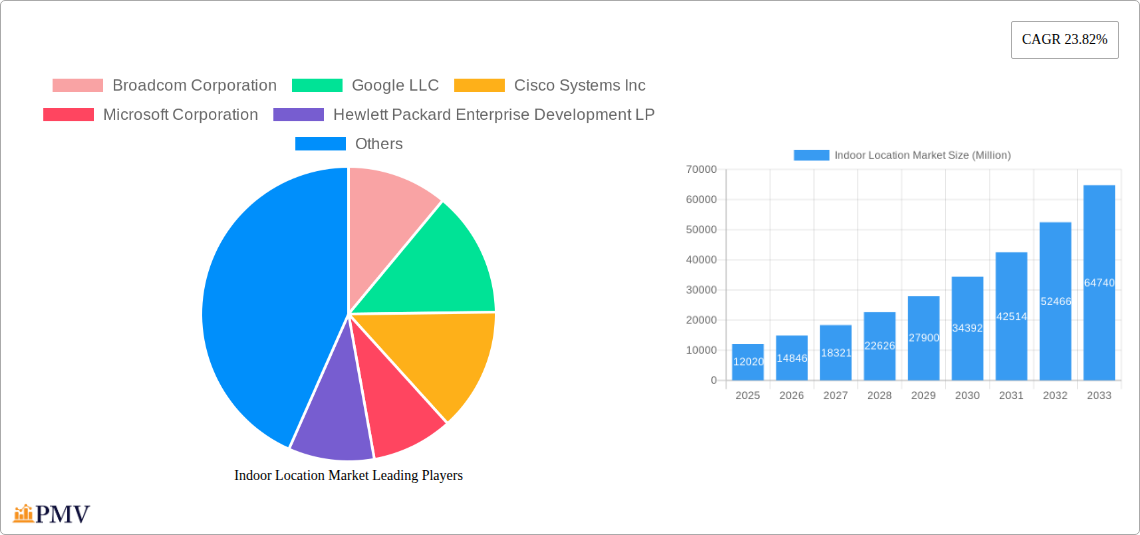
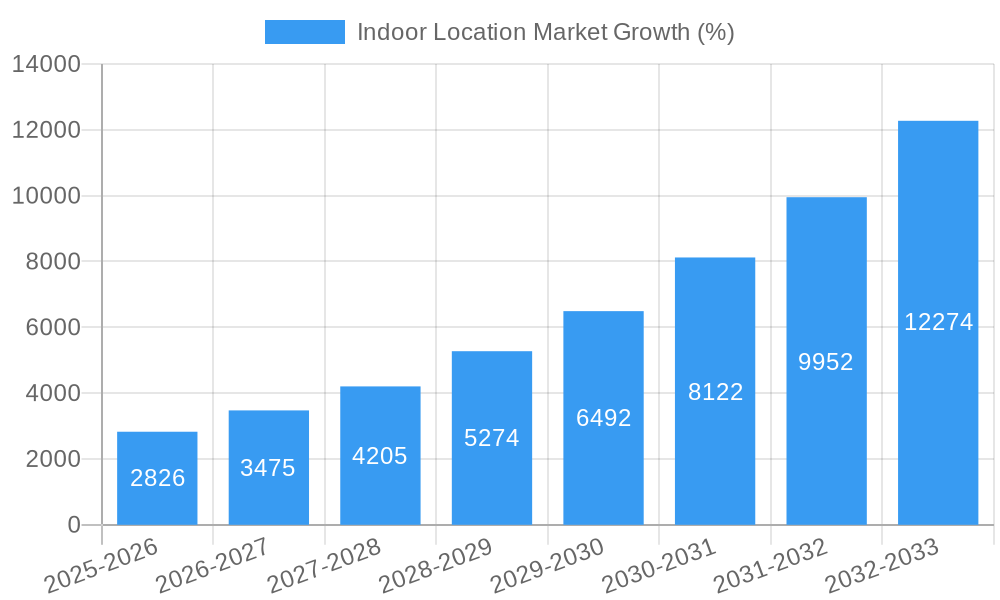
The Indoor Location Market is experiencing robust growth, projected to reach \$12.02 million in 2025 and exhibiting a remarkable Compound Annual Growth Rate (CAGR) of 23.82%. This expansion is fueled by several key drivers. The increasing adoption of smart devices and the Internet of Things (IoT) is creating a surge in demand for precise indoor positioning and tracking solutions across various sectors. Furthermore, the rising need for enhanced safety and security, particularly in high-traffic environments like retail spaces and healthcare facilities, is driving the deployment of indoor location technologies. The growing popularity of location-based services and the need for personalized customer experiences further contribute to market expansion. While initial investment costs can be a restraint, the long-term return on investment (ROI) from improved operational efficiency, enhanced customer engagement, and reduced operational costs is compelling organizations to adopt these solutions. Significant growth is anticipated across all segments, with the solutions segment likely outpacing services due to the increasing sophistication and demand for integrated hardware and software solutions. The healthcare and retail sectors are expected to remain prominent end-users, driven by the potential for improved patient care and enhanced customer experience, respectively.
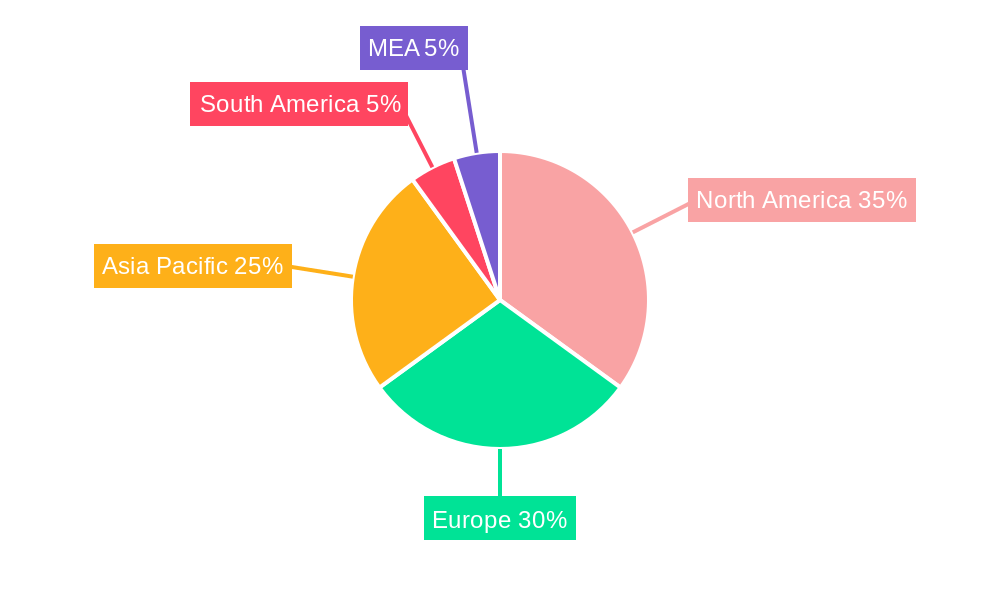
The geographical distribution of the market reveals strong growth across North America and Europe, primarily driven by early adoption and technological advancements in these regions. However, the Asia-Pacific region is projected to witness substantial growth in the coming years, fueled by rapid urbanization and the expansion of the technology sector in countries like China and India. The ongoing development of advanced technologies such as ultra-wideband (UWB), Bluetooth beacons, and Wi-Fi positioning continues to improve accuracy and reliability, making indoor location solutions more attractive to a broader range of industries. Competition in the market is intense, with major players such as Broadcom, Google, and Cisco competing alongside specialized indoor location technology providers. The market's future hinges on ongoing technological innovations that address challenges such as signal interference and cost-effectiveness. A focus on developing user-friendly solutions and integrating them seamlessly into existing infrastructure will prove crucial for sustained market growth.
Indoor Location Market: A Comprehensive Report (2019-2033)
This detailed report provides a comprehensive analysis of the Indoor Location Market, encompassing market size, growth projections, competitive landscape, and key technological advancements. The study period covers 2019-2033, with 2025 serving as the base and estimated year. The forecast period spans 2025-2033, while the historical period encompasses 2019-2024. The market is segmented by component (Solutions, Services), application (Indoor Navigation & Maps, Tracking and Tracing Application, Remote Monitoring and Emergency Management, Other Applications), and end-user industry (Retail, Transportation and Logistics, Healthcare, Telecom, Oil and Gas and Mining, Government and Public Sector, Manufacturing, Other End-user Industries). The market is expected to reach xx Million by 2033, exhibiting a CAGR of xx% during the forecast period.
Indoor Location Market Market Structure & Competitive Dynamics
The Indoor Location Market is characterized by a moderately concentrated structure, with a few dominant players and a significant number of smaller, specialized firms. Market share is currently dominated by Broadcom Corporation, Google LLC, Cisco Systems Inc, and Microsoft Corporation, accounting for approximately xx% of the overall market in 2024. However, the market is witnessing increased competition from emerging players offering innovative solutions. The industry's innovation ecosystem is dynamic, with continuous advancements in technologies like Bluetooth Low Energy (BLE), Ultra-Wideband (UWB), and Wi-Fi positioning. Regulatory frameworks, particularly concerning data privacy and security, significantly impact market growth. Product substitutes, such as GPS for outdoor positioning, exist but are not directly competitive due to the unique requirements of indoor environments. End-user trends show a growing preference for integrated solutions that provide accurate, reliable, and secure location data. M&A activity in the sector has been moderate, with deal values ranging from xx Million to xx Million in recent years, primarily focused on acquiring specialized technologies or expanding market reach. Examples include the partnership between GeoComm and ELi Technology in March 2024.
- High Market Concentration: Top 4 players hold xx% market share.
- Dynamic Innovation: Advancements in BLE, UWB, and Wi-Fi positioning.
- Stringent Regulations: Data privacy and security regulations impact growth.
- Moderate M&A Activity: Deal values range from xx Million to xx Million.
Indoor Location Market Industry Trends & Insights
The Indoor Location Market is experiencing significant growth driven by several factors. The increasing adoption of smartphones and other smart devices equipped with location-sensing capabilities fuels demand for indoor location services. The expanding use of IoT devices in various industries creates further opportunities for indoor location tracking and management. Technological advancements, particularly in AI and machine learning, enable more accurate and efficient indoor positioning systems. This trend is further boosted by growing consumer preference for personalized experiences and seamless indoor navigation. The market's competitive landscape is characterized by both intense rivalry among established players and the emergence of innovative startups. The market penetration rate for indoor location technologies varies across different end-user industries, with retail and healthcare sectors showing the highest adoption. The market is expected to witness a CAGR of xx% during the forecast period, driven by growing demand for enhanced security and safety, improved operational efficiency, and personalized customer experiences. The increasing adoption of cloud-based solutions and the rising demand for real-time location tracking are further contributing to the market's growth.
Dominant Markets & Segments in Indoor Location Market
The North American region currently dominates the Indoor Location Market, driven by high technology adoption, robust infrastructure development, and significant investment in smart city initiatives. Within the segments:
- By Component: The Solutions segment holds the largest market share, fueled by the increasing demand for advanced indoor positioning systems and location-based services.
- By Application: Indoor Navigation & Maps segment leads, driven by the increasing demand for seamless indoor navigation in retail, healthcare, and transportation sectors.
- By End-user Industry: The Retail sector is currently the leading end-user segment due to its high adoption rate of indoor location-based technologies for enhanced customer experience and improved operational efficiency.
Key Drivers for Dominance:
- North America: High technology adoption, advanced infrastructure.
- Solutions Segment: Demand for advanced positioning systems.
- Indoor Navigation & Maps Application: Retail, healthcare, and transportation sector adoption.
- Retail End-user Industry: Focus on customer experience & efficiency.
Indoor Location Market Product Innovations
Recent innovations in the Indoor Location Market include the development of more accurate and energy-efficient positioning technologies, such as UWB and AI-powered solutions for seamless indoor/outdoor location tracking. These advancements offer improved accuracy, reduced latency, and enhanced security, making indoor location systems more reliable and user-friendly. The integration of indoor location technologies with other systems, such as building management systems and security systems, provides a more comprehensive and efficient solution. The market is witnessing a growing trend towards cloud-based indoor location platforms, which offer scalability, flexibility, and reduced infrastructure costs.
Report Segmentation & Scope
The report segments the Indoor Location Market by component (Solutions and Services), application (Indoor Navigation & Maps, Tracking and Tracing Application, Remote Monitoring and Emergency Management, Other Applications), and end-user industry (Retail, Transportation and Logistics, Healthcare, Telecom, Oil and Gas and Mining, Government and Public Sector, Manufacturing, Other End-user Industries). Each segment's growth is projected based on factors like technological advancements, regulatory changes, and market demand. Competitive dynamics vary across segments, with some experiencing intense competition and others exhibiting relatively less rivalry. Market sizes for each segment are detailed within the report, providing a comprehensive view of the market's structure and growth potential.
Key Drivers of Indoor Location Market Growth
Several key factors drive the growth of the Indoor Location Market. Technological advancements in positioning technologies, such as UWB and BLE, provide more accurate and reliable indoor location data. The growing demand for improved security and safety in various settings, from shopping malls to hospitals, fuels the adoption of indoor location systems. Economic factors, including increasing disposable incomes and greater investment in infrastructure projects, also contribute to market expansion. Furthermore, supportive government regulations and initiatives promoting smart city developments are creating favorable conditions for market growth.
Challenges in the Indoor Location Market Sector
Despite its growth potential, the Indoor Location Market faces several challenges. High initial investment costs for implementing indoor positioning systems can be a barrier to entry for smaller businesses. Interoperability issues between different indoor location technologies can create integration challenges. Concerns about data privacy and security also pose a significant challenge, especially in sensitive environments like healthcare and government sectors. These challenges, if not addressed effectively, could potentially impede the market's overall growth rate.
Leading Players in the Indoor Location Market Market
- Broadcom Corporation
- Google LLC
- Cisco Systems Inc
- Microsoft Corporation
- Hewlett Packard Enterprise Development LP
- Inpixon
- HID Global Corporation
- Sonitor Technologies AS
- Acuity Brands Inc
- AiRISTA
- Mist Systems Inc
- Zebra Technologies Corporation
- Ubisense Limited
- CenTrak
- HERE Global BV
- Tack On
Key Developments in Indoor Location Market Sector
- October 2023: Sensative and Combain announced a strategic collaboration for AI-powered indoor/outdoor location solutions. This partnership significantly impacts market dynamics by introducing advanced AI capabilities for seamless geolocation.
- March 2024: GeoComm and ELi Technology partnered to enhance school safety with the ATLS Location Service, improving indoor location mapping via Wi-Fi. This development highlights the increasing focus on safety applications within the market.
Strategic Indoor Location Market Market Outlook
The Indoor Location Market exhibits substantial growth potential driven by ongoing technological advancements, the expanding Internet of Things (IoT), and increasing demand for improved security and efficiency across various sectors. Strategic opportunities lie in developing innovative solutions that address specific industry needs, such as real-time asset tracking in logistics or personalized wayfinding in retail environments. Further expansion is anticipated through collaborations and partnerships between technology providers and end-user industries, fostering the development of integrated and comprehensive indoor location solutions.
Indoor Location Market Segmentation
-
1. Component
- 1.1. Solutions
- 1.2. Services
-
2. Application
- 2.1. Indoor Navigation & Maps
- 2.2. Tracking and Tracing Application
- 2.3. Remote Monitoring and Emergency Management
- 2.4. Other Applications
-
3. End-user Industry
- 3.1. Retail
- 3.2. Transportation and Logistics
- 3.3. Healthcare
- 3.4. Telecom
- 3.5. Oil and Gas and Mining
- 3.6. Government and Public Sector
- 3.7. Manufacturing
- 3.8. Other End-user Industries
Indoor Location Market Segmentation By Geography
- 1. North America
- 2. Europe
- 3. Asia
- 4. Australia and New Zealand
- 5. Latin America
- 6. Middle East and Africa
Indoor Location Market REPORT HIGHLIGHTS
| Aspects | Details |
|---|---|
| Study Period | 2019-2033 |
| Base Year | 2024 |
| Estimated Year | 2025 |
| Forecast Period | 2025-2033 |
| Historical Period | 2019-2024 |
| Growth Rate | CAGR of 23.82% from 2019-2033 |
| Segmentation |
|
Table of Contents
- 1. Introduction
- 1.1. Research Scope
- 1.2. Market Segmentation
- 1.3. Research Methodology
- 1.4. Definitions and Assumptions
- 2. Executive Summary
- 2.1. Introduction
- 3. Market Dynamics
- 3.1. Introduction
- 3.2. Market Drivers
- 3.2.1 Growing Number of Applications Powered by Beacons and BLE Tags; Inefficiency of the GPS Technology in Indoor Premises; Growth of Connected Devices
- 3.2.2 Smartphones
- 3.2.3 and Location-based Applications
- 3.3. Market Restrains
- 3.3.1. Data and security related Issues; Deployment and Maintenance Challenges; Strict Rules and Regulations by Government
- 3.4. Market Trends
- 3.4.1. Transportation and Logistics Vertical to Hold a Dominant Market Share
- 4. Market Factor Analysis
- 4.1. Porters Five Forces
- 4.2. Supply/Value Chain
- 4.3. PESTEL analysis
- 4.4. Market Entropy
- 4.5. Patent/Trademark Analysis
- 5. Global Indoor Location Market Analysis, Insights and Forecast, 2019-2031
- 5.1. Market Analysis, Insights and Forecast - by Component
- 5.1.1. Solutions
- 5.1.2. Services
- 5.2. Market Analysis, Insights and Forecast - by Application
- 5.2.1. Indoor Navigation & Maps
- 5.2.2. Tracking and Tracing Application
- 5.2.3. Remote Monitoring and Emergency Management
- 5.2.4. Other Applications
- 5.3. Market Analysis, Insights and Forecast - by End-user Industry
- 5.3.1. Retail
- 5.3.2. Transportation and Logistics
- 5.3.3. Healthcare
- 5.3.4. Telecom
- 5.3.5. Oil and Gas and Mining
- 5.3.6. Government and Public Sector
- 5.3.7. Manufacturing
- 5.3.8. Other End-user Industries
- 5.4. Market Analysis, Insights and Forecast - by Region
- 5.4.1. North America
- 5.4.2. Europe
- 5.4.3. Asia
- 5.4.4. Australia and New Zealand
- 5.4.5. Latin America
- 5.4.6. Middle East and Africa
- 5.1. Market Analysis, Insights and Forecast - by Component
- 6. North America Indoor Location Market Analysis, Insights and Forecast, 2019-2031
- 6.1. Market Analysis, Insights and Forecast - by Component
- 6.1.1. Solutions
- 6.1.2. Services
- 6.2. Market Analysis, Insights and Forecast - by Application
- 6.2.1. Indoor Navigation & Maps
- 6.2.2. Tracking and Tracing Application
- 6.2.3. Remote Monitoring and Emergency Management
- 6.2.4. Other Applications
- 6.3. Market Analysis, Insights and Forecast - by End-user Industry
- 6.3.1. Retail
- 6.3.2. Transportation and Logistics
- 6.3.3. Healthcare
- 6.3.4. Telecom
- 6.3.5. Oil and Gas and Mining
- 6.3.6. Government and Public Sector
- 6.3.7. Manufacturing
- 6.3.8. Other End-user Industries
- 6.1. Market Analysis, Insights and Forecast - by Component
- 7. Europe Indoor Location Market Analysis, Insights and Forecast, 2019-2031
- 7.1. Market Analysis, Insights and Forecast - by Component
- 7.1.1. Solutions
- 7.1.2. Services
- 7.2. Market Analysis, Insights and Forecast - by Application
- 7.2.1. Indoor Navigation & Maps
- 7.2.2. Tracking and Tracing Application
- 7.2.3. Remote Monitoring and Emergency Management
- 7.2.4. Other Applications
- 7.3. Market Analysis, Insights and Forecast - by End-user Industry
- 7.3.1. Retail
- 7.3.2. Transportation and Logistics
- 7.3.3. Healthcare
- 7.3.4. Telecom
- 7.3.5. Oil and Gas and Mining
- 7.3.6. Government and Public Sector
- 7.3.7. Manufacturing
- 7.3.8. Other End-user Industries
- 7.1. Market Analysis, Insights and Forecast - by Component
- 8. Asia Indoor Location Market Analysis, Insights and Forecast, 2019-2031
- 8.1. Market Analysis, Insights and Forecast - by Component
- 8.1.1. Solutions
- 8.1.2. Services
- 8.2. Market Analysis, Insights and Forecast - by Application
- 8.2.1. Indoor Navigation & Maps
- 8.2.2. Tracking and Tracing Application
- 8.2.3. Remote Monitoring and Emergency Management
- 8.2.4. Other Applications
- 8.3. Market Analysis, Insights and Forecast - by End-user Industry
- 8.3.1. Retail
- 8.3.2. Transportation and Logistics
- 8.3.3. Healthcare
- 8.3.4. Telecom
- 8.3.5. Oil and Gas and Mining
- 8.3.6. Government and Public Sector
- 8.3.7. Manufacturing
- 8.3.8. Other End-user Industries
- 8.1. Market Analysis, Insights and Forecast - by Component
- 9. Australia and New Zealand Indoor Location Market Analysis, Insights and Forecast, 2019-2031
- 9.1. Market Analysis, Insights and Forecast - by Component
- 9.1.1. Solutions
- 9.1.2. Services
- 9.2. Market Analysis, Insights and Forecast - by Application
- 9.2.1. Indoor Navigation & Maps
- 9.2.2. Tracking and Tracing Application
- 9.2.3. Remote Monitoring and Emergency Management
- 9.2.4. Other Applications
- 9.3. Market Analysis, Insights and Forecast - by End-user Industry
- 9.3.1. Retail
- 9.3.2. Transportation and Logistics
- 9.3.3. Healthcare
- 9.3.4. Telecom
- 9.3.5. Oil and Gas and Mining
- 9.3.6. Government and Public Sector
- 9.3.7. Manufacturing
- 9.3.8. Other End-user Industries
- 9.1. Market Analysis, Insights and Forecast - by Component
- 10. Latin America Indoor Location Market Analysis, Insights and Forecast, 2019-2031
- 10.1. Market Analysis, Insights and Forecast - by Component
- 10.1.1. Solutions
- 10.1.2. Services
- 10.2. Market Analysis, Insights and Forecast - by Application
- 10.2.1. Indoor Navigation & Maps
- 10.2.2. Tracking and Tracing Application
- 10.2.3. Remote Monitoring and Emergency Management
- 10.2.4. Other Applications
- 10.3. Market Analysis, Insights and Forecast - by End-user Industry
- 10.3.1. Retail
- 10.3.2. Transportation and Logistics
- 10.3.3. Healthcare
- 10.3.4. Telecom
- 10.3.5. Oil and Gas and Mining
- 10.3.6. Government and Public Sector
- 10.3.7. Manufacturing
- 10.3.8. Other End-user Industries
- 10.1. Market Analysis, Insights and Forecast - by Component
- 11. Middle East and Africa Indoor Location Market Analysis, Insights and Forecast, 2019-2031
- 11.1. Market Analysis, Insights and Forecast - by Component
- 11.1.1. Solutions
- 11.1.2. Services
- 11.2. Market Analysis, Insights and Forecast - by Application
- 11.2.1. Indoor Navigation & Maps
- 11.2.2. Tracking and Tracing Application
- 11.2.3. Remote Monitoring and Emergency Management
- 11.2.4. Other Applications
- 11.3. Market Analysis, Insights and Forecast - by End-user Industry
- 11.3.1. Retail
- 11.3.2. Transportation and Logistics
- 11.3.3. Healthcare
- 11.3.4. Telecom
- 11.3.5. Oil and Gas and Mining
- 11.3.6. Government and Public Sector
- 11.3.7. Manufacturing
- 11.3.8. Other End-user Industries
- 11.1. Market Analysis, Insights and Forecast - by Component
- 12. North America Indoor Location Market Analysis, Insights and Forecast, 2019-2031
- 12.1. Market Analysis, Insights and Forecast - By Country/Sub-region
- 12.1.1 United States
- 12.1.2 Canada
- 12.1.3 Mexico
- 13. Europe Indoor Location Market Analysis, Insights and Forecast, 2019-2031
- 13.1. Market Analysis, Insights and Forecast - By Country/Sub-region
- 13.1.1 Germany
- 13.1.2 United Kingdom
- 13.1.3 France
- 13.1.4 Spain
- 13.1.5 Italy
- 13.1.6 Spain
- 13.1.7 Belgium
- 13.1.8 Netherland
- 13.1.9 Nordics
- 13.1.10 Rest of Europe
- 14. Asia Pacific Indoor Location Market Analysis, Insights and Forecast, 2019-2031
- 14.1. Market Analysis, Insights and Forecast - By Country/Sub-region
- 14.1.1 China
- 14.1.2 Japan
- 14.1.3 India
- 14.1.4 South Korea
- 14.1.5 Southeast Asia
- 14.1.6 Australia
- 14.1.7 Indonesia
- 14.1.8 Phillipes
- 14.1.9 Singapore
- 14.1.10 Thailandc
- 14.1.11 Rest of Asia Pacific
- 15. South America Indoor Location Market Analysis, Insights and Forecast, 2019-2031
- 15.1. Market Analysis, Insights and Forecast - By Country/Sub-region
- 15.1.1 Brazil
- 15.1.2 Argentina
- 15.1.3 Peru
- 15.1.4 Chile
- 15.1.5 Colombia
- 15.1.6 Ecuador
- 15.1.7 Venezuela
- 15.1.8 Rest of South America
- 16. North America Indoor Location Market Analysis, Insights and Forecast, 2019-2031
- 16.1. Market Analysis, Insights and Forecast - By Country/Sub-region
- 16.1.1 United States
- 16.1.2 Canada
- 16.1.3 Mexico
- 17. MEA Indoor Location Market Analysis, Insights and Forecast, 2019-2031
- 17.1. Market Analysis, Insights and Forecast - By Country/Sub-region
- 17.1.1 United Arab Emirates
- 17.1.2 Saudi Arabia
- 17.1.3 South Africa
- 17.1.4 Rest of Middle East and Africa
- 18. Competitive Analysis
- 18.1. Global Market Share Analysis 2024
- 18.2. Company Profiles
- 18.2.1 Broadcom Corporation
- 18.2.1.1. Overview
- 18.2.1.2. Products
- 18.2.1.3. SWOT Analysis
- 18.2.1.4. Recent Developments
- 18.2.1.5. Financials (Based on Availability)
- 18.2.2 Google LLC
- 18.2.2.1. Overview
- 18.2.2.2. Products
- 18.2.2.3. SWOT Analysis
- 18.2.2.4. Recent Developments
- 18.2.2.5. Financials (Based on Availability)
- 18.2.3 Cisco Systems Inc
- 18.2.3.1. Overview
- 18.2.3.2. Products
- 18.2.3.3. SWOT Analysis
- 18.2.3.4. Recent Developments
- 18.2.3.5. Financials (Based on Availability)
- 18.2.4 Microsoft Corporation
- 18.2.4.1. Overview
- 18.2.4.2. Products
- 18.2.4.3. SWOT Analysis
- 18.2.4.4. Recent Developments
- 18.2.4.5. Financials (Based on Availability)
- 18.2.5 Hewlett Packard Enterprise Development LP
- 18.2.5.1. Overview
- 18.2.5.2. Products
- 18.2.5.3. SWOT Analysis
- 18.2.5.4. Recent Developments
- 18.2.5.5. Financials (Based on Availability)
- 18.2.6 Inpixon
- 18.2.6.1. Overview
- 18.2.6.2. Products
- 18.2.6.3. SWOT Analysis
- 18.2.6.4. Recent Developments
- 18.2.6.5. Financials (Based on Availability)
- 18.2.7 HID Global Corporation
- 18.2.7.1. Overview
- 18.2.7.2. Products
- 18.2.7.3. SWOT Analysis
- 18.2.7.4. Recent Developments
- 18.2.7.5. Financials (Based on Availability)
- 18.2.8 Sonitor Technologies AS
- 18.2.8.1. Overview
- 18.2.8.2. Products
- 18.2.8.3. SWOT Analysis
- 18.2.8.4. Recent Developments
- 18.2.8.5. Financials (Based on Availability)
- 18.2.9 Acuity Brands Inc
- 18.2.9.1. Overview
- 18.2.9.2. Products
- 18.2.9.3. SWOT Analysis
- 18.2.9.4. Recent Developments
- 18.2.9.5. Financials (Based on Availability)
- 18.2.10 AiRISTA
- 18.2.10.1. Overview
- 18.2.10.2. Products
- 18.2.10.3. SWOT Analysis
- 18.2.10.4. Recent Developments
- 18.2.10.5. Financials (Based on Availability)
- 18.2.11 Mist Systems Inc
- 18.2.11.1. Overview
- 18.2.11.2. Products
- 18.2.11.3. SWOT Analysis
- 18.2.11.4. Recent Developments
- 18.2.11.5. Financials (Based on Availability)
- 18.2.12 Zebra Technologies Corporation
- 18.2.12.1. Overview
- 18.2.12.2. Products
- 18.2.12.3. SWOT Analysis
- 18.2.12.4. Recent Developments
- 18.2.12.5. Financials (Based on Availability)
- 18.2.13 Ubisense Limited
- 18.2.13.1. Overview
- 18.2.13.2. Products
- 18.2.13.3. SWOT Analysis
- 18.2.13.4. Recent Developments
- 18.2.13.5. Financials (Based on Availability)
- 18.2.14 CenTrak
- 18.2.14.1. Overview
- 18.2.14.2. Products
- 18.2.14.3. SWOT Analysis
- 18.2.14.4. Recent Developments
- 18.2.14.5. Financials (Based on Availability)
- 18.2.15 HERE Global BV
- 18.2.15.1. Overview
- 18.2.15.2. Products
- 18.2.15.3. SWOT Analysis
- 18.2.15.4. Recent Developments
- 18.2.15.5. Financials (Based on Availability)
- 18.2.16 Tack On
- 18.2.16.1. Overview
- 18.2.16.2. Products
- 18.2.16.3. SWOT Analysis
- 18.2.16.4. Recent Developments
- 18.2.16.5. Financials (Based on Availability)
- 18.2.1 Broadcom Corporation
List of Figures
- Figure 1: Global Indoor Location Market Revenue Breakdown (Million, %) by Region 2024 & 2032
- Figure 2: North America Indoor Location Market Revenue (Million), by Country 2024 & 2032
- Figure 3: North America Indoor Location Market Revenue Share (%), by Country 2024 & 2032
- Figure 4: Europe Indoor Location Market Revenue (Million), by Country 2024 & 2032
- Figure 5: Europe Indoor Location Market Revenue Share (%), by Country 2024 & 2032
- Figure 6: Asia Pacific Indoor Location Market Revenue (Million), by Country 2024 & 2032
- Figure 7: Asia Pacific Indoor Location Market Revenue Share (%), by Country 2024 & 2032
- Figure 8: South America Indoor Location Market Revenue (Million), by Country 2024 & 2032
- Figure 9: South America Indoor Location Market Revenue Share (%), by Country 2024 & 2032
- Figure 10: North America Indoor Location Market Revenue (Million), by Country 2024 & 2032
- Figure 11: North America Indoor Location Market Revenue Share (%), by Country 2024 & 2032
- Figure 12: MEA Indoor Location Market Revenue (Million), by Country 2024 & 2032
- Figure 13: MEA Indoor Location Market Revenue Share (%), by Country 2024 & 2032
- Figure 14: North America Indoor Location Market Revenue (Million), by Component 2024 & 2032
- Figure 15: North America Indoor Location Market Revenue Share (%), by Component 2024 & 2032
- Figure 16: North America Indoor Location Market Revenue (Million), by Application 2024 & 2032
- Figure 17: North America Indoor Location Market Revenue Share (%), by Application 2024 & 2032
- Figure 18: North America Indoor Location Market Revenue (Million), by End-user Industry 2024 & 2032
- Figure 19: North America Indoor Location Market Revenue Share (%), by End-user Industry 2024 & 2032
- Figure 20: North America Indoor Location Market Revenue (Million), by Country 2024 & 2032
- Figure 21: North America Indoor Location Market Revenue Share (%), by Country 2024 & 2032
- Figure 22: Europe Indoor Location Market Revenue (Million), by Component 2024 & 2032
- Figure 23: Europe Indoor Location Market Revenue Share (%), by Component 2024 & 2032
- Figure 24: Europe Indoor Location Market Revenue (Million), by Application 2024 & 2032
- Figure 25: Europe Indoor Location Market Revenue Share (%), by Application 2024 & 2032
- Figure 26: Europe Indoor Location Market Revenue (Million), by End-user Industry 2024 & 2032
- Figure 27: Europe Indoor Location Market Revenue Share (%), by End-user Industry 2024 & 2032
- Figure 28: Europe Indoor Location Market Revenue (Million), by Country 2024 & 2032
- Figure 29: Europe Indoor Location Market Revenue Share (%), by Country 2024 & 2032
- Figure 30: Asia Indoor Location Market Revenue (Million), by Component 2024 & 2032
- Figure 31: Asia Indoor Location Market Revenue Share (%), by Component 2024 & 2032
- Figure 32: Asia Indoor Location Market Revenue (Million), by Application 2024 & 2032
- Figure 33: Asia Indoor Location Market Revenue Share (%), by Application 2024 & 2032
- Figure 34: Asia Indoor Location Market Revenue (Million), by End-user Industry 2024 & 2032
- Figure 35: Asia Indoor Location Market Revenue Share (%), by End-user Industry 2024 & 2032
- Figure 36: Asia Indoor Location Market Revenue (Million), by Country 2024 & 2032
- Figure 37: Asia Indoor Location Market Revenue Share (%), by Country 2024 & 2032
- Figure 38: Australia and New Zealand Indoor Location Market Revenue (Million), by Component 2024 & 2032
- Figure 39: Australia and New Zealand Indoor Location Market Revenue Share (%), by Component 2024 & 2032
- Figure 40: Australia and New Zealand Indoor Location Market Revenue (Million), by Application 2024 & 2032
- Figure 41: Australia and New Zealand Indoor Location Market Revenue Share (%), by Application 2024 & 2032
- Figure 42: Australia and New Zealand Indoor Location Market Revenue (Million), by End-user Industry 2024 & 2032
- Figure 43: Australia and New Zealand Indoor Location Market Revenue Share (%), by End-user Industry 2024 & 2032
- Figure 44: Australia and New Zealand Indoor Location Market Revenue (Million), by Country 2024 & 2032
- Figure 45: Australia and New Zealand Indoor Location Market Revenue Share (%), by Country 2024 & 2032
- Figure 46: Latin America Indoor Location Market Revenue (Million), by Component 2024 & 2032
- Figure 47: Latin America Indoor Location Market Revenue Share (%), by Component 2024 & 2032
- Figure 48: Latin America Indoor Location Market Revenue (Million), by Application 2024 & 2032
- Figure 49: Latin America Indoor Location Market Revenue Share (%), by Application 2024 & 2032
- Figure 50: Latin America Indoor Location Market Revenue (Million), by End-user Industry 2024 & 2032
- Figure 51: Latin America Indoor Location Market Revenue Share (%), by End-user Industry 2024 & 2032
- Figure 52: Latin America Indoor Location Market Revenue (Million), by Country 2024 & 2032
- Figure 53: Latin America Indoor Location Market Revenue Share (%), by Country 2024 & 2032
- Figure 54: Middle East and Africa Indoor Location Market Revenue (Million), by Component 2024 & 2032
- Figure 55: Middle East and Africa Indoor Location Market Revenue Share (%), by Component 2024 & 2032
- Figure 56: Middle East and Africa Indoor Location Market Revenue (Million), by Application 2024 & 2032
- Figure 57: Middle East and Africa Indoor Location Market Revenue Share (%), by Application 2024 & 2032
- Figure 58: Middle East and Africa Indoor Location Market Revenue (Million), by End-user Industry 2024 & 2032
- Figure 59: Middle East and Africa Indoor Location Market Revenue Share (%), by End-user Industry 2024 & 2032
- Figure 60: Middle East and Africa Indoor Location Market Revenue (Million), by Country 2024 & 2032
- Figure 61: Middle East and Africa Indoor Location Market Revenue Share (%), by Country 2024 & 2032
List of Tables
- Table 1: Global Indoor Location Market Revenue Million Forecast, by Region 2019 & 2032
- Table 2: Global Indoor Location Market Revenue Million Forecast, by Component 2019 & 2032
- Table 3: Global Indoor Location Market Revenue Million Forecast, by Application 2019 & 2032
- Table 4: Global Indoor Location Market Revenue Million Forecast, by End-user Industry 2019 & 2032
- Table 5: Global Indoor Location Market Revenue Million Forecast, by Region 2019 & 2032
- Table 6: Global Indoor Location Market Revenue Million Forecast, by Country 2019 & 2032
- Table 7: United States Indoor Location Market Revenue (Million) Forecast, by Application 2019 & 2032
- Table 8: Canada Indoor Location Market Revenue (Million) Forecast, by Application 2019 & 2032
- Table 9: Mexico Indoor Location Market Revenue (Million) Forecast, by Application 2019 & 2032
- Table 10: Global Indoor Location Market Revenue Million Forecast, by Country 2019 & 2032
- Table 11: Germany Indoor Location Market Revenue (Million) Forecast, by Application 2019 & 2032
- Table 12: United Kingdom Indoor Location Market Revenue (Million) Forecast, by Application 2019 & 2032
- Table 13: France Indoor Location Market Revenue (Million) Forecast, by Application 2019 & 2032
- Table 14: Spain Indoor Location Market Revenue (Million) Forecast, by Application 2019 & 2032
- Table 15: Italy Indoor Location Market Revenue (Million) Forecast, by Application 2019 & 2032
- Table 16: Spain Indoor Location Market Revenue (Million) Forecast, by Application 2019 & 2032
- Table 17: Belgium Indoor Location Market Revenue (Million) Forecast, by Application 2019 & 2032
- Table 18: Netherland Indoor Location Market Revenue (Million) Forecast, by Application 2019 & 2032
- Table 19: Nordics Indoor Location Market Revenue (Million) Forecast, by Application 2019 & 2032
- Table 20: Rest of Europe Indoor Location Market Revenue (Million) Forecast, by Application 2019 & 2032
- Table 21: Global Indoor Location Market Revenue Million Forecast, by Country 2019 & 2032
- Table 22: China Indoor Location Market Revenue (Million) Forecast, by Application 2019 & 2032
- Table 23: Japan Indoor Location Market Revenue (Million) Forecast, by Application 2019 & 2032
- Table 24: India Indoor Location Market Revenue (Million) Forecast, by Application 2019 & 2032
- Table 25: South Korea Indoor Location Market Revenue (Million) Forecast, by Application 2019 & 2032
- Table 26: Southeast Asia Indoor Location Market Revenue (Million) Forecast, by Application 2019 & 2032
- Table 27: Australia Indoor Location Market Revenue (Million) Forecast, by Application 2019 & 2032
- Table 28: Indonesia Indoor Location Market Revenue (Million) Forecast, by Application 2019 & 2032
- Table 29: Phillipes Indoor Location Market Revenue (Million) Forecast, by Application 2019 & 2032
- Table 30: Singapore Indoor Location Market Revenue (Million) Forecast, by Application 2019 & 2032
- Table 31: Thailandc Indoor Location Market Revenue (Million) Forecast, by Application 2019 & 2032
- Table 32: Rest of Asia Pacific Indoor Location Market Revenue (Million) Forecast, by Application 2019 & 2032
- Table 33: Global Indoor Location Market Revenue Million Forecast, by Country 2019 & 2032
- Table 34: Brazil Indoor Location Market Revenue (Million) Forecast, by Application 2019 & 2032
- Table 35: Argentina Indoor Location Market Revenue (Million) Forecast, by Application 2019 & 2032
- Table 36: Peru Indoor Location Market Revenue (Million) Forecast, by Application 2019 & 2032
- Table 37: Chile Indoor Location Market Revenue (Million) Forecast, by Application 2019 & 2032
- Table 38: Colombia Indoor Location Market Revenue (Million) Forecast, by Application 2019 & 2032
- Table 39: Ecuador Indoor Location Market Revenue (Million) Forecast, by Application 2019 & 2032
- Table 40: Venezuela Indoor Location Market Revenue (Million) Forecast, by Application 2019 & 2032
- Table 41: Rest of South America Indoor Location Market Revenue (Million) Forecast, by Application 2019 & 2032
- Table 42: Global Indoor Location Market Revenue Million Forecast, by Country 2019 & 2032
- Table 43: United States Indoor Location Market Revenue (Million) Forecast, by Application 2019 & 2032
- Table 44: Canada Indoor Location Market Revenue (Million) Forecast, by Application 2019 & 2032
- Table 45: Mexico Indoor Location Market Revenue (Million) Forecast, by Application 2019 & 2032
- Table 46: Global Indoor Location Market Revenue Million Forecast, by Country 2019 & 2032
- Table 47: United Arab Emirates Indoor Location Market Revenue (Million) Forecast, by Application 2019 & 2032
- Table 48: Saudi Arabia Indoor Location Market Revenue (Million) Forecast, by Application 2019 & 2032
- Table 49: South Africa Indoor Location Market Revenue (Million) Forecast, by Application 2019 & 2032
- Table 50: Rest of Middle East and Africa Indoor Location Market Revenue (Million) Forecast, by Application 2019 & 2032
- Table 51: Global Indoor Location Market Revenue Million Forecast, by Component 2019 & 2032
- Table 52: Global Indoor Location Market Revenue Million Forecast, by Application 2019 & 2032
- Table 53: Global Indoor Location Market Revenue Million Forecast, by End-user Industry 2019 & 2032
- Table 54: Global Indoor Location Market Revenue Million Forecast, by Country 2019 & 2032
- Table 55: Global Indoor Location Market Revenue Million Forecast, by Component 2019 & 2032
- Table 56: Global Indoor Location Market Revenue Million Forecast, by Application 2019 & 2032
- Table 57: Global Indoor Location Market Revenue Million Forecast, by End-user Industry 2019 & 2032
- Table 58: Global Indoor Location Market Revenue Million Forecast, by Country 2019 & 2032
- Table 59: Global Indoor Location Market Revenue Million Forecast, by Component 2019 & 2032
- Table 60: Global Indoor Location Market Revenue Million Forecast, by Application 2019 & 2032
- Table 61: Global Indoor Location Market Revenue Million Forecast, by End-user Industry 2019 & 2032
- Table 62: Global Indoor Location Market Revenue Million Forecast, by Country 2019 & 2032
- Table 63: Global Indoor Location Market Revenue Million Forecast, by Component 2019 & 2032
- Table 64: Global Indoor Location Market Revenue Million Forecast, by Application 2019 & 2032
- Table 65: Global Indoor Location Market Revenue Million Forecast, by End-user Industry 2019 & 2032
- Table 66: Global Indoor Location Market Revenue Million Forecast, by Country 2019 & 2032
- Table 67: Global Indoor Location Market Revenue Million Forecast, by Component 2019 & 2032
- Table 68: Global Indoor Location Market Revenue Million Forecast, by Application 2019 & 2032
- Table 69: Global Indoor Location Market Revenue Million Forecast, by End-user Industry 2019 & 2032
- Table 70: Global Indoor Location Market Revenue Million Forecast, by Country 2019 & 2032
- Table 71: Global Indoor Location Market Revenue Million Forecast, by Component 2019 & 2032
- Table 72: Global Indoor Location Market Revenue Million Forecast, by Application 2019 & 2032
- Table 73: Global Indoor Location Market Revenue Million Forecast, by End-user Industry 2019 & 2032
- Table 74: Global Indoor Location Market Revenue Million Forecast, by Country 2019 & 2032
Frequently Asked Questions
1. What is the projected Compound Annual Growth Rate (CAGR) of the Indoor Location Market?
The projected CAGR is approximately 23.82%.
2. Which companies are prominent players in the Indoor Location Market?
Key companies in the market include Broadcom Corporation, Google LLC, Cisco Systems Inc, Microsoft Corporation, Hewlett Packard Enterprise Development LP, Inpixon, HID Global Corporation, Sonitor Technologies AS, Acuity Brands Inc, AiRISTA, Mist Systems Inc, Zebra Technologies Corporation, Ubisense Limited, CenTrak, HERE Global BV, Tack On.
3. What are the main segments of the Indoor Location Market?
The market segments include Component, Application, End-user Industry.
4. Can you provide details about the market size?
The market size is estimated to be USD 12.02 Million as of 2022.
5. What are some drivers contributing to market growth?
Growing Number of Applications Powered by Beacons and BLE Tags; Inefficiency of the GPS Technology in Indoor Premises; Growth of Connected Devices. Smartphones. and Location-based Applications.
6. What are the notable trends driving market growth?
Transportation and Logistics Vertical to Hold a Dominant Market Share.
7. Are there any restraints impacting market growth?
Data and security related Issues; Deployment and Maintenance Challenges; Strict Rules and Regulations by Government.
8. Can you provide examples of recent developments in the market?
March 2024: GeoComm and ELi Technology announced their partnership, which aims at enhancing school safety with the ATLS Location Service, where ATLS is an innovative, easily integrated location and mapping service, combining ELi Technology's patented EML with GeoComm's technology, enabling accurate indoor location mapping via Wi-Fi access points.
9. What pricing options are available for accessing the report?
Pricing options include single-user, multi-user, and enterprise licenses priced at USD 4750, USD 5250, and USD 8750 respectively.
10. Is the market size provided in terms of value or volume?
The market size is provided in terms of value, measured in Million.
11. Are there any specific market keywords associated with the report?
Yes, the market keyword associated with the report is "Indoor Location Market," which aids in identifying and referencing the specific market segment covered.
12. How do I determine which pricing option suits my needs best?
The pricing options vary based on user requirements and access needs. Individual users may opt for single-user licenses, while businesses requiring broader access may choose multi-user or enterprise licenses for cost-effective access to the report.
13. Are there any additional resources or data provided in the Indoor Location Market report?
While the report offers comprehensive insights, it's advisable to review the specific contents or supplementary materials provided to ascertain if additional resources or data are available.
14. How can I stay updated on further developments or reports in the Indoor Location Market?
To stay informed about further developments, trends, and reports in the Indoor Location Market, consider subscribing to industry newsletters, following relevant companies and organizations, or regularly checking reputable industry news sources and publications.
Methodology
Step 1 - Identification of Relevant Samples Size from Population Database


Step 2 - Approaches for Defining Global Market Size (Value, Volume* & Price*)

Note*: In applicable scenarios
Step 3 - Data Sources
Primary Research
- Web Analytics
- Survey Reports
- Research Institute
- Latest Research Reports
- Opinion Leaders
Secondary Research
- Annual Reports
- White Paper
- Latest Press Release
- Industry Association
- Paid Database
- Investor Presentations

Step 4 - Data Triangulation
Involves using different sources of information in order to increase the validity of a study
These sources are likely to be stakeholders in a program - participants, other researchers, program staff, other community members, and so on.
Then we put all data in single framework & apply various statistical tools to find out the dynamic on the market.
During the analysis stage, feedback from the stakeholder groups would be compared to determine areas of agreement as well as areas of divergence


