

Key Insights
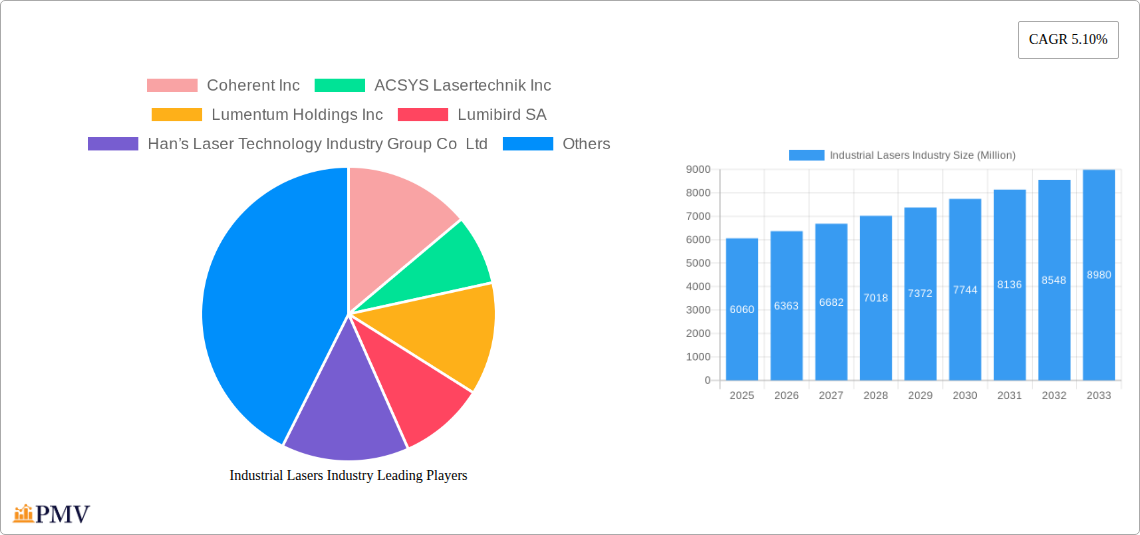
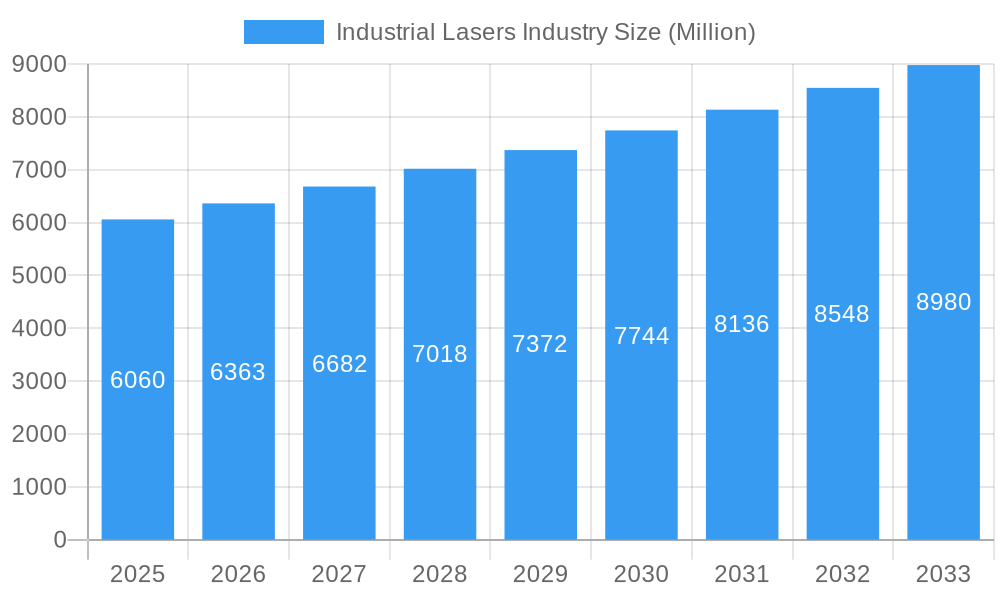
The industrial lasers market, valued at $6.06 billion in 2025, is projected to experience robust growth, driven by increasing automation across diverse sectors and the rising adoption of advanced laser technologies. A compound annual growth rate (CAGR) of 5.10% from 2025 to 2033 indicates a significant expansion, reaching an estimated market value exceeding $9.5 billion by 2033. Key drivers include the increasing demand for precision cutting, welding, and marking in automotive manufacturing, the growing adoption of laser-based additive manufacturing (3D printing) in aerospace and defense, and the expanding use of lasers in medical device production and microelectronics. Fiber lasers are currently dominating the market due to their high efficiency and versatility, while the adoption of solid-state lasers is also witnessing significant growth owing to their precision and power capabilities. However, the market faces some restraints, including the high initial investment costs associated with laser systems and the need for skilled personnel for operation and maintenance. Growth is anticipated to be particularly strong in the Asia-Pacific region, fueled by rapid industrialization and substantial investments in advanced manufacturing technologies.
Industrial Lasers Industry Market Size (In Billion)
The segmentation analysis reveals that cutting and welding applications constitute a significant portion of the market demand, closely followed by marking and drilling. The automotive, aerospace & defense, and healthcare sectors are major end-users, reflecting the pivotal role of lasers in enhancing manufacturing processes and improving product quality. Leading players such as Coherent Inc., IPG Photonics, and Trumpf Group are strategically investing in research and development to maintain their competitive edge and meet the growing market demands. Future growth will depend on continuous technological innovation, the development of more efficient and cost-effective laser systems, and the expansion of applications into new sectors, such as renewable energy and consumer electronics. Furthermore, increased collaboration between laser manufacturers and end-users to address specific industry needs will be crucial in shaping the market's trajectory.
Industrial Lasers Industry Company Market Share
Industrial Lasers Industry Market Report: 2019-2033
This comprehensive report provides a detailed analysis of the global industrial lasers market, offering invaluable insights for stakeholders across the value chain. The study period covers 2019-2033, with 2025 as the base year and a forecast period spanning 2025-2033. The report segments the market by type (Fiber Laser, Solid-state Laser, CO2 Laser, Other Types), application (Cutting, Welding, Marking, Drilling, Additive Manufacturing, Other Applications), and end-user industry (Aerospace and Defense, Automotive, Healthcare, Consumer Electronics, Semiconductors, Other End-user Industries). Key players analyzed include Coherent Inc, ACSYS Lasertechnik Inc, Lumentum Holdings Inc, Lumibird SA, Han’s Laser Technology Industry Group Co Ltd, Newport Corporation (MKS Instruments Inc), Trumpf Group, Jenoptik A, Clark-MXR Inc, and IPG Photonics. The report projects a market value exceeding $xx Million by 2033.
Industrial Lasers Industry Market Structure & Competitive Dynamics
The industrial lasers market exhibits a moderately concentrated structure, with a few dominant players holding significant market share. IPG Photonics, Coherent Inc, and Lumentum Holdings Inc are among the leading companies, collectively accounting for approximately xx% of the global market in 2024. The market is characterized by intense competition, driven by continuous product innovation, aggressive pricing strategies, and strategic acquisitions.
- Market Concentration: High, with top 5 players controlling xx% of market share in 2024.
- Innovation Ecosystems: Strong, fostered by significant R&D investments and collaborations between laser manufacturers, research institutions, and end-user industries.
- Regulatory Frameworks: Vary across regions, influencing market access and product approvals, particularly within safety and environmental regulations.
- Product Substitutes: Limited, with alternative technologies offering niche applications but failing to broadly replace laser solutions in mainstream industrial processes.
- End-User Trends: Growing adoption of automation and Industry 4.0 technologies drives demand for high-precision, flexible laser systems.
- M&A Activities: Significant M&A activity observed in the past five years, valued at approximately $xx Million, indicating consolidation and expansion efforts within the industry. Notable deals included [insert specific examples of M&A deals if available, otherwise use placeholder "xx deals totaling $xx Million"].
Industrial Lasers Industry Industry Trends & Insights
The industrial lasers market is experiencing robust growth, driven by several key factors. The global market is projected to achieve a CAGR of xx% during the forecast period (2025-2033). This growth is fueled by increasing automation across various industries, rising demand for high-precision manufacturing processes, and advancements in laser technology, leading to improved efficiency and productivity. Technological disruptions such as the development of high-power fiber lasers and the integration of artificial intelligence (AI) in laser systems are also contributing to market expansion. Consumer preferences are shifting towards higher-quality, more efficient products, increasing demand for laser-based manufacturing solutions. Competitive dynamics remain intense, with companies focusing on innovation, partnerships, and strategic acquisitions to gain market share. Market penetration of fiber lasers, in particular, is expected to surpass xx% by 2033, owing to their superior performance and cost-effectiveness compared to other laser types.
Dominant Markets & Segments in Industrial Lasers Industry
Leading Region: Asia-Pacific is expected to remain the dominant region, driven by rapid industrialization and significant investments in manufacturing across countries like China, Japan, and South Korea.
Leading Country: China, owing to its vast manufacturing base and strong government support for technological advancements, maintains its position as the leading country in the global industrial lasers market.
Dominant Segments:
- Type: Fiber lasers are the fastest-growing segment, driven by their versatility, high efficiency, and cost-effectiveness, surpassing solid-state and CO2 lasers in market share.
- Application: Cutting applications maintain dominance, followed by welding and marking, with additive manufacturing rapidly gaining traction.
- End-user Industry: The automotive industry remains a significant driver, followed by electronics and aerospace and defense. This is primarily driven by the need for high-precision cutting, welding, and marking in manufacturing processes within these sectors. Key drivers include government policies promoting advanced manufacturing, strong economic growth, and expanding infrastructure in these regions.
Industrial Lasers Industry Product Innovations
Recent product developments focus on enhancing laser performance, efficiency, and integration capabilities. Innovations include high-power fiber lasers with improved beam quality, compact and integrated laser systems suitable for diverse applications, and software-driven systems simplifying process control and monitoring. These advancements address market needs for increased productivity, reduced operational costs, and enhanced process flexibility. The market sees a strong trend toward automated and intelligent laser systems capable of seamless integration within smart manufacturing environments.
Report Segmentation & Scope
This report segments the industrial lasers market comprehensively:
By Type: Fiber Laser, Solid-state Laser, CO2 Laser, Other Types (each segment includes market size projections, growth rates, and competitive analysis). Fiber lasers are expected to dominate, with a projected xx% CAGR.
By Application: Cutting, Welding, Marking, Drilling, Additive Manufacturing, Other Applications (with detailed analysis of market size, growth drivers, and competitive landscape for each application). Cutting applications are forecast to continue leading the market.
By End-user Industry: Aerospace and Defense, Automotive, Healthcare, Consumer Electronics, Semiconductors, Other End-user Industries (with market size, growth forecasts, and competitive dynamics for each industry). The automotive and electronics sectors are anticipated to showcase significant growth.
Key Drivers of Industrial Lasers Industry Growth
Several factors are driving the growth of the industrial lasers market: increasing automation in manufacturing, the rising demand for high-precision manufacturing, advancements in laser technology leading to improved efficiency and cost-effectiveness, and government initiatives promoting advanced manufacturing in various countries. The integration of lasers into various industrial processes is another key factor driving demand.
Challenges in the Industrial Lasers Industry Sector
The industrial lasers industry faces challenges such as stringent safety regulations, the high cost of advanced laser systems, and intense competition among manufacturers. Supply chain disruptions and fluctuations in raw material prices also present significant headwinds. The complexity of implementing laser technologies within existing production processes can also pose challenges to adoption.
Leading Players in the Industrial Lasers Industry Market
- Coherent Inc
- ACSYS Lasertechnik Inc
- Lumentum Holdings Inc
- Lumibird SA
- Han’s Laser Technology Industry Group Co Ltd
- Newport Corporation (MKS Instruments Inc)
- Trumpf Group
- Jenoptik A
- Clark-MXR Inc
- IPG Photonics
Key Developments in Industrial Lasers Industry Sector
- January 2024: IPG Photonics Corporation showcased new fiber laser solutions at Photonics West, highlighting advancements in laser sources, integrated systems, and industry-specific applications.
- January 2024: Coherent Corp. launched the ExactWeld 410 laser welding system for medical device manufacturing, emphasizing enhanced efficiency and ease of use.
Strategic Industrial Lasers Industry Market Outlook
The industrial lasers market exhibits strong growth potential, driven by continuous technological advancements and expanding applications across diverse industries. Strategic opportunities lie in developing innovative laser systems tailored to specific industry needs, focusing on automation and integration capabilities, and expanding into emerging markets. Collaboration and strategic partnerships are crucial for success in this dynamic and competitive market.
Industrial Lasers Industry Segmentation
-
1. Type
- 1.1. Fiber Laser
- 1.2. Solid-state Laser
- 1.3. CO2 Laser
- 1.4. Other Types
-
2. Application
- 2.1. Cutting
- 2.2. Welding
- 2.3. Marking
- 2.4. Drilling
- 2.5. Additive Manufacturing
- 2.6. Other Applications
-
3. End-user Industry
- 3.1. Aerospace and Defense
- 3.2. Automotive
- 3.3. Healthcare
- 3.4. Consumer Electronics
- 3.5. Semiconductors
- 3.6. Other End-user Industries
Industrial Lasers Industry Segmentation By Geography
- 1. North America
- 2. Europe
- 3. Asia Pacific
- 4. Latin America
- 5. Middle East and Africa
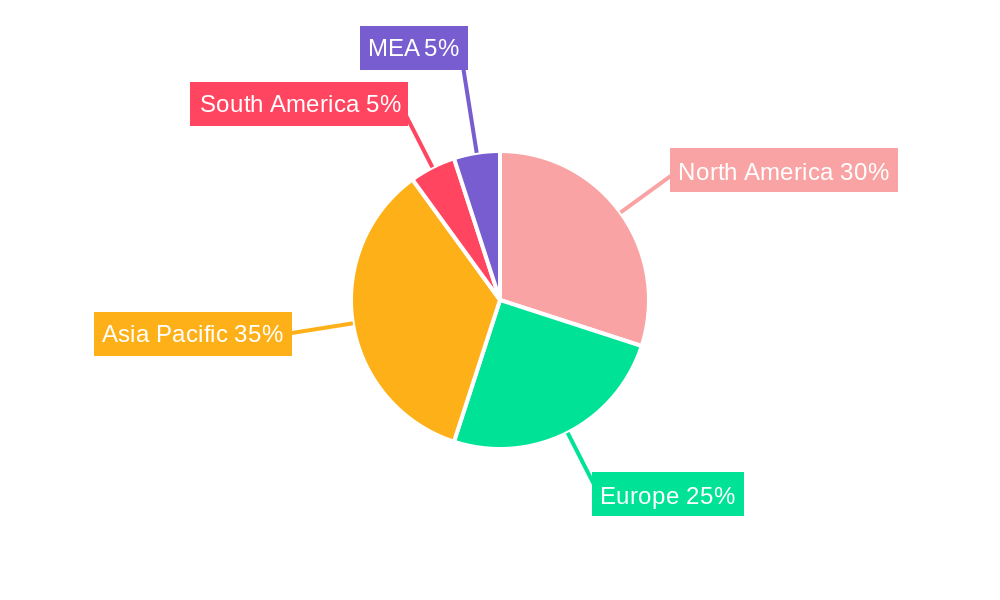
Industrial Lasers Industry Regional Market Share
Geographic Coverage of Industrial Lasers Industry
Industrial Lasers Industry REPORT HIGHLIGHTS
| Aspects | Details |
|---|---|
| Study Period | 2020-2034 |
| Base Year | 2025 |
| Estimated Year | 2026 |
| Forecast Period | 2026-2034 |
| Historical Period | 2020-2025 |
| Growth Rate | CAGR of 5.10% from 2020-2034 |
| Segmentation |
|
Table of Contents
- 1. Introduction
- 1.1. Research Scope
- 1.2. Market Segmentation
- 1.3. Research Objective
- 1.4. Definitions and Assumptions
- 2. Executive Summary
- 2.1. Market Snapshot
- 3. Market Dynamics
- 3.1. Market Drivers
- 3.2. Market Restrains
- 3.3. Market Trends
- 3.4. Market Opportunities
- 4. Market Factor Analysis
- 4.1. Porters Five Forces
- 4.1.1. Bargaining Power of Suppliers
- 4.1.2. Bargaining Power of Buyers
- 4.1.3. Threat of New Entrants
- 4.1.4. Threat of Substitutes
- 4.1.5. Competitive Rivalry
- 4.2. PESTEL analysis
- 4.3. BCG Analysis
- 4.3.1. Stars (High Growth, High Market Share)
- 4.3.2. Cash Cows (Low Growth, High Market Share)
- 4.3.3. Question Mark (High Growth, Low Market Share)
- 4.3.4. Dogs (Low Growth, Low Market Share)
- 4.4. Ansoff Matrix Analysis
- 4.5. Supply Chain Analysis
- 4.6. Regulatory Landscape
- 4.7. Current Market Potential and Opportunity Assessment (TAM–SAM–SOM Framework)
- 4.8. PMV Analyst Note
- 4.1. Porters Five Forces
- 5. Market Analysis, Insights and Forecast 2021-2033
- 5.1. Market Analysis, Insights and Forecast - by Type
- 5.1.1. Fiber Laser
- 5.1.2. Solid-state Laser
- 5.1.3. CO2 Laser
- 5.1.4. Other Types
- 5.2. Market Analysis, Insights and Forecast - by Application
- 5.2.1. Cutting
- 5.2.2. Welding
- 5.2.3. Marking
- 5.2.4. Drilling
- 5.2.5. Additive Manufacturing
- 5.2.6. Other Applications
- 5.3. Market Analysis, Insights and Forecast - by End-user Industry
- 5.3.1. Aerospace and Defense
- 5.3.2. Automotive
- 5.3.3. Healthcare
- 5.3.4. Consumer Electronics
- 5.3.5. Semiconductors
- 5.3.6. Other End-user Industries
- 5.4. Market Analysis, Insights and Forecast - by Region
- 5.4.1. North America
- 5.4.2. Europe
- 5.4.3. Asia Pacific
- 5.4.4. Latin America
- 5.4.5. Middle East and Africa
- 5.1. Market Analysis, Insights and Forecast - by Type
- 6. Global Industrial Lasers Industry Analysis, Insights and Forecast, 2021-2033
- 6.1. Market Analysis, Insights and Forecast - by Type
- 6.1.1. Fiber Laser
- 6.1.2. Solid-state Laser
- 6.1.3. CO2 Laser
- 6.1.4. Other Types
- 6.2. Market Analysis, Insights and Forecast - by Application
- 6.2.1. Cutting
- 6.2.2. Welding
- 6.2.3. Marking
- 6.2.4. Drilling
- 6.2.5. Additive Manufacturing
- 6.2.6. Other Applications
- 6.3. Market Analysis, Insights and Forecast - by End-user Industry
- 6.3.1. Aerospace and Defense
- 6.3.2. Automotive
- 6.3.3. Healthcare
- 6.3.4. Consumer Electronics
- 6.3.5. Semiconductors
- 6.3.6. Other End-user Industries
- 6.1. Market Analysis, Insights and Forecast - by Type
- 7. North America Industrial Lasers Industry Analysis, Insights and Forecast, 2020-2032
- 7.1. Market Analysis, Insights and Forecast - by Type
- 7.1.1. Fiber Laser
- 7.1.2. Solid-state Laser
- 7.1.3. CO2 Laser
- 7.1.4. Other Types
- 7.2. Market Analysis, Insights and Forecast - by Application
- 7.2.1. Cutting
- 7.2.2. Welding
- 7.2.3. Marking
- 7.2.4. Drilling
- 7.2.5. Additive Manufacturing
- 7.2.6. Other Applications
- 7.3. Market Analysis, Insights and Forecast - by End-user Industry
- 7.3.1. Aerospace and Defense
- 7.3.2. Automotive
- 7.3.3. Healthcare
- 7.3.4. Consumer Electronics
- 7.3.5. Semiconductors
- 7.3.6. Other End-user Industries
- 7.1. Market Analysis, Insights and Forecast - by Type
- 8. Europe Industrial Lasers Industry Analysis, Insights and Forecast, 2020-2032
- 8.1. Market Analysis, Insights and Forecast - by Type
- 8.1.1. Fiber Laser
- 8.1.2. Solid-state Laser
- 8.1.3. CO2 Laser
- 8.1.4. Other Types
- 8.2. Market Analysis, Insights and Forecast - by Application
- 8.2.1. Cutting
- 8.2.2. Welding
- 8.2.3. Marking
- 8.2.4. Drilling
- 8.2.5. Additive Manufacturing
- 8.2.6. Other Applications
- 8.3. Market Analysis, Insights and Forecast - by End-user Industry
- 8.3.1. Aerospace and Defense
- 8.3.2. Automotive
- 8.3.3. Healthcare
- 8.3.4. Consumer Electronics
- 8.3.5. Semiconductors
- 8.3.6. Other End-user Industries
- 8.1. Market Analysis, Insights and Forecast - by Type
- 9. Asia Pacific Industrial Lasers Industry Analysis, Insights and Forecast, 2020-2032
- 9.1. Market Analysis, Insights and Forecast - by Type
- 9.1.1. Fiber Laser
- 9.1.2. Solid-state Laser
- 9.1.3. CO2 Laser
- 9.1.4. Other Types
- 9.2. Market Analysis, Insights and Forecast - by Application
- 9.2.1. Cutting
- 9.2.2. Welding
- 9.2.3. Marking
- 9.2.4. Drilling
- 9.2.5. Additive Manufacturing
- 9.2.6. Other Applications
- 9.3. Market Analysis, Insights and Forecast - by End-user Industry
- 9.3.1. Aerospace and Defense
- 9.3.2. Automotive
- 9.3.3. Healthcare
- 9.3.4. Consumer Electronics
- 9.3.5. Semiconductors
- 9.3.6. Other End-user Industries
- 9.1. Market Analysis, Insights and Forecast - by Type
- 10. Latin America Industrial Lasers Industry Analysis, Insights and Forecast, 2020-2032
- 10.1. Market Analysis, Insights and Forecast - by Type
- 10.1.1. Fiber Laser
- 10.1.2. Solid-state Laser
- 10.1.3. CO2 Laser
- 10.1.4. Other Types
- 10.2. Market Analysis, Insights and Forecast - by Application
- 10.2.1. Cutting
- 10.2.2. Welding
- 10.2.3. Marking
- 10.2.4. Drilling
- 10.2.5. Additive Manufacturing
- 10.2.6. Other Applications
- 10.3. Market Analysis, Insights and Forecast - by End-user Industry
- 10.3.1. Aerospace and Defense
- 10.3.2. Automotive
- 10.3.3. Healthcare
- 10.3.4. Consumer Electronics
- 10.3.5. Semiconductors
- 10.3.6. Other End-user Industries
- 10.1. Market Analysis, Insights and Forecast - by Type
- 11. Middle East and Africa Industrial Lasers Industry Analysis, Insights and Forecast, 2020-2032
- 11.1. Market Analysis, Insights and Forecast - by Type
- 11.1.1. Fiber Laser
- 11.1.2. Solid-state Laser
- 11.1.3. CO2 Laser
- 11.1.4. Other Types
- 11.2. Market Analysis, Insights and Forecast - by Application
- 11.2.1. Cutting
- 11.2.2. Welding
- 11.2.3. Marking
- 11.2.4. Drilling
- 11.2.5. Additive Manufacturing
- 11.2.6. Other Applications
- 11.3. Market Analysis, Insights and Forecast - by End-user Industry
- 11.3.1. Aerospace and Defense
- 11.3.2. Automotive
- 11.3.3. Healthcare
- 11.3.4. Consumer Electronics
- 11.3.5. Semiconductors
- 11.3.6. Other End-user Industries
- 11.1. Market Analysis, Insights and Forecast - by Type
- 12. Competitive Analysis
- 12.1. Company Profiles
- 12.1.1 Coherent Inc
- 12.1.1.1. Company Overview
- 12.1.1.2. Products
- 12.1.1.3. Company Financials
- 12.1.1.4. SWOT Analysis
- 12.1.2 ACSYS Lasertechnik Inc
- 12.1.2.1. Company Overview
- 12.1.2.2. Products
- 12.1.2.3. Company Financials
- 12.1.2.4. SWOT Analysis
- 12.1.3 Lumentum Holdings Inc
- 12.1.3.1. Company Overview
- 12.1.3.2. Products
- 12.1.3.3. Company Financials
- 12.1.3.4. SWOT Analysis
- 12.1.4 Lumibird SA
- 12.1.4.1. Company Overview
- 12.1.4.2. Products
- 12.1.4.3. Company Financials
- 12.1.4.4. SWOT Analysis
- 12.1.5 Han’s Laser Technology Industry Group Co Ltd
- 12.1.5.1. Company Overview
- 12.1.5.2. Products
- 12.1.5.3. Company Financials
- 12.1.5.4. SWOT Analysis
- 12.1.6 Newport Corporation (MKS Instruments Inc )
- 12.1.6.1. Company Overview
- 12.1.6.2. Products
- 12.1.6.3. Company Financials
- 12.1.6.4. SWOT Analysis
- 12.1.7 Trumpf Group
- 12.1.7.1. Company Overview
- 12.1.7.2. Products
- 12.1.7.3. Company Financials
- 12.1.7.4. SWOT Analysis
- 12.1.8 Jenoptik A
- 12.1.8.1. Company Overview
- 12.1.8.2. Products
- 12.1.8.3. Company Financials
- 12.1.8.4. SWOT Analysis
- 12.1.9 Clark-MXR Inc
- 12.1.9.1. Company Overview
- 12.1.9.2. Products
- 12.1.9.3. Company Financials
- 12.1.9.4. SWOT Analysis
- 12.1.10 IPG Photonics
- 12.1.10.1. Company Overview
- 12.1.10.2. Products
- 12.1.10.3. Company Financials
- 12.1.10.4. SWOT Analysis
- 12.1.1 Coherent Inc
- 12.2. Market Entropy
- 12.2.1 Company's Key Areas Served
- 12.2.2 Recent Developments
- 12.3. Company Market Share Analysis 2025
- 12.3.1 Top 5 Companies Market Share Analysis
- 12.3.2 Top 3 Companies Market Share Analysis
- 12.4. List of Potential Customers
- 13. Research Methodology
List of Figures
- Figure 1: Global Industrial Lasers Industry Revenue Breakdown (Million, %) by Region 2025 & 2033
- Figure 2: Global Industrial Lasers Industry Volume Breakdown (K Unit, %) by Region 2025 & 2033
- Figure 3: North America Industrial Lasers Industry Revenue (Million), by Type 2025 & 2033
- Figure 4: North America Industrial Lasers Industry Volume (K Unit), by Type 2025 & 2033
- Figure 5: North America Industrial Lasers Industry Revenue Share (%), by Type 2025 & 2033
- Figure 6: North America Industrial Lasers Industry Volume Share (%), by Type 2025 & 2033
- Figure 7: North America Industrial Lasers Industry Revenue (Million), by Application 2025 & 2033
- Figure 8: North America Industrial Lasers Industry Volume (K Unit), by Application 2025 & 2033
- Figure 9: North America Industrial Lasers Industry Revenue Share (%), by Application 2025 & 2033
- Figure 10: North America Industrial Lasers Industry Volume Share (%), by Application 2025 & 2033
- Figure 11: North America Industrial Lasers Industry Revenue (Million), by End-user Industry 2025 & 2033
- Figure 12: North America Industrial Lasers Industry Volume (K Unit), by End-user Industry 2025 & 2033
- Figure 13: North America Industrial Lasers Industry Revenue Share (%), by End-user Industry 2025 & 2033
- Figure 14: North America Industrial Lasers Industry Volume Share (%), by End-user Industry 2025 & 2033
- Figure 15: North America Industrial Lasers Industry Revenue (Million), by Country 2025 & 2033
- Figure 16: North America Industrial Lasers Industry Volume (K Unit), by Country 2025 & 2033
- Figure 17: North America Industrial Lasers Industry Revenue Share (%), by Country 2025 & 2033
- Figure 18: North America Industrial Lasers Industry Volume Share (%), by Country 2025 & 2033
- Figure 19: Europe Industrial Lasers Industry Revenue (Million), by Type 2025 & 2033
- Figure 20: Europe Industrial Lasers Industry Volume (K Unit), by Type 2025 & 2033
- Figure 21: Europe Industrial Lasers Industry Revenue Share (%), by Type 2025 & 2033
- Figure 22: Europe Industrial Lasers Industry Volume Share (%), by Type 2025 & 2033
- Figure 23: Europe Industrial Lasers Industry Revenue (Million), by Application 2025 & 2033
- Figure 24: Europe Industrial Lasers Industry Volume (K Unit), by Application 2025 & 2033
- Figure 25: Europe Industrial Lasers Industry Revenue Share (%), by Application 2025 & 2033
- Figure 26: Europe Industrial Lasers Industry Volume Share (%), by Application 2025 & 2033
- Figure 27: Europe Industrial Lasers Industry Revenue (Million), by End-user Industry 2025 & 2033
- Figure 28: Europe Industrial Lasers Industry Volume (K Unit), by End-user Industry 2025 & 2033
- Figure 29: Europe Industrial Lasers Industry Revenue Share (%), by End-user Industry 2025 & 2033
- Figure 30: Europe Industrial Lasers Industry Volume Share (%), by End-user Industry 2025 & 2033
- Figure 31: Europe Industrial Lasers Industry Revenue (Million), by Country 2025 & 2033
- Figure 32: Europe Industrial Lasers Industry Volume (K Unit), by Country 2025 & 2033
- Figure 33: Europe Industrial Lasers Industry Revenue Share (%), by Country 2025 & 2033
- Figure 34: Europe Industrial Lasers Industry Volume Share (%), by Country 2025 & 2033
- Figure 35: Asia Pacific Industrial Lasers Industry Revenue (Million), by Type 2025 & 2033
- Figure 36: Asia Pacific Industrial Lasers Industry Volume (K Unit), by Type 2025 & 2033
- Figure 37: Asia Pacific Industrial Lasers Industry Revenue Share (%), by Type 2025 & 2033
- Figure 38: Asia Pacific Industrial Lasers Industry Volume Share (%), by Type 2025 & 2033
- Figure 39: Asia Pacific Industrial Lasers Industry Revenue (Million), by Application 2025 & 2033
- Figure 40: Asia Pacific Industrial Lasers Industry Volume (K Unit), by Application 2025 & 2033
- Figure 41: Asia Pacific Industrial Lasers Industry Revenue Share (%), by Application 2025 & 2033
- Figure 42: Asia Pacific Industrial Lasers Industry Volume Share (%), by Application 2025 & 2033
- Figure 43: Asia Pacific Industrial Lasers Industry Revenue (Million), by End-user Industry 2025 & 2033
- Figure 44: Asia Pacific Industrial Lasers Industry Volume (K Unit), by End-user Industry 2025 & 2033
- Figure 45: Asia Pacific Industrial Lasers Industry Revenue Share (%), by End-user Industry 2025 & 2033
- Figure 46: Asia Pacific Industrial Lasers Industry Volume Share (%), by End-user Industry 2025 & 2033
- Figure 47: Asia Pacific Industrial Lasers Industry Revenue (Million), by Country 2025 & 2033
- Figure 48: Asia Pacific Industrial Lasers Industry Volume (K Unit), by Country 2025 & 2033
- Figure 49: Asia Pacific Industrial Lasers Industry Revenue Share (%), by Country 2025 & 2033
- Figure 50: Asia Pacific Industrial Lasers Industry Volume Share (%), by Country 2025 & 2033
- Figure 51: Latin America Industrial Lasers Industry Revenue (Million), by Type 2025 & 2033
- Figure 52: Latin America Industrial Lasers Industry Volume (K Unit), by Type 2025 & 2033
- Figure 53: Latin America Industrial Lasers Industry Revenue Share (%), by Type 2025 & 2033
- Figure 54: Latin America Industrial Lasers Industry Volume Share (%), by Type 2025 & 2033
- Figure 55: Latin America Industrial Lasers Industry Revenue (Million), by Application 2025 & 2033
- Figure 56: Latin America Industrial Lasers Industry Volume (K Unit), by Application 2025 & 2033
- Figure 57: Latin America Industrial Lasers Industry Revenue Share (%), by Application 2025 & 2033
- Figure 58: Latin America Industrial Lasers Industry Volume Share (%), by Application 2025 & 2033
- Figure 59: Latin America Industrial Lasers Industry Revenue (Million), by End-user Industry 2025 & 2033
- Figure 60: Latin America Industrial Lasers Industry Volume (K Unit), by End-user Industry 2025 & 2033
- Figure 61: Latin America Industrial Lasers Industry Revenue Share (%), by End-user Industry 2025 & 2033
- Figure 62: Latin America Industrial Lasers Industry Volume Share (%), by End-user Industry 2025 & 2033
- Figure 63: Latin America Industrial Lasers Industry Revenue (Million), by Country 2025 & 2033
- Figure 64: Latin America Industrial Lasers Industry Volume (K Unit), by Country 2025 & 2033
- Figure 65: Latin America Industrial Lasers Industry Revenue Share (%), by Country 2025 & 2033
- Figure 66: Latin America Industrial Lasers Industry Volume Share (%), by Country 2025 & 2033
- Figure 67: Middle East and Africa Industrial Lasers Industry Revenue (Million), by Type 2025 & 2033
- Figure 68: Middle East and Africa Industrial Lasers Industry Volume (K Unit), by Type 2025 & 2033
- Figure 69: Middle East and Africa Industrial Lasers Industry Revenue Share (%), by Type 2025 & 2033
- Figure 70: Middle East and Africa Industrial Lasers Industry Volume Share (%), by Type 2025 & 2033
- Figure 71: Middle East and Africa Industrial Lasers Industry Revenue (Million), by Application 2025 & 2033
- Figure 72: Middle East and Africa Industrial Lasers Industry Volume (K Unit), by Application 2025 & 2033
- Figure 73: Middle East and Africa Industrial Lasers Industry Revenue Share (%), by Application 2025 & 2033
- Figure 74: Middle East and Africa Industrial Lasers Industry Volume Share (%), by Application 2025 & 2033
- Figure 75: Middle East and Africa Industrial Lasers Industry Revenue (Million), by End-user Industry 2025 & 2033
- Figure 76: Middle East and Africa Industrial Lasers Industry Volume (K Unit), by End-user Industry 2025 & 2033
- Figure 77: Middle East and Africa Industrial Lasers Industry Revenue Share (%), by End-user Industry 2025 & 2033
- Figure 78: Middle East and Africa Industrial Lasers Industry Volume Share (%), by End-user Industry 2025 & 2033
- Figure 79: Middle East and Africa Industrial Lasers Industry Revenue (Million), by Country 2025 & 2033
- Figure 80: Middle East and Africa Industrial Lasers Industry Volume (K Unit), by Country 2025 & 2033
- Figure 81: Middle East and Africa Industrial Lasers Industry Revenue Share (%), by Country 2025 & 2033
- Figure 82: Middle East and Africa Industrial Lasers Industry Volume Share (%), by Country 2025 & 2033
List of Tables
- Table 1: Global Industrial Lasers Industry Revenue Million Forecast, by Type 2020 & 2033
- Table 2: Global Industrial Lasers Industry Volume K Unit Forecast, by Type 2020 & 2033
- Table 3: Global Industrial Lasers Industry Revenue Million Forecast, by Application 2020 & 2033
- Table 4: Global Industrial Lasers Industry Volume K Unit Forecast, by Application 2020 & 2033
- Table 5: Global Industrial Lasers Industry Revenue Million Forecast, by End-user Industry 2020 & 2033
- Table 6: Global Industrial Lasers Industry Volume K Unit Forecast, by End-user Industry 2020 & 2033
- Table 7: Global Industrial Lasers Industry Revenue Million Forecast, by Region 2020 & 2033
- Table 8: Global Industrial Lasers Industry Volume K Unit Forecast, by Region 2020 & 2033
- Table 9: Global Industrial Lasers Industry Revenue Million Forecast, by Type 2020 & 2033
- Table 10: Global Industrial Lasers Industry Volume K Unit Forecast, by Type 2020 & 2033
- Table 11: Global Industrial Lasers Industry Revenue Million Forecast, by Application 2020 & 2033
- Table 12: Global Industrial Lasers Industry Volume K Unit Forecast, by Application 2020 & 2033
- Table 13: Global Industrial Lasers Industry Revenue Million Forecast, by End-user Industry 2020 & 2033
- Table 14: Global Industrial Lasers Industry Volume K Unit Forecast, by End-user Industry 2020 & 2033
- Table 15: Global Industrial Lasers Industry Revenue Million Forecast, by Country 2020 & 2033
- Table 16: Global Industrial Lasers Industry Volume K Unit Forecast, by Country 2020 & 2033
- Table 17: Global Industrial Lasers Industry Revenue Million Forecast, by Type 2020 & 2033
- Table 18: Global Industrial Lasers Industry Volume K Unit Forecast, by Type 2020 & 2033
- Table 19: Global Industrial Lasers Industry Revenue Million Forecast, by Application 2020 & 2033
- Table 20: Global Industrial Lasers Industry Volume K Unit Forecast, by Application 2020 & 2033
- Table 21: Global Industrial Lasers Industry Revenue Million Forecast, by End-user Industry 2020 & 2033
- Table 22: Global Industrial Lasers Industry Volume K Unit Forecast, by End-user Industry 2020 & 2033
- Table 23: Global Industrial Lasers Industry Revenue Million Forecast, by Country 2020 & 2033
- Table 24: Global Industrial Lasers Industry Volume K Unit Forecast, by Country 2020 & 2033
- Table 25: Global Industrial Lasers Industry Revenue Million Forecast, by Type 2020 & 2033
- Table 26: Global Industrial Lasers Industry Volume K Unit Forecast, by Type 2020 & 2033
- Table 27: Global Industrial Lasers Industry Revenue Million Forecast, by Application 2020 & 2033
- Table 28: Global Industrial Lasers Industry Volume K Unit Forecast, by Application 2020 & 2033
- Table 29: Global Industrial Lasers Industry Revenue Million Forecast, by End-user Industry 2020 & 2033
- Table 30: Global Industrial Lasers Industry Volume K Unit Forecast, by End-user Industry 2020 & 2033
- Table 31: Global Industrial Lasers Industry Revenue Million Forecast, by Country 2020 & 2033
- Table 32: Global Industrial Lasers Industry Volume K Unit Forecast, by Country 2020 & 2033
- Table 33: Global Industrial Lasers Industry Revenue Million Forecast, by Type 2020 & 2033
- Table 34: Global Industrial Lasers Industry Volume K Unit Forecast, by Type 2020 & 2033
- Table 35: Global Industrial Lasers Industry Revenue Million Forecast, by Application 2020 & 2033
- Table 36: Global Industrial Lasers Industry Volume K Unit Forecast, by Application 2020 & 2033
- Table 37: Global Industrial Lasers Industry Revenue Million Forecast, by End-user Industry 2020 & 2033
- Table 38: Global Industrial Lasers Industry Volume K Unit Forecast, by End-user Industry 2020 & 2033
- Table 39: Global Industrial Lasers Industry Revenue Million Forecast, by Country 2020 & 2033
- Table 40: Global Industrial Lasers Industry Volume K Unit Forecast, by Country 2020 & 2033
- Table 41: Global Industrial Lasers Industry Revenue Million Forecast, by Type 2020 & 2033
- Table 42: Global Industrial Lasers Industry Volume K Unit Forecast, by Type 2020 & 2033
- Table 43: Global Industrial Lasers Industry Revenue Million Forecast, by Application 2020 & 2033
- Table 44: Global Industrial Lasers Industry Volume K Unit Forecast, by Application 2020 & 2033
- Table 45: Global Industrial Lasers Industry Revenue Million Forecast, by End-user Industry 2020 & 2033
- Table 46: Global Industrial Lasers Industry Volume K Unit Forecast, by End-user Industry 2020 & 2033
- Table 47: Global Industrial Lasers Industry Revenue Million Forecast, by Country 2020 & 2033
- Table 48: Global Industrial Lasers Industry Volume K Unit Forecast, by Country 2020 & 2033
Frequently Asked Questions
1. What is the projected Compound Annual Growth Rate (CAGR) of the Industrial Lasers Industry?
The projected CAGR is approximately 5.10%.
2. Which companies are prominent players in the Industrial Lasers Industry?
Key companies in the market include Coherent Inc, ACSYS Lasertechnik Inc, Lumentum Holdings Inc, Lumibird SA, Han’s Laser Technology Industry Group Co Ltd, Newport Corporation (MKS Instruments Inc ), Trumpf Group, Jenoptik A, Clark-MXR Inc, IPG Photonics.
3. What are the main segments of the Industrial Lasers Industry?
The market segments include Type, Application, End-user Industry.
4. Can you provide details about the market size?
The market size is estimated to be USD 6.06 Million as of 2022.
5. What are some drivers contributing to market growth?
Enhanced Precision and Accuracy over Conventional Alternatives; Miniaturization of Component Parts.
6. What are the notable trends driving market growth?
Consumer Electronics to Witness Major Growth.
7. Are there any restraints impacting market growth?
Regulation Compliance Associated with Laser Usage.
8. Can you provide examples of recent developments in the market?
January 2024 - IPG Photonics Corporation highlighted new and innovative fiber laser solutions in San Francisco at Photonics West January 30 - February 01, 2024. The 2,000-square-foot booth displays include a wide range of laser sources, integrated systems, and industry-specific solutions, along with numerous showcases of application samples.
9. What pricing options are available for accessing the report?
Pricing options include single-user, multi-user, and enterprise licenses priced at USD 4750, USD 5250, and USD 8750 respectively.
10. Is the market size provided in terms of value or volume?
The market size is provided in terms of value, measured in Million and volume, measured in K Unit.
11. Are there any specific market keywords associated with the report?
Yes, the market keyword associated with the report is "Industrial Lasers Industry," which aids in identifying and referencing the specific market segment covered.
12. How do I determine which pricing option suits my needs best?
The pricing options vary based on user requirements and access needs. Individual users may opt for single-user licenses, while businesses requiring broader access may choose multi-user or enterprise licenses for cost-effective access to the report.
13. Are there any additional resources or data provided in the Industrial Lasers Industry report?
While the report offers comprehensive insights, it's advisable to review the specific contents or supplementary materials provided to ascertain if additional resources or data are available.
14. How can I stay updated on further developments or reports in the Industrial Lasers Industry?
To stay informed about further developments, trends, and reports in the Industrial Lasers Industry, consider subscribing to industry newsletters, following relevant companies and organizations, or regularly checking reputable industry news sources and publications.
Methodology
Step 1 - Identification of Relevant Samples Size from Population Database


Step 2 - Approaches for Defining Global Market Size (Value, Volume* & Price*)

Note*: In applicable scenarios
Step 3 - Data Sources
Primary Research
- Web Analytics
- Survey Reports
- Research Institute
- Latest Research Reports
- Opinion Leaders
Secondary Research
- Annual Reports
- White Paper
- Latest Press Release
- Industry Association
- Paid Database
- Investor Presentations

Step 4 - Data Triangulation
Involves using different sources of information in order to increase the validity of a study
These sources are likely to be stakeholders in a program - participants, other researchers, program staff, other community members, and so on.
Then we put all data in single framework & apply various statistical tools to find out the dynamic on the market.
During the analysis stage, feedback from the stakeholder groups would be compared to determine areas of agreement as well as areas of divergence