
Key Insights
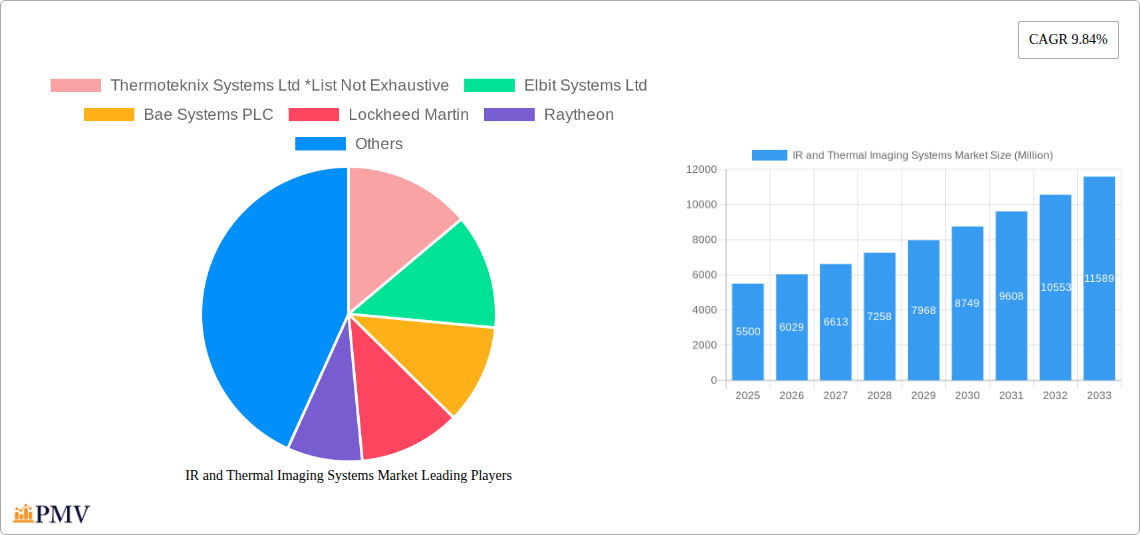
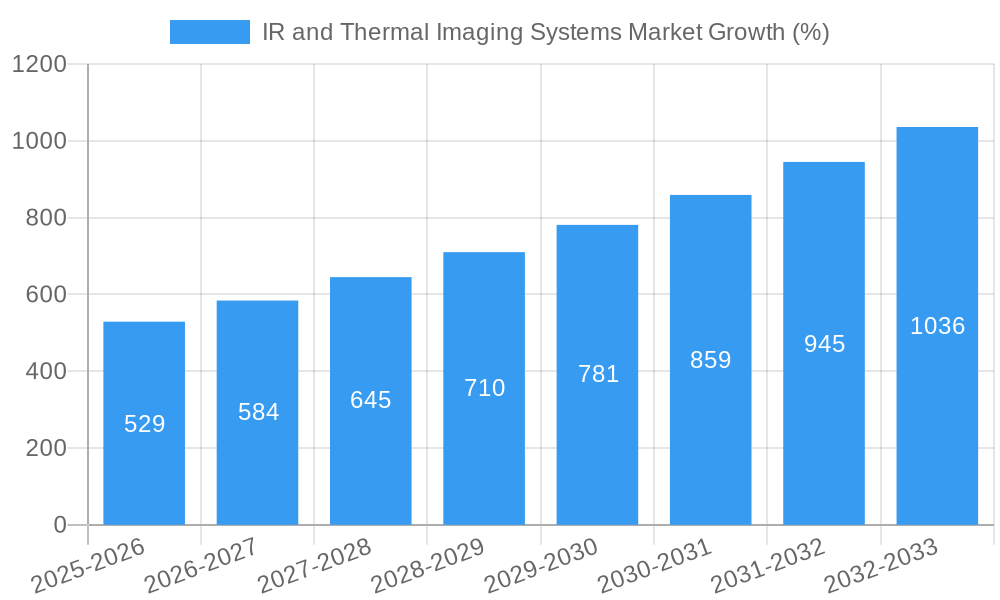
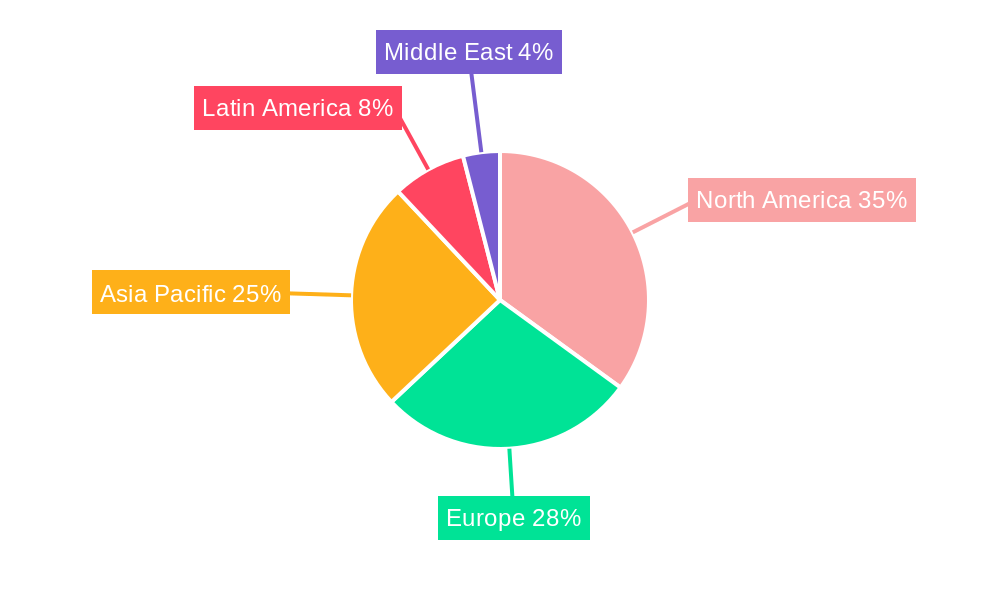
The global infrared (IR) and thermal imaging systems market is experiencing robust growth, driven by increasing demand across diverse sectors. The market's Compound Annual Growth Rate (CAGR) of 9.84% from 2019-2033 indicates significant expansion, fueled primarily by advancements in sensor technology leading to improved image quality, resolution, and affordability. Key application areas such as industrial inspection, security surveillance, and automotive safety are witnessing particularly strong adoption. The rise of autonomous vehicles, requiring advanced driver-assistance systems (ADAS), is a significant driver. Furthermore, the increasing need for predictive maintenance in various industries, coupled with rising government investments in defense and security, are bolstering market growth. The market is segmented by solutions (hardware, software, services), applications (industrial, security, research & development, construction, maritime, transportation, law enforcement), and form factor (handheld, fixed-mounted). While the precise market size for 2025 is not provided, based on a CAGR of 9.84% and considering the substantial growth drivers, a reasonable estimation places the market value in the billions of dollars. Competitively, the market is characterized by established players like FLIR Systems, Lockheed Martin, and Raytheon, alongside emerging technology providers. Geographic distribution reveals strong growth across North America and Asia-Pacific, driven by high technological adoption rates and significant investments. Europe and the Middle East also contribute substantially to the market. However, factors such as high initial investment costs and the need for specialized expertise could potentially restrain market growth to some extent.
Looking ahead, the integration of artificial intelligence (AI) and machine learning (ML) into thermal imaging systems is poised to revolutionize the industry. AI-powered analytics will enable more sophisticated applications, such as automated threat detection, predictive maintenance, and advanced process optimization across different sectors. The miniaturization of thermal imaging sensors is also driving the development of smaller, lighter, and more energy-efficient devices, broadening their applicability in diverse consumer and industrial segments. The continued development of high-performance, cost-effective thermal imaging technologies will further propel the market expansion, leading to widespread adoption in new and existing applications. The market shows significant potential for growth across various regions, with developing economies presenting attractive opportunities.
IR and Thermal Imaging Systems Market: A Comprehensive Market Report (2019-2033)
This detailed report provides a comprehensive analysis of the IR and Thermal Imaging Systems market, offering invaluable insights for industry stakeholders, investors, and strategic decision-makers. The study period covers 2019-2033, with 2025 serving as the base and estimated year, and the forecast period spanning 2025-2033. The historical period analyzed is 2019-2024. This report leverages extensive primary and secondary research to deliver accurate market sizing, segmentation, and growth projections. The market is segmented by solutions (hardware, software, services), applications (industrial, security, R&D, construction, maritime, transportation, law enforcement, others), and form factor (handheld, fixed mounted – rotary and non-rotary). Leading companies such as Thermoteknix Systems Ltd, Elbit Systems Ltd, Bae Systems PLC, Lockheed Martin, Raytheon, ULIS, Leonardo DRS, L-3 Communications Holdings, FLIR Systems Inc, and Sofradir Group are analyzed for their market share, competitive strategies, and product innovation.
IR and Thermal Imaging Systems Market Market Structure & Competitive Dynamics
The IR and Thermal Imaging Systems market exhibits a moderately concentrated structure with a few major players holding significant market share. The market is characterized by intense competition driven by technological advancements, continuous product innovation, and the pursuit of market share. Innovation ecosystems are dynamic, with considerable R&D investment focused on enhancing image quality, improving sensor performance, and reducing system costs. Regulatory frameworks vary across different geographies, impacting market access and compliance requirements. Product substitutes, such as high-resolution visible light cameras in certain applications, exert some competitive pressure. End-user trends are shifting towards higher-resolution, more compact, and integrated systems with advanced analytics capabilities. M&A activities have been moderate, with deal values averaging around xx Million in recent years. Key M&A events have included (examples would be listed here, specific deals and values need to be added based on your research). The global market share is approximately distributed as follows: FLIR Systems Inc (xx%), Thermoteknix Systems Ltd (xx%), Elbit Systems Ltd (xx%), and other players (xx%).
IR and Thermal Imaging Systems Market Industry Trends & Insights
The global IR and Thermal Imaging Systems market is experiencing robust growth, driven by increasing demand across diverse applications. The market is expected to witness a CAGR of xx% during the forecast period (2025-2033). Key growth drivers include rising adoption in security and surveillance, the expanding industrial automation sector, and the growing need for advanced thermal imaging in research and development. Technological disruptions, such as the development of advanced microbolometer technology and improved image processing algorithms, are fueling market innovation and enhancing system performance. Consumer preferences are shifting towards compact, user-friendly, and cost-effective solutions, particularly in handheld applications. Competitive dynamics remain intense, with major players focusing on product differentiation, strategic partnerships, and geographical expansion to gain a competitive edge. Market penetration rates vary across different segments and regions, with significant growth potential in developing economies. The high cost of advanced systems and the availability of alternative technologies present some challenges to wider market adoption.
Dominant Markets & Segments in IR and Thermal Imaging Systems Market
The North American region currently holds the largest market share, driven by strong demand from the defense, security, and industrial sectors, as well as robust government funding for research and development. This dominance is fueled by factors such as:
- Robust Defense Spending: Significant investments in national defense and security are driving the demand for advanced thermal imaging systems.
- Advanced Technological Infrastructure: The presence of well-established technological infrastructure and a strong R&D ecosystem support innovation and adoption.
- Stringent Security Regulations: Regulations regarding border security and crime prevention contribute to high demand for thermal imaging technology.
Within the segmentation, the hardware segment holds the largest market share due to significant demand across all applications. The industrial application segment currently dominates, driven by the increasing adoption of thermal imaging in predictive maintenance, non-destructive testing, and process optimization. Within the form factor segment, the fixed mounted (rotary and non-rotary) category is expected to continue its strong growth.
- Key Drivers for the Industrial Application Segment: Automation trends, increasing safety concerns, and the drive for improved operational efficiency are key factors propelling this segment’s growth.
The security and surveillance segment is also experiencing rapid growth due to heightened security concerns globally.
- Key Drivers for the Security and Surveillance Segment: The increasing adoption of AI-powered analytics and the rise in cyber security concerns are further propelling its growth.
IR and Thermal Imaging Systems Market Product Innovations
Recent innovations include improved sensor technologies offering higher resolution and better thermal sensitivity, the integration of AI and machine learning for enhanced image analysis and target recognition, and the development of compact and lightweight systems for diverse applications. These innovations enhance the effectiveness and usability of thermal imaging systems, expanding their applicability across various sectors and enabling new applications. The ongoing miniaturization trend is making thermal imaging technology more accessible and affordable, while improved software enhances image processing and analysis.
Report Segmentation & Scope
The report segments the IR and Thermal Imaging Systems market across three key parameters:
By Solutions: Hardware encompasses sensors, cameras, and related components; software includes image processing algorithms and analysis tools; and services include installation, maintenance, and support. The hardware segment is projected to grow at xx% CAGR.
By Applications: Industrial, security, research and development, construction, maritime, transportation, law enforcement, and other applications each possess unique market dynamics. The industrial sector is expected to maintain its dominance, while others show significant growth potential.
By Form Factor: Handheld imaging devices and fixed-mounted systems (rotary and non-rotary) cater to diverse needs. The fixed-mounted segment is expected to grow at a faster rate than handheld due to increasing demand in larger-scale applications.
Key Drivers of IR and Thermal Imaging Systems Market Growth
Several factors drive market growth. Technological advancements, such as enhanced sensor technologies and sophisticated image processing algorithms, continue to improve the capabilities and affordability of thermal imaging systems. Economic growth and rising disposable incomes boost spending in security, surveillance, and industrial automation. Stringent government regulations related to safety and security, particularly in critical infrastructure, fuel the demand for thermal imaging solutions.
Challenges in the IR and Thermal Imaging Systems Market Sector
The market faces challenges, including the high cost of advanced systems limiting adoption in price-sensitive segments. Supply chain disruptions can impact availability and lead times. Intense competition from established players and emerging entrants necessitates continuous innovation and cost optimization to maintain profitability. Regulatory compliance requirements, particularly regarding data privacy and security, also pose operational challenges.
Leading Players in the IR and Thermal Imaging Systems Market Market
- Thermoteknix Systems Ltd
- Elbit Systems Ltd
- Bae Systems PLC
- Lockheed Martin
- Raytheon
- ULIS
- Leonardo DRS
- L-3 Communications Holdings
- FLIR Systems Inc
- Sofradir Group
Key Developments in IR and Thermal Imaging Systems Market Sector
- January 2023: FLIR Systems launches a new high-resolution thermal imaging camera.
- March 2022: Elbit Systems acquires a smaller thermal imaging sensor company. (Specific details need to be added)
- June 2021: A major partnership is formed between two key players in the market. (Specific details need to be added)
(Further developments with year/month need to be added based on research)
Strategic IR and Thermal Imaging Systems Market Market Outlook
The IR and Thermal Imaging Systems market is poised for continued growth, driven by technological innovation, expanding applications, and increasing government investments. Strategic opportunities exist in developing advanced analytics capabilities, integrating AI and machine learning into systems, and targeting niche applications with customized solutions. Focusing on cost-effective solutions for emerging markets presents significant growth potential.
IR and Thermal Imaging Systems Market Segmentation
-
1. Solutions
- 1.1. Hardware
- 1.2. Software
- 1.3. Services
-
2. Applications
- 2.1. Industrial
- 2.2. Security
- 2.3. Research and Development
- 2.4. Construction Industry
- 2.5. Maritime
- 2.6. Transportation
- 2.7. Law Enforcement Agencies
- 2.8. Other Applications
-
3. Form Factor
- 3.1. Handheld Imaging Devices and Systems
- 3.2. Fixed Mounted (Rotary and Non-Rotary)
IR and Thermal Imaging Systems Market Segmentation By Geography
-
1. North America
- 1.1. United States
- 1.2. Canada
-
2. Europe
- 2.1. United Kingdom
- 2.2. Germany
- 2.3. France
-
3. Asia
- 3.1. China
- 3.2. Japan
- 3.3. India
- 4. Australia and New Zealand
-
5. Latin America
- 5.1. Brazil
- 5.2. Mexico
- 5.3. Argentina
-
6. Middle East and Africa
- 6.1. Saudi Arabia
- 6.2. United Arab Emirates
- 6.3. South Africa
IR and Thermal Imaging Systems Market REPORT HIGHLIGHTS
| Aspects | Details |
|---|---|
| Study Period | 2019-2033 |
| Base Year | 2024 |
| Estimated Year | 2025 |
| Forecast Period | 2025-2033 |
| Historical Period | 2019-2024 |
| Growth Rate | CAGR of 9.84% from 2019-2033 |
| Segmentation |
|
Table of Contents
- 1. Introduction
- 1.1. Research Scope
- 1.2. Market Segmentation
- 1.3. Research Methodology
- 1.4. Definitions and Assumptions
- 2. Executive Summary
- 2.1. Introduction
- 3. Market Dynamics
- 3.1. Introduction
- 3.2. Market Drivers
- 3.2.1. ; Low Cost Solutions; Increasing Usage Across Industries; Low Impact on the Environment
- 3.3. Market Restrains
- 3.3.1. ; Lack of Regular Support and Services
- 3.4. Market Trends
- 3.4.1. Industrial Applications are Expected to Have a Major Market Share
- 4. Market Factor Analysis
- 4.1. Porters Five Forces
- 4.2. Supply/Value Chain
- 4.3. PESTEL analysis
- 4.4. Market Entropy
- 4.5. Patent/Trademark Analysis
- 5. Global IR and Thermal Imaging Systems Market Analysis, Insights and Forecast, 2019-2031
- 5.1. Market Analysis, Insights and Forecast - by Solutions
- 5.1.1. Hardware
- 5.1.2. Software
- 5.1.3. Services
- 5.2. Market Analysis, Insights and Forecast - by Applications
- 5.2.1. Industrial
- 5.2.2. Security
- 5.2.3. Research and Development
- 5.2.4. Construction Industry
- 5.2.5. Maritime
- 5.2.6. Transportation
- 5.2.7. Law Enforcement Agencies
- 5.2.8. Other Applications
- 5.3. Market Analysis, Insights and Forecast - by Form Factor
- 5.3.1. Handheld Imaging Devices and Systems
- 5.3.2. Fixed Mounted (Rotary and Non-Rotary)
- 5.4. Market Analysis, Insights and Forecast - by Region
- 5.4.1. North America
- 5.4.2. Europe
- 5.4.3. Asia
- 5.4.4. Australia and New Zealand
- 5.4.5. Latin America
- 5.4.6. Middle East and Africa
- 5.1. Market Analysis, Insights and Forecast - by Solutions
- 6. North America IR and Thermal Imaging Systems Market Analysis, Insights and Forecast, 2019-2031
- 6.1. Market Analysis, Insights and Forecast - by Solutions
- 6.1.1. Hardware
- 6.1.2. Software
- 6.1.3. Services
- 6.2. Market Analysis, Insights and Forecast - by Applications
- 6.2.1. Industrial
- 6.2.2. Security
- 6.2.3. Research and Development
- 6.2.4. Construction Industry
- 6.2.5. Maritime
- 6.2.6. Transportation
- 6.2.7. Law Enforcement Agencies
- 6.2.8. Other Applications
- 6.3. Market Analysis, Insights and Forecast - by Form Factor
- 6.3.1. Handheld Imaging Devices and Systems
- 6.3.2. Fixed Mounted (Rotary and Non-Rotary)
- 6.1. Market Analysis, Insights and Forecast - by Solutions
- 7. Europe IR and Thermal Imaging Systems Market Analysis, Insights and Forecast, 2019-2031
- 7.1. Market Analysis, Insights and Forecast - by Solutions
- 7.1.1. Hardware
- 7.1.2. Software
- 7.1.3. Services
- 7.2. Market Analysis, Insights and Forecast - by Applications
- 7.2.1. Industrial
- 7.2.2. Security
- 7.2.3. Research and Development
- 7.2.4. Construction Industry
- 7.2.5. Maritime
- 7.2.6. Transportation
- 7.2.7. Law Enforcement Agencies
- 7.2.8. Other Applications
- 7.3. Market Analysis, Insights and Forecast - by Form Factor
- 7.3.1. Handheld Imaging Devices and Systems
- 7.3.2. Fixed Mounted (Rotary and Non-Rotary)
- 7.1. Market Analysis, Insights and Forecast - by Solutions
- 8. Asia IR and Thermal Imaging Systems Market Analysis, Insights and Forecast, 2019-2031
- 8.1. Market Analysis, Insights and Forecast - by Solutions
- 8.1.1. Hardware
- 8.1.2. Software
- 8.1.3. Services
- 8.2. Market Analysis, Insights and Forecast - by Applications
- 8.2.1. Industrial
- 8.2.2. Security
- 8.2.3. Research and Development
- 8.2.4. Construction Industry
- 8.2.5. Maritime
- 8.2.6. Transportation
- 8.2.7. Law Enforcement Agencies
- 8.2.8. Other Applications
- 8.3. Market Analysis, Insights and Forecast - by Form Factor
- 8.3.1. Handheld Imaging Devices and Systems
- 8.3.2. Fixed Mounted (Rotary and Non-Rotary)
- 8.1. Market Analysis, Insights and Forecast - by Solutions
- 9. Australia and New Zealand IR and Thermal Imaging Systems Market Analysis, Insights and Forecast, 2019-2031
- 9.1. Market Analysis, Insights and Forecast - by Solutions
- 9.1.1. Hardware
- 9.1.2. Software
- 9.1.3. Services
- 9.2. Market Analysis, Insights and Forecast - by Applications
- 9.2.1. Industrial
- 9.2.2. Security
- 9.2.3. Research and Development
- 9.2.4. Construction Industry
- 9.2.5. Maritime
- 9.2.6. Transportation
- 9.2.7. Law Enforcement Agencies
- 9.2.8. Other Applications
- 9.3. Market Analysis, Insights and Forecast - by Form Factor
- 9.3.1. Handheld Imaging Devices and Systems
- 9.3.2. Fixed Mounted (Rotary and Non-Rotary)
- 9.1. Market Analysis, Insights and Forecast - by Solutions
- 10. Latin America IR and Thermal Imaging Systems Market Analysis, Insights and Forecast, 2019-2031
- 10.1. Market Analysis, Insights and Forecast - by Solutions
- 10.1.1. Hardware
- 10.1.2. Software
- 10.1.3. Services
- 10.2. Market Analysis, Insights and Forecast - by Applications
- 10.2.1. Industrial
- 10.2.2. Security
- 10.2.3. Research and Development
- 10.2.4. Construction Industry
- 10.2.5. Maritime
- 10.2.6. Transportation
- 10.2.7. Law Enforcement Agencies
- 10.2.8. Other Applications
- 10.3. Market Analysis, Insights and Forecast - by Form Factor
- 10.3.1. Handheld Imaging Devices and Systems
- 10.3.2. Fixed Mounted (Rotary and Non-Rotary)
- 10.1. Market Analysis, Insights and Forecast - by Solutions
- 11. Middle East and Africa IR and Thermal Imaging Systems Market Analysis, Insights and Forecast, 2019-2031
- 11.1. Market Analysis, Insights and Forecast - by Solutions
- 11.1.1. Hardware
- 11.1.2. Software
- 11.1.3. Services
- 11.2. Market Analysis, Insights and Forecast - by Applications
- 11.2.1. Industrial
- 11.2.2. Security
- 11.2.3. Research and Development
- 11.2.4. Construction Industry
- 11.2.5. Maritime
- 11.2.6. Transportation
- 11.2.7. Law Enforcement Agencies
- 11.2.8. Other Applications
- 11.3. Market Analysis, Insights and Forecast - by Form Factor
- 11.3.1. Handheld Imaging Devices and Systems
- 11.3.2. Fixed Mounted (Rotary and Non-Rotary)
- 11.1. Market Analysis, Insights and Forecast - by Solutions
- 12. North America IR and Thermal Imaging Systems Market Analysis, Insights and Forecast, 2019-2031
- 12.1. Market Analysis, Insights and Forecast - By Country/Sub-region
- 12.1.1 United States
- 12.1.2 Canada
- 13. Europe IR and Thermal Imaging Systems Market Analysis, Insights and Forecast, 2019-2031
- 13.1. Market Analysis, Insights and Forecast - By Country/Sub-region
- 13.1.1 United Kingdom
- 13.1.2 Germany
- 13.1.3 France
- 13.1.4 Rest of Europe
- 14. Asia Pacific IR and Thermal Imaging Systems Market Analysis, Insights and Forecast, 2019-2031
- 14.1. Market Analysis, Insights and Forecast - By Country/Sub-region
- 14.1.1 China
- 14.1.2 Japan
- 14.1.3 India
- 14.1.4 Rest of Asia Pacific
- 15. Latin America IR and Thermal Imaging Systems Market Analysis, Insights and Forecast, 2019-2031
- 15.1. Market Analysis, Insights and Forecast - By Country/Sub-region
- 15.1.1 Brazil
- 15.1.2 Mexico
- 15.1.3 Argentina
- 15.1.4 Rest of Latin America
- 16. Middle East IR and Thermal Imaging Systems Market Analysis, Insights and Forecast, 2019-2031
- 16.1. Market Analysis, Insights and Forecast - By Country/Sub-region
- 16.1.1.
- 17. Saudi Arabia IR and Thermal Imaging Systems Market Analysis, Insights and Forecast, 2019-2031
- 17.1. Market Analysis, Insights and Forecast - By Country/Sub-region
- 17.1.1 United Arab Emirates
- 17.1.2 South Africa
- 17.1.3 Rest of Middle East
- 18. Competitive Analysis
- 18.1. Global Market Share Analysis 2024
- 18.2. Company Profiles
- 18.2.1 Thermoteknix Systems Ltd *List Not Exhaustive
- 18.2.1.1. Overview
- 18.2.1.2. Products
- 18.2.1.3. SWOT Analysis
- 18.2.1.4. Recent Developments
- 18.2.1.5. Financials (Based on Availability)
- 18.2.2 Elbit Systems Ltd
- 18.2.2.1. Overview
- 18.2.2.2. Products
- 18.2.2.3. SWOT Analysis
- 18.2.2.4. Recent Developments
- 18.2.2.5. Financials (Based on Availability)
- 18.2.3 Bae Systems PLC
- 18.2.3.1. Overview
- 18.2.3.2. Products
- 18.2.3.3. SWOT Analysis
- 18.2.3.4. Recent Developments
- 18.2.3.5. Financials (Based on Availability)
- 18.2.4 Lockheed Martin
- 18.2.4.1. Overview
- 18.2.4.2. Products
- 18.2.4.3. SWOT Analysis
- 18.2.4.4. Recent Developments
- 18.2.4.5. Financials (Based on Availability)
- 18.2.5 Raytheon
- 18.2.5.1. Overview
- 18.2.5.2. Products
- 18.2.5.3. SWOT Analysis
- 18.2.5.4. Recent Developments
- 18.2.5.5. Financials (Based on Availability)
- 18.2.6 ULIS
- 18.2.6.1. Overview
- 18.2.6.2. Products
- 18.2.6.3. SWOT Analysis
- 18.2.6.4. Recent Developments
- 18.2.6.5. Financials (Based on Availability)
- 18.2.7 Leonardo DRS
- 18.2.7.1. Overview
- 18.2.7.2. Products
- 18.2.7.3. SWOT Analysis
- 18.2.7.4. Recent Developments
- 18.2.7.5. Financials (Based on Availability)
- 18.2.8 L-3 Communications Holdings
- 18.2.8.1. Overview
- 18.2.8.2. Products
- 18.2.8.3. SWOT Analysis
- 18.2.8.4. Recent Developments
- 18.2.8.5. Financials (Based on Availability)
- 18.2.9 Flir Systems Inc
- 18.2.9.1. Overview
- 18.2.9.2. Products
- 18.2.9.3. SWOT Analysis
- 18.2.9.4. Recent Developments
- 18.2.9.5. Financials (Based on Availability)
- 18.2.10 Sofradir Group
- 18.2.10.1. Overview
- 18.2.10.2. Products
- 18.2.10.3. SWOT Analysis
- 18.2.10.4. Recent Developments
- 18.2.10.5. Financials (Based on Availability)
- 18.2.1 Thermoteknix Systems Ltd *List Not Exhaustive
List of Figures
- Figure 1: Global IR and Thermal Imaging Systems Market Revenue Breakdown (Million, %) by Region 2024 & 2032
- Figure 2: North America IR and Thermal Imaging Systems Market Revenue (Million), by Country 2024 & 2032
- Figure 3: North America IR and Thermal Imaging Systems Market Revenue Share (%), by Country 2024 & 2032
- Figure 4: Europe IR and Thermal Imaging Systems Market Revenue (Million), by Country 2024 & 2032
- Figure 5: Europe IR and Thermal Imaging Systems Market Revenue Share (%), by Country 2024 & 2032
- Figure 6: Asia Pacific IR and Thermal Imaging Systems Market Revenue (Million), by Country 2024 & 2032
- Figure 7: Asia Pacific IR and Thermal Imaging Systems Market Revenue Share (%), by Country 2024 & 2032
- Figure 8: Latin America IR and Thermal Imaging Systems Market Revenue (Million), by Country 2024 & 2032
- Figure 9: Latin America IR and Thermal Imaging Systems Market Revenue Share (%), by Country 2024 & 2032
- Figure 10: Middle East IR and Thermal Imaging Systems Market Revenue (Million), by Country 2024 & 2032
- Figure 11: Middle East IR and Thermal Imaging Systems Market Revenue Share (%), by Country 2024 & 2032
- Figure 12: Saudi Arabia IR and Thermal Imaging Systems Market Revenue (Million), by Country 2024 & 2032
- Figure 13: Saudi Arabia IR and Thermal Imaging Systems Market Revenue Share (%), by Country 2024 & 2032
- Figure 14: North America IR and Thermal Imaging Systems Market Revenue (Million), by Solutions 2024 & 2032
- Figure 15: North America IR and Thermal Imaging Systems Market Revenue Share (%), by Solutions 2024 & 2032
- Figure 16: North America IR and Thermal Imaging Systems Market Revenue (Million), by Applications 2024 & 2032
- Figure 17: North America IR and Thermal Imaging Systems Market Revenue Share (%), by Applications 2024 & 2032
- Figure 18: North America IR and Thermal Imaging Systems Market Revenue (Million), by Form Factor 2024 & 2032
- Figure 19: North America IR and Thermal Imaging Systems Market Revenue Share (%), by Form Factor 2024 & 2032
- Figure 20: North America IR and Thermal Imaging Systems Market Revenue (Million), by Country 2024 & 2032
- Figure 21: North America IR and Thermal Imaging Systems Market Revenue Share (%), by Country 2024 & 2032
- Figure 22: Europe IR and Thermal Imaging Systems Market Revenue (Million), by Solutions 2024 & 2032
- Figure 23: Europe IR and Thermal Imaging Systems Market Revenue Share (%), by Solutions 2024 & 2032
- Figure 24: Europe IR and Thermal Imaging Systems Market Revenue (Million), by Applications 2024 & 2032
- Figure 25: Europe IR and Thermal Imaging Systems Market Revenue Share (%), by Applications 2024 & 2032
- Figure 26: Europe IR and Thermal Imaging Systems Market Revenue (Million), by Form Factor 2024 & 2032
- Figure 27: Europe IR and Thermal Imaging Systems Market Revenue Share (%), by Form Factor 2024 & 2032
- Figure 28: Europe IR and Thermal Imaging Systems Market Revenue (Million), by Country 2024 & 2032
- Figure 29: Europe IR and Thermal Imaging Systems Market Revenue Share (%), by Country 2024 & 2032
- Figure 30: Asia IR and Thermal Imaging Systems Market Revenue (Million), by Solutions 2024 & 2032
- Figure 31: Asia IR and Thermal Imaging Systems Market Revenue Share (%), by Solutions 2024 & 2032
- Figure 32: Asia IR and Thermal Imaging Systems Market Revenue (Million), by Applications 2024 & 2032
- Figure 33: Asia IR and Thermal Imaging Systems Market Revenue Share (%), by Applications 2024 & 2032
- Figure 34: Asia IR and Thermal Imaging Systems Market Revenue (Million), by Form Factor 2024 & 2032
- Figure 35: Asia IR and Thermal Imaging Systems Market Revenue Share (%), by Form Factor 2024 & 2032
- Figure 36: Asia IR and Thermal Imaging Systems Market Revenue (Million), by Country 2024 & 2032
- Figure 37: Asia IR and Thermal Imaging Systems Market Revenue Share (%), by Country 2024 & 2032
- Figure 38: Australia and New Zealand IR and Thermal Imaging Systems Market Revenue (Million), by Solutions 2024 & 2032
- Figure 39: Australia and New Zealand IR and Thermal Imaging Systems Market Revenue Share (%), by Solutions 2024 & 2032
- Figure 40: Australia and New Zealand IR and Thermal Imaging Systems Market Revenue (Million), by Applications 2024 & 2032
- Figure 41: Australia and New Zealand IR and Thermal Imaging Systems Market Revenue Share (%), by Applications 2024 & 2032
- Figure 42: Australia and New Zealand IR and Thermal Imaging Systems Market Revenue (Million), by Form Factor 2024 & 2032
- Figure 43: Australia and New Zealand IR and Thermal Imaging Systems Market Revenue Share (%), by Form Factor 2024 & 2032
- Figure 44: Australia and New Zealand IR and Thermal Imaging Systems Market Revenue (Million), by Country 2024 & 2032
- Figure 45: Australia and New Zealand IR and Thermal Imaging Systems Market Revenue Share (%), by Country 2024 & 2032
- Figure 46: Latin America IR and Thermal Imaging Systems Market Revenue (Million), by Solutions 2024 & 2032
- Figure 47: Latin America IR and Thermal Imaging Systems Market Revenue Share (%), by Solutions 2024 & 2032
- Figure 48: Latin America IR and Thermal Imaging Systems Market Revenue (Million), by Applications 2024 & 2032
- Figure 49: Latin America IR and Thermal Imaging Systems Market Revenue Share (%), by Applications 2024 & 2032
- Figure 50: Latin America IR and Thermal Imaging Systems Market Revenue (Million), by Form Factor 2024 & 2032
- Figure 51: Latin America IR and Thermal Imaging Systems Market Revenue Share (%), by Form Factor 2024 & 2032
- Figure 52: Latin America IR and Thermal Imaging Systems Market Revenue (Million), by Country 2024 & 2032
- Figure 53: Latin America IR and Thermal Imaging Systems Market Revenue Share (%), by Country 2024 & 2032
- Figure 54: Middle East and Africa IR and Thermal Imaging Systems Market Revenue (Million), by Solutions 2024 & 2032
- Figure 55: Middle East and Africa IR and Thermal Imaging Systems Market Revenue Share (%), by Solutions 2024 & 2032
- Figure 56: Middle East and Africa IR and Thermal Imaging Systems Market Revenue (Million), by Applications 2024 & 2032
- Figure 57: Middle East and Africa IR and Thermal Imaging Systems Market Revenue Share (%), by Applications 2024 & 2032
- Figure 58: Middle East and Africa IR and Thermal Imaging Systems Market Revenue (Million), by Form Factor 2024 & 2032
- Figure 59: Middle East and Africa IR and Thermal Imaging Systems Market Revenue Share (%), by Form Factor 2024 & 2032
- Figure 60: Middle East and Africa IR and Thermal Imaging Systems Market Revenue (Million), by Country 2024 & 2032
- Figure 61: Middle East and Africa IR and Thermal Imaging Systems Market Revenue Share (%), by Country 2024 & 2032
List of Tables
- Table 1: Global IR and Thermal Imaging Systems Market Revenue Million Forecast, by Region 2019 & 2032
- Table 2: Global IR and Thermal Imaging Systems Market Revenue Million Forecast, by Solutions 2019 & 2032
- Table 3: Global IR and Thermal Imaging Systems Market Revenue Million Forecast, by Applications 2019 & 2032
- Table 4: Global IR and Thermal Imaging Systems Market Revenue Million Forecast, by Form Factor 2019 & 2032
- Table 5: Global IR and Thermal Imaging Systems Market Revenue Million Forecast, by Region 2019 & 2032
- Table 6: Global IR and Thermal Imaging Systems Market Revenue Million Forecast, by Country 2019 & 2032
- Table 7: United States IR and Thermal Imaging Systems Market Revenue (Million) Forecast, by Application 2019 & 2032
- Table 8: Canada IR and Thermal Imaging Systems Market Revenue (Million) Forecast, by Application 2019 & 2032
- Table 9: Global IR and Thermal Imaging Systems Market Revenue Million Forecast, by Country 2019 & 2032
- Table 10: United Kingdom IR and Thermal Imaging Systems Market Revenue (Million) Forecast, by Application 2019 & 2032
- Table 11: Germany IR and Thermal Imaging Systems Market Revenue (Million) Forecast, by Application 2019 & 2032
- Table 12: France IR and Thermal Imaging Systems Market Revenue (Million) Forecast, by Application 2019 & 2032
- Table 13: Rest of Europe IR and Thermal Imaging Systems Market Revenue (Million) Forecast, by Application 2019 & 2032
- Table 14: Global IR and Thermal Imaging Systems Market Revenue Million Forecast, by Country 2019 & 2032
- Table 15: China IR and Thermal Imaging Systems Market Revenue (Million) Forecast, by Application 2019 & 2032
- Table 16: Japan IR and Thermal Imaging Systems Market Revenue (Million) Forecast, by Application 2019 & 2032
- Table 17: India IR and Thermal Imaging Systems Market Revenue (Million) Forecast, by Application 2019 & 2032
- Table 18: Rest of Asia Pacific IR and Thermal Imaging Systems Market Revenue (Million) Forecast, by Application 2019 & 2032
- Table 19: Global IR and Thermal Imaging Systems Market Revenue Million Forecast, by Country 2019 & 2032
- Table 20: Brazil IR and Thermal Imaging Systems Market Revenue (Million) Forecast, by Application 2019 & 2032
- Table 21: Mexico IR and Thermal Imaging Systems Market Revenue (Million) Forecast, by Application 2019 & 2032
- Table 22: Argentina IR and Thermal Imaging Systems Market Revenue (Million) Forecast, by Application 2019 & 2032
- Table 23: Rest of Latin America IR and Thermal Imaging Systems Market Revenue (Million) Forecast, by Application 2019 & 2032
- Table 24: Global IR and Thermal Imaging Systems Market Revenue Million Forecast, by Country 2019 & 2032
- Table 25: IR and Thermal Imaging Systems Market Revenue (Million) Forecast, by Application 2019 & 2032
- Table 26: Global IR and Thermal Imaging Systems Market Revenue Million Forecast, by Country 2019 & 2032
- Table 27: United Arab Emirates IR and Thermal Imaging Systems Market Revenue (Million) Forecast, by Application 2019 & 2032
- Table 28: South Africa IR and Thermal Imaging Systems Market Revenue (Million) Forecast, by Application 2019 & 2032
- Table 29: Rest of Middle East IR and Thermal Imaging Systems Market Revenue (Million) Forecast, by Application 2019 & 2032
- Table 30: Global IR and Thermal Imaging Systems Market Revenue Million Forecast, by Solutions 2019 & 2032
- Table 31: Global IR and Thermal Imaging Systems Market Revenue Million Forecast, by Applications 2019 & 2032
- Table 32: Global IR and Thermal Imaging Systems Market Revenue Million Forecast, by Form Factor 2019 & 2032
- Table 33: Global IR and Thermal Imaging Systems Market Revenue Million Forecast, by Country 2019 & 2032
- Table 34: United States IR and Thermal Imaging Systems Market Revenue (Million) Forecast, by Application 2019 & 2032
- Table 35: Canada IR and Thermal Imaging Systems Market Revenue (Million) Forecast, by Application 2019 & 2032
- Table 36: Global IR and Thermal Imaging Systems Market Revenue Million Forecast, by Solutions 2019 & 2032
- Table 37: Global IR and Thermal Imaging Systems Market Revenue Million Forecast, by Applications 2019 & 2032
- Table 38: Global IR and Thermal Imaging Systems Market Revenue Million Forecast, by Form Factor 2019 & 2032
- Table 39: Global IR and Thermal Imaging Systems Market Revenue Million Forecast, by Country 2019 & 2032
- Table 40: United Kingdom IR and Thermal Imaging Systems Market Revenue (Million) Forecast, by Application 2019 & 2032
- Table 41: Germany IR and Thermal Imaging Systems Market Revenue (Million) Forecast, by Application 2019 & 2032
- Table 42: France IR and Thermal Imaging Systems Market Revenue (Million) Forecast, by Application 2019 & 2032
- Table 43: Global IR and Thermal Imaging Systems Market Revenue Million Forecast, by Solutions 2019 & 2032
- Table 44: Global IR and Thermal Imaging Systems Market Revenue Million Forecast, by Applications 2019 & 2032
- Table 45: Global IR and Thermal Imaging Systems Market Revenue Million Forecast, by Form Factor 2019 & 2032
- Table 46: Global IR and Thermal Imaging Systems Market Revenue Million Forecast, by Country 2019 & 2032
- Table 47: China IR and Thermal Imaging Systems Market Revenue (Million) Forecast, by Application 2019 & 2032
- Table 48: Japan IR and Thermal Imaging Systems Market Revenue (Million) Forecast, by Application 2019 & 2032
- Table 49: India IR and Thermal Imaging Systems Market Revenue (Million) Forecast, by Application 2019 & 2032
- Table 50: Global IR and Thermal Imaging Systems Market Revenue Million Forecast, by Solutions 2019 & 2032
- Table 51: Global IR and Thermal Imaging Systems Market Revenue Million Forecast, by Applications 2019 & 2032
- Table 52: Global IR and Thermal Imaging Systems Market Revenue Million Forecast, by Form Factor 2019 & 2032
- Table 53: Global IR and Thermal Imaging Systems Market Revenue Million Forecast, by Country 2019 & 2032
- Table 54: Global IR and Thermal Imaging Systems Market Revenue Million Forecast, by Solutions 2019 & 2032
- Table 55: Global IR and Thermal Imaging Systems Market Revenue Million Forecast, by Applications 2019 & 2032
- Table 56: Global IR and Thermal Imaging Systems Market Revenue Million Forecast, by Form Factor 2019 & 2032
- Table 57: Global IR and Thermal Imaging Systems Market Revenue Million Forecast, by Country 2019 & 2032
- Table 58: Brazil IR and Thermal Imaging Systems Market Revenue (Million) Forecast, by Application 2019 & 2032
- Table 59: Mexico IR and Thermal Imaging Systems Market Revenue (Million) Forecast, by Application 2019 & 2032
- Table 60: Argentina IR and Thermal Imaging Systems Market Revenue (Million) Forecast, by Application 2019 & 2032
- Table 61: Global IR and Thermal Imaging Systems Market Revenue Million Forecast, by Solutions 2019 & 2032
- Table 62: Global IR and Thermal Imaging Systems Market Revenue Million Forecast, by Applications 2019 & 2032
- Table 63: Global IR and Thermal Imaging Systems Market Revenue Million Forecast, by Form Factor 2019 & 2032
- Table 64: Global IR and Thermal Imaging Systems Market Revenue Million Forecast, by Country 2019 & 2032
- Table 65: Saudi Arabia IR and Thermal Imaging Systems Market Revenue (Million) Forecast, by Application 2019 & 2032
- Table 66: United Arab Emirates IR and Thermal Imaging Systems Market Revenue (Million) Forecast, by Application 2019 & 2032
- Table 67: South Africa IR and Thermal Imaging Systems Market Revenue (Million) Forecast, by Application 2019 & 2032
Frequently Asked Questions
1. What is the projected Compound Annual Growth Rate (CAGR) of the IR and Thermal Imaging Systems Market?
The projected CAGR is approximately 9.84%.
2. Which companies are prominent players in the IR and Thermal Imaging Systems Market?
Key companies in the market include Thermoteknix Systems Ltd *List Not Exhaustive, Elbit Systems Ltd, Bae Systems PLC, Lockheed Martin, Raytheon, ULIS, Leonardo DRS, L-3 Communications Holdings, Flir Systems Inc, Sofradir Group.
3. What are the main segments of the IR and Thermal Imaging Systems Market?
The market segments include Solutions, Applications, Form Factor.
4. Can you provide details about the market size?
The market size is estimated to be USD XX Million as of 2022.
5. What are some drivers contributing to market growth?
; Low Cost Solutions; Increasing Usage Across Industries; Low Impact on the Environment.
6. What are the notable trends driving market growth?
Industrial Applications are Expected to Have a Major Market Share.
7. Are there any restraints impacting market growth?
; Lack of Regular Support and Services.
8. Can you provide examples of recent developments in the market?
N/A
9. What pricing options are available for accessing the report?
Pricing options include single-user, multi-user, and enterprise licenses priced at USD 4750, USD 5250, and USD 8750 respectively.
10. Is the market size provided in terms of value or volume?
The market size is provided in terms of value, measured in Million.
11. Are there any specific market keywords associated with the report?
Yes, the market keyword associated with the report is "IR and Thermal Imaging Systems Market," which aids in identifying and referencing the specific market segment covered.
12. How do I determine which pricing option suits my needs best?
The pricing options vary based on user requirements and access needs. Individual users may opt for single-user licenses, while businesses requiring broader access may choose multi-user or enterprise licenses for cost-effective access to the report.
13. Are there any additional resources or data provided in the IR and Thermal Imaging Systems Market report?
While the report offers comprehensive insights, it's advisable to review the specific contents or supplementary materials provided to ascertain if additional resources or data are available.
14. How can I stay updated on further developments or reports in the IR and Thermal Imaging Systems Market?
To stay informed about further developments, trends, and reports in the IR and Thermal Imaging Systems Market, consider subscribing to industry newsletters, following relevant companies and organizations, or regularly checking reputable industry news sources and publications.
Methodology
Step 1 - Identification of Relevant Samples Size from Population Database


Step 2 - Approaches for Defining Global Market Size (Value, Volume* & Price*)

Note*: In applicable scenarios
Step 3 - Data Sources
Primary Research
- Web Analytics
- Survey Reports
- Research Institute
- Latest Research Reports
- Opinion Leaders
Secondary Research
- Annual Reports
- White Paper
- Latest Press Release
- Industry Association
- Paid Database
- Investor Presentations

Step 4 - Data Triangulation
Involves using different sources of information in order to increase the validity of a study
These sources are likely to be stakeholders in a program - participants, other researchers, program staff, other community members, and so on.
Then we put all data in single framework & apply various statistical tools to find out the dynamic on the market.
During the analysis stage, feedback from the stakeholder groups would be compared to determine areas of agreement as well as areas of divergence


