
Key Insights
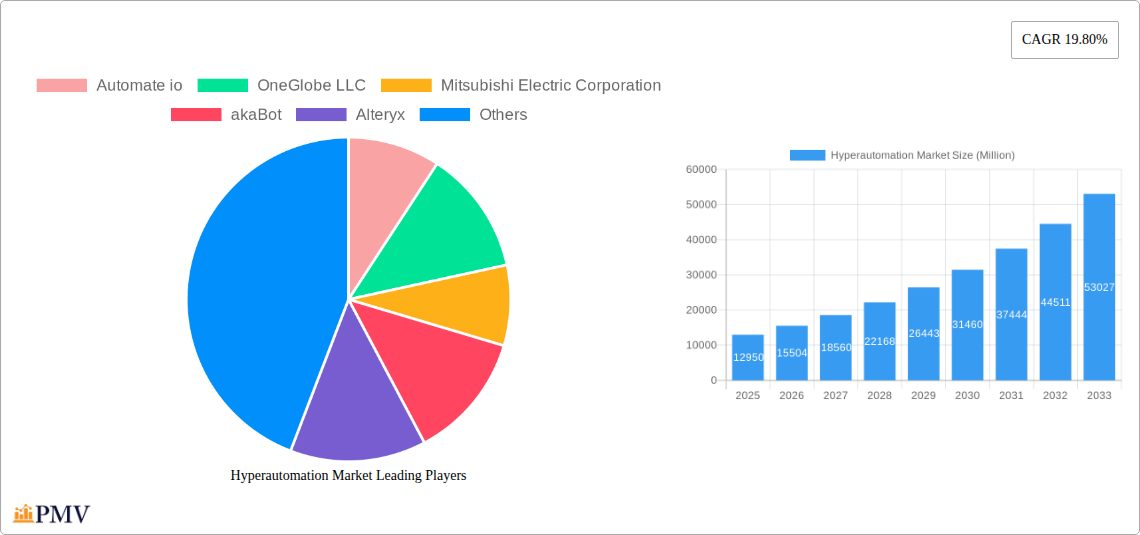
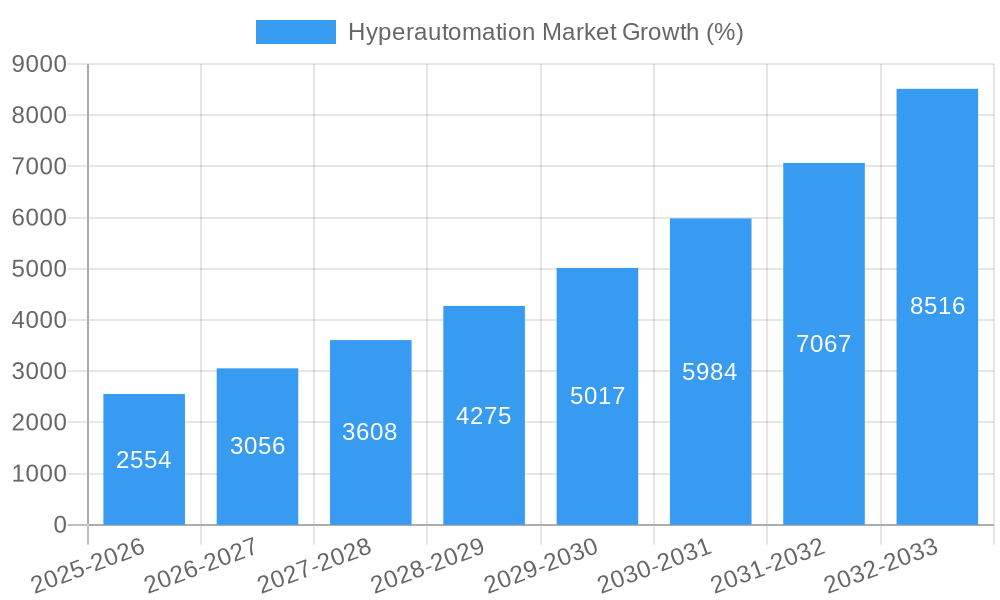
The hyperautomation market is experiencing rapid growth, projected to reach a substantial size with a Compound Annual Growth Rate (CAGR) of 19.80% between 2025 and 2033. This expansion is fueled by several key drivers, including the increasing need for enhanced operational efficiency across various industries, the rising adoption of cloud-based solutions enabling scalability and flexibility, and the growing availability of sophisticated automation tools. Businesses are leveraging hyperautomation to streamline processes, reduce operational costs, improve accuracy, and enhance customer experience. The BFSI (Banking, Financial Services, and Insurance), retail, and IT & Telecom sectors are currently leading the adoption, but significant growth is anticipated in other sectors like healthcare and manufacturing as they embrace digital transformation strategies. The diverse range of technologies encompassed by hyperautomation, including robotic process automation (RPA), machine learning (ML), and artificial intelligence (AI)-powered chatbots, contributes to its widespread appeal and versatility.
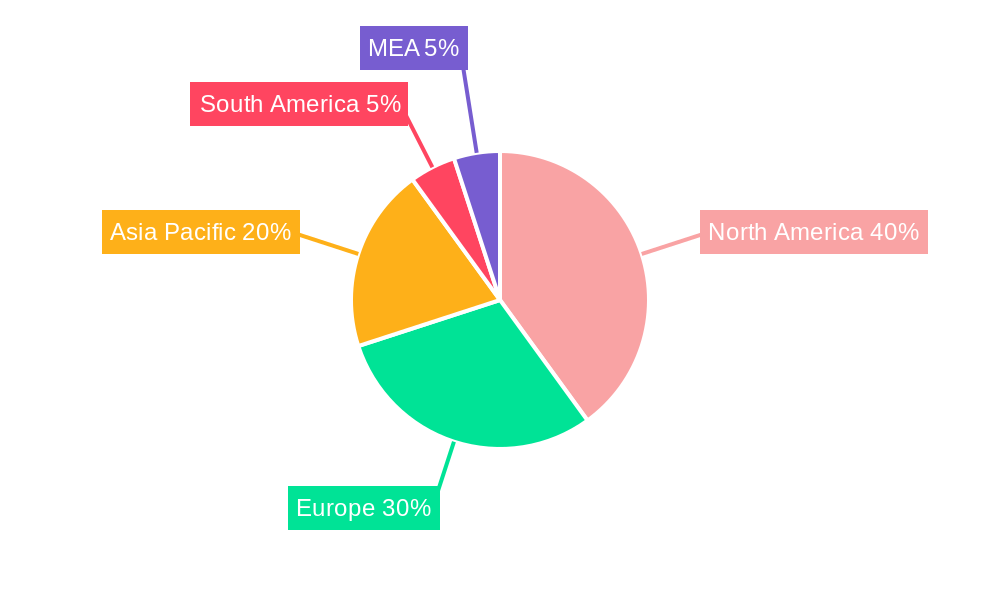
The market segmentation reveals a diverse landscape. Biometrics, context-aware computing, and natural language generation (NLG) are emerging as key technological drivers, alongside established technologies like RPA and ML. Geographically, North America and Europe currently hold significant market share, but the Asia-Pacific region is poised for substantial growth driven by increasing digitalization and technological advancements in countries like China and India. Competitive pressures are high, with a range of established players and emerging startups vying for market share. Companies like UiPath, Automation Anywhere, and others are constantly innovating to offer advanced solutions and cater to the evolving needs of businesses. While challenges exist, such as the need for skilled professionals and concerns regarding data security, the overall market outlook for hyperautomation remains exceptionally positive.
Hyperautomation Market: A Comprehensive Report (2019-2033)
This comprehensive report provides an in-depth analysis of the Hyperautomation Market, covering market size, growth drivers, challenges, competitive landscape, and future outlook. The study period spans from 2019 to 2033, with 2025 as the base and estimated year. The report offers actionable insights for stakeholders across various segments, including technology types and end-user industries. The market is projected to reach xx Million by 2033, exhibiting a robust CAGR of xx% during the forecast period (2025-2033).
Hyperautomation Market Market Structure & Competitive Dynamics
The Hyperautomation market exhibits a moderately consolidated structure, with key players holding significant market share. However, the market is dynamic, characterized by ongoing innovation, mergers and acquisitions (M&A) activity, and the emergence of new technologies. The competitive landscape is further shaped by regulatory frameworks that impact data privacy and security. Product substitution, primarily from simpler automation solutions, poses a moderate challenge. End-user trends towards increased digital transformation and automation are driving market growth.
- Market Concentration: The top 5 players hold an estimated xx% market share in 2025.
- Innovation Ecosystems: Significant investments in R&D and strategic partnerships are fostering innovation, particularly in areas such as AI/ML integration and low-code/no-code platforms.
- Regulatory Frameworks: Compliance with data privacy regulations (e.g., GDPR, CCPA) significantly impacts market dynamics and vendor strategies.
- Product Substitutes: Simpler automation tools and legacy systems compete with comprehensive hyperautomation solutions.
- End-User Trends: Growing demand for enhanced efficiency, reduced operational costs, and improved customer experience drives adoption.
- M&A Activities: The past five years have seen xx M&A deals valued at approximately xx Million, reflecting strategic consolidation within the market. Examples include alliances like the UiPath and OutSystems partnership (September 2022).
Hyperautomation Market Industry Trends & Insights
The Hyperautomation market is experiencing rapid growth, driven by several key factors. The increasing adoption of cloud-based solutions, the rise of artificial intelligence (AI) and machine learning (ML), and the growing need for process optimization across various industries are major contributors. Furthermore, the shift towards digital transformation and the increasing availability of low-code/no-code platforms are lowering the barrier to entry for businesses of all sizes. However, the market also faces challenges such as the skills gap in automation expertise, the need for robust data security measures, and the complexity of integrating various automation technologies. The market penetration of hyperautomation solutions is expected to reach xx% by 2033, reflecting significant growth from its current level.
Dominant Markets & Segments in Hyperautomation Market
The North American region is currently the dominant market for hyperautomation solutions, followed by Europe and Asia-Pacific. Within specific segments:
- By Technology Type: Robotic Process Automation (RPA) currently holds the largest market share, followed by Machine Learning (ML). However, the adoption of other technologies like Chatbots, Biometrics, and Context-Aware Computing is rapidly increasing.
- By End-User Industry: The BFSI (Banking, Financial Services, and Insurance) sector is a significant adopter of hyperautomation, driven by the need for regulatory compliance and operational efficiency. Other key sectors include Manufacturing, Healthcare & Life Science, and IT & Telecom.
Key Drivers by Region/Segment:
- North America: Strong technological advancements, high digital maturity, and significant investments in automation initiatives.
- BFSI: Strict regulatory compliance requirements, the need to enhance fraud detection, and the imperative to optimize customer service operations.
- Manufacturing: Demand for improved supply chain visibility, reduced production costs, and increased operational efficiency.
Hyperautomation Market Product Innovations
Recent product innovations focus on enhancing user experience through low-code/no-code interfaces, integrating AI/ML capabilities for intelligent automation, and improving scalability and interoperability. Platforms are evolving to offer comprehensive solutions encompassing process orchestration, data management, and advanced analytics. The market is witnessing a trend towards cloud-based deployments, enabling greater flexibility and accessibility. This aligns well with the market need for seamless integration with existing enterprise systems and easy deployment to accelerate digital transformation.
Report Segmentation & Scope
This report segments the Hyperautomation market by Technology Type (Biometrics, Context-Aware Computing, Natural Learning Generation, Chatbots, Robotic Process Automation, Machine Learning) and by End-User Industry (BFSI, Retail, IT & Telecom, Education, Automotive, Manufacturing, Healthcare & Life Science). Each segment's growth projections, market sizes, and competitive dynamics are analyzed in detail within the report. The forecast period is from 2025 to 2033.
Key Drivers of Hyperautomation Market Growth
Several factors contribute to the Hyperautomation market's growth. Technological advancements, particularly in AI/ML and RPA, are key drivers. The increasing need for operational efficiency and cost reduction across various industries, coupled with favorable government regulations promoting digital transformation, fuels market expansion. The rising adoption of cloud-based solutions provides scalability and accessibility, further stimulating growth.
Challenges in the Hyperautomation Market Sector
The Hyperautomation market faces challenges, including the integration complexity of diverse systems, the scarcity of skilled professionals to implement and maintain hyperautomation solutions, and the high initial investment costs involved. Data security and privacy concerns, and the potential for job displacement, also pose significant hurdles to widespread adoption. These factors contribute to slower-than-expected adoption in some sectors.
Leading Players in the Hyperautomation Market Market
- Automate.io
- OneGlobe LLC
- Mitsubishi Electric Corporation
- akaBot
- Alteryx
- Automation Anywhere
- Rocketbot
- Simple Fractal
- Catalytic Inc
- SolveXia
- UiPath
Key Developments in Hyperautomation Market Sector
- September 2022: Launch of e.IQ 5.0 - Nile Edition, enhancing features for building automated business applications at scale with low-code/no-code interface.
- September 2022: UiPath and OutSystems announce alliance to combine UiPath's Business Automation Platform with OutSystems' low-code capabilities, offering improved automation solutions.
Strategic Hyperautomation Market Outlook
The Hyperautomation market presents significant growth potential. Continued technological innovation, increasing adoption across diverse industries, and the emergence of new applications will drive expansion. Strategic partnerships, M&A activity, and investments in talent development will be crucial for success in this rapidly evolving market. The focus on user-friendly interfaces and seamless integration with existing systems will be key differentiators.
Hyperautomation Market Segmentation
-
1. Technology Type
- 1.1. RPA
- 1.2. AI/ML
- 1.3. Biometrics
- 1.4. Context-Aware Computing
- 1.5. Natural Learning Generation
-
2. End-User Industry
- 2.1. BFSI
- 2.2. Retail
- 2.3. IT & Telecom
- 2.4. Education
- 2.5. Automotive
- 2.6. Manufacturing
- 2.7. Healthcare & Life Science
Hyperautomation Market Segmentation By Geography
- 1. North America
- 2. Asia Pacific
- 3. Europe
- 4. Latin America
- 5. Middle East and Africa
Hyperautomation Market REPORT HIGHLIGHTS
| Aspects | Details |
|---|---|
| Study Period | 2019-2033 |
| Base Year | 2024 |
| Estimated Year | 2025 |
| Forecast Period | 2025-2033 |
| Historical Period | 2019-2024 |
| Growth Rate | CAGR of 19.80% from 2019-2033 |
| Segmentation |
|
Table of Contents
- 1. Introduction
- 1.1. Research Scope
- 1.2. Market Segmentation
- 1.3. Research Methodology
- 1.4. Definitions and Assumptions
- 2. Executive Summary
- 2.1. Introduction
- 3. Market Dynamics
- 3.1. Introduction
- 3.2. Market Drivers
- 3.2.1 Increasing Automation Trends in the Manufacturing Sector; Increased penetration of digitalization
- 3.2.2 coupled with growing demand for improved efficiency and reduced operating costs; Growing applications of RPA and AI
- 3.3. Market Restrains
- 3.3.1. High initial cost of adoption; Lack of skilled personnel
- 3.4. Market Trends
- 3.4.1. The Machine Learning Segment is Expected to Drive the Market's Growth
- 4. Market Factor Analysis
- 4.1. Porters Five Forces
- 4.2. Supply/Value Chain
- 4.3. PESTEL analysis
- 4.4. Market Entropy
- 4.5. Patent/Trademark Analysis
- 5. Global Hyperautomation Market Analysis, Insights and Forecast, 2019-2031
- 5.1. Market Analysis, Insights and Forecast - by Technology Type
- 5.1.1. RPA
- 5.1.2. AI/ML
- 5.1.3. Biometrics
- 5.1.4. Context-Aware Computing
- 5.1.5. Natural Learning Generation
- 5.2. Market Analysis, Insights and Forecast - by End-User Industry
- 5.2.1. BFSI
- 5.2.2. Retail
- 5.2.3. IT & Telecom
- 5.2.4. Education
- 5.2.5. Automotive
- 5.2.6. Manufacturing
- 5.2.7. Healthcare & Life Science
- 5.3. Market Analysis, Insights and Forecast - by Region
- 5.3.1. North America
- 5.3.2. Asia Pacific
- 5.3.3. Europe
- 5.3.4. Latin America
- 5.3.5. Middle East and Africa
- 5.1. Market Analysis, Insights and Forecast - by Technology Type
- 6. North America Hyperautomation Market Analysis, Insights and Forecast, 2019-2031
- 6.1. Market Analysis, Insights and Forecast - by Technology Type
- 6.1.1. RPA
- 6.1.2. AI/ML
- 6.1.3. Biometrics
- 6.1.4. Context-Aware Computing
- 6.1.5. Natural Learning Generation
- 6.2. Market Analysis, Insights and Forecast - by End-User Industry
- 6.2.1. BFSI
- 6.2.2. Retail
- 6.2.3. IT & Telecom
- 6.2.4. Education
- 6.2.5. Automotive
- 6.2.6. Manufacturing
- 6.2.7. Healthcare & Life Science
- 6.1. Market Analysis, Insights and Forecast - by Technology Type
- 7. Asia Pacific Hyperautomation Market Analysis, Insights and Forecast, 2019-2031
- 7.1. Market Analysis, Insights and Forecast - by Technology Type
- 7.1.1. RPA
- 7.1.2. AI/ML
- 7.1.3. Biometrics
- 7.1.4. Context-Aware Computing
- 7.1.5. Natural Learning Generation
- 7.2. Market Analysis, Insights and Forecast - by End-User Industry
- 7.2.1. BFSI
- 7.2.2. Retail
- 7.2.3. IT & Telecom
- 7.2.4. Education
- 7.2.5. Automotive
- 7.2.6. Manufacturing
- 7.2.7. Healthcare & Life Science
- 7.1. Market Analysis, Insights and Forecast - by Technology Type
- 8. Europe Hyperautomation Market Analysis, Insights and Forecast, 2019-2031
- 8.1. Market Analysis, Insights and Forecast - by Technology Type
- 8.1.1. RPA
- 8.1.2. AI/ML
- 8.1.3. Biometrics
- 8.1.4. Context-Aware Computing
- 8.1.5. Natural Learning Generation
- 8.2. Market Analysis, Insights and Forecast - by End-User Industry
- 8.2.1. BFSI
- 8.2.2. Retail
- 8.2.3. IT & Telecom
- 8.2.4. Education
- 8.2.5. Automotive
- 8.2.6. Manufacturing
- 8.2.7. Healthcare & Life Science
- 8.1. Market Analysis, Insights and Forecast - by Technology Type
- 9. Latin America Hyperautomation Market Analysis, Insights and Forecast, 2019-2031
- 9.1. Market Analysis, Insights and Forecast - by Technology Type
- 9.1.1. RPA
- 9.1.2. AI/ML
- 9.1.3. Biometrics
- 9.1.4. Context-Aware Computing
- 9.1.5. Natural Learning Generation
- 9.2. Market Analysis, Insights and Forecast - by End-User Industry
- 9.2.1. BFSI
- 9.2.2. Retail
- 9.2.3. IT & Telecom
- 9.2.4. Education
- 9.2.5. Automotive
- 9.2.6. Manufacturing
- 9.2.7. Healthcare & Life Science
- 9.1. Market Analysis, Insights and Forecast - by Technology Type
- 10. Middle East and Africa Hyperautomation Market Analysis, Insights and Forecast, 2019-2031
- 10.1. Market Analysis, Insights and Forecast - by Technology Type
- 10.1.1. RPA
- 10.1.2. AI/ML
- 10.1.3. Biometrics
- 10.1.4. Context-Aware Computing
- 10.1.5. Natural Learning Generation
- 10.2. Market Analysis, Insights and Forecast - by End-User Industry
- 10.2.1. BFSI
- 10.2.2. Retail
- 10.2.3. IT & Telecom
- 10.2.4. Education
- 10.2.5. Automotive
- 10.2.6. Manufacturing
- 10.2.7. Healthcare & Life Science
- 10.1. Market Analysis, Insights and Forecast - by Technology Type
- 11. North America Hyperautomation Market Analysis, Insights and Forecast, 2019-2031
- 11.1. Market Analysis, Insights and Forecast - By Country/Sub-region
- 11.1.1 United States
- 11.1.2 Canada
- 11.1.3 Mexico
- 12. Europe Hyperautomation Market Analysis, Insights and Forecast, 2019-2031
- 12.1. Market Analysis, Insights and Forecast - By Country/Sub-region
- 12.1.1 Germany
- 12.1.2 United Kingdom
- 12.1.3 France
- 12.1.4 Spain
- 12.1.5 Italy
- 12.1.6 Spain
- 12.1.7 Belgium
- 12.1.8 Netherland
- 12.1.9 Nordics
- 12.1.10 Rest of Europe
- 13. Asia Pacific Hyperautomation Market Analysis, Insights and Forecast, 2019-2031
- 13.1. Market Analysis, Insights and Forecast - By Country/Sub-region
- 13.1.1 China
- 13.1.2 Japan
- 13.1.3 India
- 13.1.4 South Korea
- 13.1.5 Southeast Asia
- 13.1.6 Australia
- 13.1.7 Indonesia
- 13.1.8 Phillipes
- 13.1.9 Singapore
- 13.1.10 Thailandc
- 13.1.11 Rest of Asia Pacific
- 14. South America Hyperautomation Market Analysis, Insights and Forecast, 2019-2031
- 14.1. Market Analysis, Insights and Forecast - By Country/Sub-region
- 14.1.1 Brazil
- 14.1.2 Argentina
- 14.1.3 Peru
- 14.1.4 Chile
- 14.1.5 Colombia
- 14.1.6 Ecuador
- 14.1.7 Venezuela
- 14.1.8 Rest of South America
- 15. North America Hyperautomation Market Analysis, Insights and Forecast, 2019-2031
- 15.1. Market Analysis, Insights and Forecast - By Country/Sub-region
- 15.1.1 United States
- 15.1.2 Canada
- 15.1.3 Mexico
- 16. MEA Hyperautomation Market Analysis, Insights and Forecast, 2019-2031
- 16.1. Market Analysis, Insights and Forecast - By Country/Sub-region
- 16.1.1 United Arab Emirates
- 16.1.2 Saudi Arabia
- 16.1.3 South Africa
- 16.1.4 Rest of Middle East and Africa
- 17. Competitive Analysis
- 17.1. Global Market Share Analysis 2024
- 17.2. Company Profiles
- 17.2.1 Automate io
- 17.2.1.1. Overview
- 17.2.1.2. Products
- 17.2.1.3. SWOT Analysis
- 17.2.1.4. Recent Developments
- 17.2.1.5. Financials (Based on Availability)
- 17.2.2 OneGlobe LLC
- 17.2.2.1. Overview
- 17.2.2.2. Products
- 17.2.2.3. SWOT Analysis
- 17.2.2.4. Recent Developments
- 17.2.2.5. Financials (Based on Availability)
- 17.2.3 Mitsubishi Electric Corporation
- 17.2.3.1. Overview
- 17.2.3.2. Products
- 17.2.3.3. SWOT Analysis
- 17.2.3.4. Recent Developments
- 17.2.3.5. Financials (Based on Availability)
- 17.2.4 akaBot
- 17.2.4.1. Overview
- 17.2.4.2. Products
- 17.2.4.3. SWOT Analysis
- 17.2.4.4. Recent Developments
- 17.2.4.5. Financials (Based on Availability)
- 17.2.5 Alteryx
- 17.2.5.1. Overview
- 17.2.5.2. Products
- 17.2.5.3. SWOT Analysis
- 17.2.5.4. Recent Developments
- 17.2.5.5. Financials (Based on Availability)
- 17.2.6 Automation Anywhere
- 17.2.6.1. Overview
- 17.2.6.2. Products
- 17.2.6.3. SWOT Analysis
- 17.2.6.4. Recent Developments
- 17.2.6.5. Financials (Based on Availability)
- 17.2.7 Rocketbot
- 17.2.7.1. Overview
- 17.2.7.2. Products
- 17.2.7.3. SWOT Analysis
- 17.2.7.4. Recent Developments
- 17.2.7.5. Financials (Based on Availability)
- 17.2.8 Simple Fractal
- 17.2.8.1. Overview
- 17.2.8.2. Products
- 17.2.8.3. SWOT Analysis
- 17.2.8.4. Recent Developments
- 17.2.8.5. Financials (Based on Availability)
- 17.2.9 Catalytic Inc
- 17.2.9.1. Overview
- 17.2.9.2. Products
- 17.2.9.3. SWOT Analysis
- 17.2.9.4. Recent Developments
- 17.2.9.5. Financials (Based on Availability)
- 17.2.10 SolveXia
- 17.2.10.1. Overview
- 17.2.10.2. Products
- 17.2.10.3. SWOT Analysis
- 17.2.10.4. Recent Developments
- 17.2.10.5. Financials (Based on Availability)
- 17.2.11 UiPath
- 17.2.11.1. Overview
- 17.2.11.2. Products
- 17.2.11.3. SWOT Analysis
- 17.2.11.4. Recent Developments
- 17.2.11.5. Financials (Based on Availability)
- 17.2.1 Automate io
List of Figures
- Figure 1: Global Hyperautomation Market Revenue Breakdown (Million, %) by Region 2024 & 2032
- Figure 2: Global Hyperautomation Market Volume Breakdown (K Unit, %) by Region 2024 & 2032
- Figure 3: North America Hyperautomation Market Revenue (Million), by Country 2024 & 2032
- Figure 4: North America Hyperautomation Market Volume (K Unit), by Country 2024 & 2032
- Figure 5: North America Hyperautomation Market Revenue Share (%), by Country 2024 & 2032
- Figure 6: North America Hyperautomation Market Volume Share (%), by Country 2024 & 2032
- Figure 7: Europe Hyperautomation Market Revenue (Million), by Country 2024 & 2032
- Figure 8: Europe Hyperautomation Market Volume (K Unit), by Country 2024 & 2032
- Figure 9: Europe Hyperautomation Market Revenue Share (%), by Country 2024 & 2032
- Figure 10: Europe Hyperautomation Market Volume Share (%), by Country 2024 & 2032
- Figure 11: Asia Pacific Hyperautomation Market Revenue (Million), by Country 2024 & 2032
- Figure 12: Asia Pacific Hyperautomation Market Volume (K Unit), by Country 2024 & 2032
- Figure 13: Asia Pacific Hyperautomation Market Revenue Share (%), by Country 2024 & 2032
- Figure 14: Asia Pacific Hyperautomation Market Volume Share (%), by Country 2024 & 2032
- Figure 15: South America Hyperautomation Market Revenue (Million), by Country 2024 & 2032
- Figure 16: South America Hyperautomation Market Volume (K Unit), by Country 2024 & 2032
- Figure 17: South America Hyperautomation Market Revenue Share (%), by Country 2024 & 2032
- Figure 18: South America Hyperautomation Market Volume Share (%), by Country 2024 & 2032
- Figure 19: North America Hyperautomation Market Revenue (Million), by Country 2024 & 2032
- Figure 20: North America Hyperautomation Market Volume (K Unit), by Country 2024 & 2032
- Figure 21: North America Hyperautomation Market Revenue Share (%), by Country 2024 & 2032
- Figure 22: North America Hyperautomation Market Volume Share (%), by Country 2024 & 2032
- Figure 23: MEA Hyperautomation Market Revenue (Million), by Country 2024 & 2032
- Figure 24: MEA Hyperautomation Market Volume (K Unit), by Country 2024 & 2032
- Figure 25: MEA Hyperautomation Market Revenue Share (%), by Country 2024 & 2032
- Figure 26: MEA Hyperautomation Market Volume Share (%), by Country 2024 & 2032
- Figure 27: North America Hyperautomation Market Revenue (Million), by Technology Type 2024 & 2032
- Figure 28: North America Hyperautomation Market Volume (K Unit), by Technology Type 2024 & 2032
- Figure 29: North America Hyperautomation Market Revenue Share (%), by Technology Type 2024 & 2032
- Figure 30: North America Hyperautomation Market Volume Share (%), by Technology Type 2024 & 2032
- Figure 31: North America Hyperautomation Market Revenue (Million), by End-User Industry 2024 & 2032
- Figure 32: North America Hyperautomation Market Volume (K Unit), by End-User Industry 2024 & 2032
- Figure 33: North America Hyperautomation Market Revenue Share (%), by End-User Industry 2024 & 2032
- Figure 34: North America Hyperautomation Market Volume Share (%), by End-User Industry 2024 & 2032
- Figure 35: North America Hyperautomation Market Revenue (Million), by Country 2024 & 2032
- Figure 36: North America Hyperautomation Market Volume (K Unit), by Country 2024 & 2032
- Figure 37: North America Hyperautomation Market Revenue Share (%), by Country 2024 & 2032
- Figure 38: North America Hyperautomation Market Volume Share (%), by Country 2024 & 2032
- Figure 39: Asia Pacific Hyperautomation Market Revenue (Million), by Technology Type 2024 & 2032
- Figure 40: Asia Pacific Hyperautomation Market Volume (K Unit), by Technology Type 2024 & 2032
- Figure 41: Asia Pacific Hyperautomation Market Revenue Share (%), by Technology Type 2024 & 2032
- Figure 42: Asia Pacific Hyperautomation Market Volume Share (%), by Technology Type 2024 & 2032
- Figure 43: Asia Pacific Hyperautomation Market Revenue (Million), by End-User Industry 2024 & 2032
- Figure 44: Asia Pacific Hyperautomation Market Volume (K Unit), by End-User Industry 2024 & 2032
- Figure 45: Asia Pacific Hyperautomation Market Revenue Share (%), by End-User Industry 2024 & 2032
- Figure 46: Asia Pacific Hyperautomation Market Volume Share (%), by End-User Industry 2024 & 2032
- Figure 47: Asia Pacific Hyperautomation Market Revenue (Million), by Country 2024 & 2032
- Figure 48: Asia Pacific Hyperautomation Market Volume (K Unit), by Country 2024 & 2032
- Figure 49: Asia Pacific Hyperautomation Market Revenue Share (%), by Country 2024 & 2032
- Figure 50: Asia Pacific Hyperautomation Market Volume Share (%), by Country 2024 & 2032
- Figure 51: Europe Hyperautomation Market Revenue (Million), by Technology Type 2024 & 2032
- Figure 52: Europe Hyperautomation Market Volume (K Unit), by Technology Type 2024 & 2032
- Figure 53: Europe Hyperautomation Market Revenue Share (%), by Technology Type 2024 & 2032
- Figure 54: Europe Hyperautomation Market Volume Share (%), by Technology Type 2024 & 2032
- Figure 55: Europe Hyperautomation Market Revenue (Million), by End-User Industry 2024 & 2032
- Figure 56: Europe Hyperautomation Market Volume (K Unit), by End-User Industry 2024 & 2032
- Figure 57: Europe Hyperautomation Market Revenue Share (%), by End-User Industry 2024 & 2032
- Figure 58: Europe Hyperautomation Market Volume Share (%), by End-User Industry 2024 & 2032
- Figure 59: Europe Hyperautomation Market Revenue (Million), by Country 2024 & 2032
- Figure 60: Europe Hyperautomation Market Volume (K Unit), by Country 2024 & 2032
- Figure 61: Europe Hyperautomation Market Revenue Share (%), by Country 2024 & 2032
- Figure 62: Europe Hyperautomation Market Volume Share (%), by Country 2024 & 2032
- Figure 63: Latin America Hyperautomation Market Revenue (Million), by Technology Type 2024 & 2032
- Figure 64: Latin America Hyperautomation Market Volume (K Unit), by Technology Type 2024 & 2032
- Figure 65: Latin America Hyperautomation Market Revenue Share (%), by Technology Type 2024 & 2032
- Figure 66: Latin America Hyperautomation Market Volume Share (%), by Technology Type 2024 & 2032
- Figure 67: Latin America Hyperautomation Market Revenue (Million), by End-User Industry 2024 & 2032
- Figure 68: Latin America Hyperautomation Market Volume (K Unit), by End-User Industry 2024 & 2032
- Figure 69: Latin America Hyperautomation Market Revenue Share (%), by End-User Industry 2024 & 2032
- Figure 70: Latin America Hyperautomation Market Volume Share (%), by End-User Industry 2024 & 2032
- Figure 71: Latin America Hyperautomation Market Revenue (Million), by Country 2024 & 2032
- Figure 72: Latin America Hyperautomation Market Volume (K Unit), by Country 2024 & 2032
- Figure 73: Latin America Hyperautomation Market Revenue Share (%), by Country 2024 & 2032
- Figure 74: Latin America Hyperautomation Market Volume Share (%), by Country 2024 & 2032
- Figure 75: Middle East and Africa Hyperautomation Market Revenue (Million), by Technology Type 2024 & 2032
- Figure 76: Middle East and Africa Hyperautomation Market Volume (K Unit), by Technology Type 2024 & 2032
- Figure 77: Middle East and Africa Hyperautomation Market Revenue Share (%), by Technology Type 2024 & 2032
- Figure 78: Middle East and Africa Hyperautomation Market Volume Share (%), by Technology Type 2024 & 2032
- Figure 79: Middle East and Africa Hyperautomation Market Revenue (Million), by End-User Industry 2024 & 2032
- Figure 80: Middle East and Africa Hyperautomation Market Volume (K Unit), by End-User Industry 2024 & 2032
- Figure 81: Middle East and Africa Hyperautomation Market Revenue Share (%), by End-User Industry 2024 & 2032
- Figure 82: Middle East and Africa Hyperautomation Market Volume Share (%), by End-User Industry 2024 & 2032
- Figure 83: Middle East and Africa Hyperautomation Market Revenue (Million), by Country 2024 & 2032
- Figure 84: Middle East and Africa Hyperautomation Market Volume (K Unit), by Country 2024 & 2032
- Figure 85: Middle East and Africa Hyperautomation Market Revenue Share (%), by Country 2024 & 2032
- Figure 86: Middle East and Africa Hyperautomation Market Volume Share (%), by Country 2024 & 2032
List of Tables
- Table 1: Global Hyperautomation Market Revenue Million Forecast, by Region 2019 & 2032
- Table 2: Global Hyperautomation Market Volume K Unit Forecast, by Region 2019 & 2032
- Table 3: Global Hyperautomation Market Revenue Million Forecast, by Technology Type 2019 & 2032
- Table 4: Global Hyperautomation Market Volume K Unit Forecast, by Technology Type 2019 & 2032
- Table 5: Global Hyperautomation Market Revenue Million Forecast, by End-User Industry 2019 & 2032
- Table 6: Global Hyperautomation Market Volume K Unit Forecast, by End-User Industry 2019 & 2032
- Table 7: Global Hyperautomation Market Revenue Million Forecast, by Region 2019 & 2032
- Table 8: Global Hyperautomation Market Volume K Unit Forecast, by Region 2019 & 2032
- Table 9: Global Hyperautomation Market Revenue Million Forecast, by Country 2019 & 2032
- Table 10: Global Hyperautomation Market Volume K Unit Forecast, by Country 2019 & 2032
- Table 11: United States Hyperautomation Market Revenue (Million) Forecast, by Application 2019 & 2032
- Table 12: United States Hyperautomation Market Volume (K Unit) Forecast, by Application 2019 & 2032
- Table 13: Canada Hyperautomation Market Revenue (Million) Forecast, by Application 2019 & 2032
- Table 14: Canada Hyperautomation Market Volume (K Unit) Forecast, by Application 2019 & 2032
- Table 15: Mexico Hyperautomation Market Revenue (Million) Forecast, by Application 2019 & 2032
- Table 16: Mexico Hyperautomation Market Volume (K Unit) Forecast, by Application 2019 & 2032
- Table 17: Global Hyperautomation Market Revenue Million Forecast, by Country 2019 & 2032
- Table 18: Global Hyperautomation Market Volume K Unit Forecast, by Country 2019 & 2032
- Table 19: Germany Hyperautomation Market Revenue (Million) Forecast, by Application 2019 & 2032
- Table 20: Germany Hyperautomation Market Volume (K Unit) Forecast, by Application 2019 & 2032
- Table 21: United Kingdom Hyperautomation Market Revenue (Million) Forecast, by Application 2019 & 2032
- Table 22: United Kingdom Hyperautomation Market Volume (K Unit) Forecast, by Application 2019 & 2032
- Table 23: France Hyperautomation Market Revenue (Million) Forecast, by Application 2019 & 2032
- Table 24: France Hyperautomation Market Volume (K Unit) Forecast, by Application 2019 & 2032
- Table 25: Spain Hyperautomation Market Revenue (Million) Forecast, by Application 2019 & 2032
- Table 26: Spain Hyperautomation Market Volume (K Unit) Forecast, by Application 2019 & 2032
- Table 27: Italy Hyperautomation Market Revenue (Million) Forecast, by Application 2019 & 2032
- Table 28: Italy Hyperautomation Market Volume (K Unit) Forecast, by Application 2019 & 2032
- Table 29: Spain Hyperautomation Market Revenue (Million) Forecast, by Application 2019 & 2032
- Table 30: Spain Hyperautomation Market Volume (K Unit) Forecast, by Application 2019 & 2032
- Table 31: Belgium Hyperautomation Market Revenue (Million) Forecast, by Application 2019 & 2032
- Table 32: Belgium Hyperautomation Market Volume (K Unit) Forecast, by Application 2019 & 2032
- Table 33: Netherland Hyperautomation Market Revenue (Million) Forecast, by Application 2019 & 2032
- Table 34: Netherland Hyperautomation Market Volume (K Unit) Forecast, by Application 2019 & 2032
- Table 35: Nordics Hyperautomation Market Revenue (Million) Forecast, by Application 2019 & 2032
- Table 36: Nordics Hyperautomation Market Volume (K Unit) Forecast, by Application 2019 & 2032
- Table 37: Rest of Europe Hyperautomation Market Revenue (Million) Forecast, by Application 2019 & 2032
- Table 38: Rest of Europe Hyperautomation Market Volume (K Unit) Forecast, by Application 2019 & 2032
- Table 39: Global Hyperautomation Market Revenue Million Forecast, by Country 2019 & 2032
- Table 40: Global Hyperautomation Market Volume K Unit Forecast, by Country 2019 & 2032
- Table 41: China Hyperautomation Market Revenue (Million) Forecast, by Application 2019 & 2032
- Table 42: China Hyperautomation Market Volume (K Unit) Forecast, by Application 2019 & 2032
- Table 43: Japan Hyperautomation Market Revenue (Million) Forecast, by Application 2019 & 2032
- Table 44: Japan Hyperautomation Market Volume (K Unit) Forecast, by Application 2019 & 2032
- Table 45: India Hyperautomation Market Revenue (Million) Forecast, by Application 2019 & 2032
- Table 46: India Hyperautomation Market Volume (K Unit) Forecast, by Application 2019 & 2032
- Table 47: South Korea Hyperautomation Market Revenue (Million) Forecast, by Application 2019 & 2032
- Table 48: South Korea Hyperautomation Market Volume (K Unit) Forecast, by Application 2019 & 2032
- Table 49: Southeast Asia Hyperautomation Market Revenue (Million) Forecast, by Application 2019 & 2032
- Table 50: Southeast Asia Hyperautomation Market Volume (K Unit) Forecast, by Application 2019 & 2032
- Table 51: Australia Hyperautomation Market Revenue (Million) Forecast, by Application 2019 & 2032
- Table 52: Australia Hyperautomation Market Volume (K Unit) Forecast, by Application 2019 & 2032
- Table 53: Indonesia Hyperautomation Market Revenue (Million) Forecast, by Application 2019 & 2032
- Table 54: Indonesia Hyperautomation Market Volume (K Unit) Forecast, by Application 2019 & 2032
- Table 55: Phillipes Hyperautomation Market Revenue (Million) Forecast, by Application 2019 & 2032
- Table 56: Phillipes Hyperautomation Market Volume (K Unit) Forecast, by Application 2019 & 2032
- Table 57: Singapore Hyperautomation Market Revenue (Million) Forecast, by Application 2019 & 2032
- Table 58: Singapore Hyperautomation Market Volume (K Unit) Forecast, by Application 2019 & 2032
- Table 59: Thailandc Hyperautomation Market Revenue (Million) Forecast, by Application 2019 & 2032
- Table 60: Thailandc Hyperautomation Market Volume (K Unit) Forecast, by Application 2019 & 2032
- Table 61: Rest of Asia Pacific Hyperautomation Market Revenue (Million) Forecast, by Application 2019 & 2032
- Table 62: Rest of Asia Pacific Hyperautomation Market Volume (K Unit) Forecast, by Application 2019 & 2032
- Table 63: Global Hyperautomation Market Revenue Million Forecast, by Country 2019 & 2032
- Table 64: Global Hyperautomation Market Volume K Unit Forecast, by Country 2019 & 2032
- Table 65: Brazil Hyperautomation Market Revenue (Million) Forecast, by Application 2019 & 2032
- Table 66: Brazil Hyperautomation Market Volume (K Unit) Forecast, by Application 2019 & 2032
- Table 67: Argentina Hyperautomation Market Revenue (Million) Forecast, by Application 2019 & 2032
- Table 68: Argentina Hyperautomation Market Volume (K Unit) Forecast, by Application 2019 & 2032
- Table 69: Peru Hyperautomation Market Revenue (Million) Forecast, by Application 2019 & 2032
- Table 70: Peru Hyperautomation Market Volume (K Unit) Forecast, by Application 2019 & 2032
- Table 71: Chile Hyperautomation Market Revenue (Million) Forecast, by Application 2019 & 2032
- Table 72: Chile Hyperautomation Market Volume (K Unit) Forecast, by Application 2019 & 2032
- Table 73: Colombia Hyperautomation Market Revenue (Million) Forecast, by Application 2019 & 2032
- Table 74: Colombia Hyperautomation Market Volume (K Unit) Forecast, by Application 2019 & 2032
- Table 75: Ecuador Hyperautomation Market Revenue (Million) Forecast, by Application 2019 & 2032
- Table 76: Ecuador Hyperautomation Market Volume (K Unit) Forecast, by Application 2019 & 2032
- Table 77: Venezuela Hyperautomation Market Revenue (Million) Forecast, by Application 2019 & 2032
- Table 78: Venezuela Hyperautomation Market Volume (K Unit) Forecast, by Application 2019 & 2032
- Table 79: Rest of South America Hyperautomation Market Revenue (Million) Forecast, by Application 2019 & 2032
- Table 80: Rest of South America Hyperautomation Market Volume (K Unit) Forecast, by Application 2019 & 2032
- Table 81: Global Hyperautomation Market Revenue Million Forecast, by Country 2019 & 2032
- Table 82: Global Hyperautomation Market Volume K Unit Forecast, by Country 2019 & 2032
- Table 83: United States Hyperautomation Market Revenue (Million) Forecast, by Application 2019 & 2032
- Table 84: United States Hyperautomation Market Volume (K Unit) Forecast, by Application 2019 & 2032
- Table 85: Canada Hyperautomation Market Revenue (Million) Forecast, by Application 2019 & 2032
- Table 86: Canada Hyperautomation Market Volume (K Unit) Forecast, by Application 2019 & 2032
- Table 87: Mexico Hyperautomation Market Revenue (Million) Forecast, by Application 2019 & 2032
- Table 88: Mexico Hyperautomation Market Volume (K Unit) Forecast, by Application 2019 & 2032
- Table 89: Global Hyperautomation Market Revenue Million Forecast, by Country 2019 & 2032
- Table 90: Global Hyperautomation Market Volume K Unit Forecast, by Country 2019 & 2032
- Table 91: United Arab Emirates Hyperautomation Market Revenue (Million) Forecast, by Application 2019 & 2032
- Table 92: United Arab Emirates Hyperautomation Market Volume (K Unit) Forecast, by Application 2019 & 2032
- Table 93: Saudi Arabia Hyperautomation Market Revenue (Million) Forecast, by Application 2019 & 2032
- Table 94: Saudi Arabia Hyperautomation Market Volume (K Unit) Forecast, by Application 2019 & 2032
- Table 95: South Africa Hyperautomation Market Revenue (Million) Forecast, by Application 2019 & 2032
- Table 96: South Africa Hyperautomation Market Volume (K Unit) Forecast, by Application 2019 & 2032
- Table 97: Rest of Middle East and Africa Hyperautomation Market Revenue (Million) Forecast, by Application 2019 & 2032
- Table 98: Rest of Middle East and Africa Hyperautomation Market Volume (K Unit) Forecast, by Application 2019 & 2032
- Table 99: Global Hyperautomation Market Revenue Million Forecast, by Technology Type 2019 & 2032
- Table 100: Global Hyperautomation Market Volume K Unit Forecast, by Technology Type 2019 & 2032
- Table 101: Global Hyperautomation Market Revenue Million Forecast, by End-User Industry 2019 & 2032
- Table 102: Global Hyperautomation Market Volume K Unit Forecast, by End-User Industry 2019 & 2032
- Table 103: Global Hyperautomation Market Revenue Million Forecast, by Country 2019 & 2032
- Table 104: Global Hyperautomation Market Volume K Unit Forecast, by Country 2019 & 2032
- Table 105: Global Hyperautomation Market Revenue Million Forecast, by Technology Type 2019 & 2032
- Table 106: Global Hyperautomation Market Volume K Unit Forecast, by Technology Type 2019 & 2032
- Table 107: Global Hyperautomation Market Revenue Million Forecast, by End-User Industry 2019 & 2032
- Table 108: Global Hyperautomation Market Volume K Unit Forecast, by End-User Industry 2019 & 2032
- Table 109: Global Hyperautomation Market Revenue Million Forecast, by Country 2019 & 2032
- Table 110: Global Hyperautomation Market Volume K Unit Forecast, by Country 2019 & 2032
- Table 111: Global Hyperautomation Market Revenue Million Forecast, by Technology Type 2019 & 2032
- Table 112: Global Hyperautomation Market Volume K Unit Forecast, by Technology Type 2019 & 2032
- Table 113: Global Hyperautomation Market Revenue Million Forecast, by End-User Industry 2019 & 2032
- Table 114: Global Hyperautomation Market Volume K Unit Forecast, by End-User Industry 2019 & 2032
- Table 115: Global Hyperautomation Market Revenue Million Forecast, by Country 2019 & 2032
- Table 116: Global Hyperautomation Market Volume K Unit Forecast, by Country 2019 & 2032
- Table 117: Global Hyperautomation Market Revenue Million Forecast, by Technology Type 2019 & 2032
- Table 118: Global Hyperautomation Market Volume K Unit Forecast, by Technology Type 2019 & 2032
- Table 119: Global Hyperautomation Market Revenue Million Forecast, by End-User Industry 2019 & 2032
- Table 120: Global Hyperautomation Market Volume K Unit Forecast, by End-User Industry 2019 & 2032
- Table 121: Global Hyperautomation Market Revenue Million Forecast, by Country 2019 & 2032
- Table 122: Global Hyperautomation Market Volume K Unit Forecast, by Country 2019 & 2032
- Table 123: Global Hyperautomation Market Revenue Million Forecast, by Technology Type 2019 & 2032
- Table 124: Global Hyperautomation Market Volume K Unit Forecast, by Technology Type 2019 & 2032
- Table 125: Global Hyperautomation Market Revenue Million Forecast, by End-User Industry 2019 & 2032
- Table 126: Global Hyperautomation Market Volume K Unit Forecast, by End-User Industry 2019 & 2032
- Table 127: Global Hyperautomation Market Revenue Million Forecast, by Country 2019 & 2032
- Table 128: Global Hyperautomation Market Volume K Unit Forecast, by Country 2019 & 2032
Frequently Asked Questions
1. What is the projected Compound Annual Growth Rate (CAGR) of the Hyperautomation Market?
The projected CAGR is approximately 19.80%.
2. Which companies are prominent players in the Hyperautomation Market?
Key companies in the market include Automate io, OneGlobe LLC, Mitsubishi Electric Corporation, akaBot, Alteryx, Automation Anywhere, Rocketbot, Simple Fractal, Catalytic Inc, SolveXia, UiPath.
3. What are the main segments of the Hyperautomation Market?
The market segments include Technology Type, End-User Industry.
4. Can you provide details about the market size?
The market size is estimated to be USD 12.95 Million as of 2022.
5. What are some drivers contributing to market growth?
Increasing Automation Trends in the Manufacturing Sector; Increased penetration of digitalization. coupled with growing demand for improved efficiency and reduced operating costs; Growing applications of RPA and AI.
6. What are the notable trends driving market growth?
The Machine Learning Segment is Expected to Drive the Market's Growth.
7. Are there any restraints impacting market growth?
High initial cost of adoption; Lack of skilled personnel.
8. Can you provide examples of recent developments in the market?
September 2022 - The e.IQ 5.0 - Nile Edition has been launched to improve the platform's features for building automated business applications at scale. The features include process orchestration, data and event processing, AI/ML, enterprise connectors, and front-end application development, all of which use a straightforward low-code/no-code interface. In addition to introducing a taxonomy builder for multilevel taxonomy management that cuts across business domains, the release expands the unified data experience offering of the hyperautomation enablement platform, as seen in the 4.0 release. It makes data actionable for simple decision automation.
9. What pricing options are available for accessing the report?
Pricing options include single-user, multi-user, and enterprise licenses priced at USD 4750, USD 5250, and USD 8750 respectively.
10. Is the market size provided in terms of value or volume?
The market size is provided in terms of value, measured in Million and volume, measured in K Unit.
11. Are there any specific market keywords associated with the report?
Yes, the market keyword associated with the report is "Hyperautomation Market," which aids in identifying and referencing the specific market segment covered.
12. How do I determine which pricing option suits my needs best?
The pricing options vary based on user requirements and access needs. Individual users may opt for single-user licenses, while businesses requiring broader access may choose multi-user or enterprise licenses for cost-effective access to the report.
13. Are there any additional resources or data provided in the Hyperautomation Market report?
While the report offers comprehensive insights, it's advisable to review the specific contents or supplementary materials provided to ascertain if additional resources or data are available.
14. How can I stay updated on further developments or reports in the Hyperautomation Market?
To stay informed about further developments, trends, and reports in the Hyperautomation Market, consider subscribing to industry newsletters, following relevant companies and organizations, or regularly checking reputable industry news sources and publications.
Methodology
Step 1 - Identification of Relevant Samples Size from Population Database


Step 2 - Approaches for Defining Global Market Size (Value, Volume* & Price*)

Note*: In applicable scenarios
Step 3 - Data Sources
Primary Research
- Web Analytics
- Survey Reports
- Research Institute
- Latest Research Reports
- Opinion Leaders
Secondary Research
- Annual Reports
- White Paper
- Latest Press Release
- Industry Association
- Paid Database
- Investor Presentations

Step 4 - Data Triangulation
Involves using different sources of information in order to increase the validity of a study
These sources are likely to be stakeholders in a program - participants, other researchers, program staff, other community members, and so on.
Then we put all data in single framework & apply various statistical tools to find out the dynamic on the market.
During the analysis stage, feedback from the stakeholder groups would be compared to determine areas of agreement as well as areas of divergence


