
Key Insights
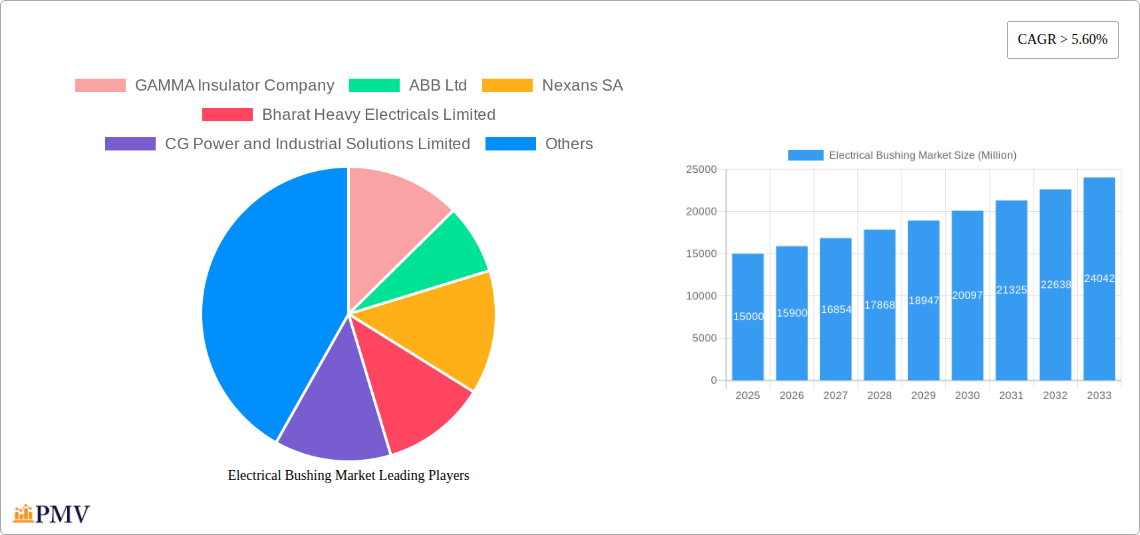
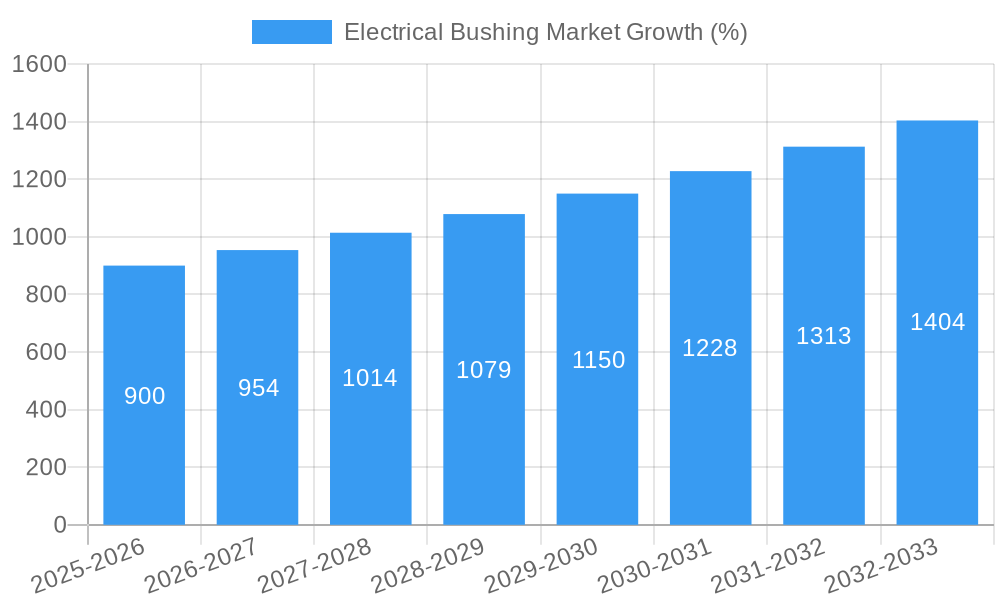
The global electrical bushing market is experiencing robust growth, driven by the increasing demand for electricity and the expansion of power transmission and distribution infrastructure worldwide. The market's Compound Annual Growth Rate (CAGR) exceeding 5.60% from 2019-2024 indicates a significant upward trajectory projected to continue through 2033. Key market drivers include the rising adoption of renewable energy sources, necessitating robust power transmission systems, and the ongoing upgrades to aging electrical grids to improve efficiency and reliability. Furthermore, the increasing urbanization and industrialization in developing economies are fueling the demand for electrical bushings across various applications. The market is segmented by type (oil-impregnated paper, resin-impregnated paper, and other types) and application (transformers, switchgears, and other applications). Oil-impregnated paper bushings currently hold a significant market share due to their established usage and cost-effectiveness, while resin-impregnated paper bushings are gaining traction due to their superior performance characteristics, such as enhanced dielectric strength and improved thermal stability. The Asia-Pacific region, particularly China and India, is expected to witness substantial growth, driven by large-scale infrastructure projects and rising energy consumption. However, market restraints include the high initial investment costs associated with bushing installations and the potential for environmental concerns related to certain bushing materials. Leading players such as ABB, Siemens, Eaton, and Nexans are strategically investing in research and development to enhance bushing technology, focusing on improving efficiency, reliability, and sustainability.
The competitive landscape is marked by the presence of both established multinational corporations and regional players. These companies are employing strategies such as mergers and acquisitions, partnerships, and technological innovations to gain a competitive edge. The forecast period (2025-2033) anticipates continued growth, influenced by factors such as smart grid initiatives, advancements in high-voltage direct current (HVDC) transmission technology, and the increasing demand for reliable and efficient electrical systems in various industries. The market is expected to witness a shift towards more advanced bushing technologies with improved insulation characteristics and longer lifespans, catering to the evolving needs of the power industry. Geographic expansion, particularly in emerging markets, will be a key focus for market players aiming to capitalize on the significant growth opportunities in these regions. The market’s future will likely be shaped by ongoing advancements in materials science, leading to the development of more efficient and environmentally friendly bushings.
Electrical Bushing Market: A Comprehensive Report (2019-2033)
This in-depth report provides a comprehensive analysis of the global Electrical Bushing Market, offering invaluable insights for industry stakeholders. Covering the period from 2019 to 2033, with a focus on the 2025-2033 forecast period, this report meticulously examines market trends, competitive dynamics, and future growth prospects. The study incorporates data from the historical period (2019-2024) and the base year (2025), providing a robust foundation for informed decision-making. The market is segmented by type (Oil Impregnated Paper, Resin Impregnated Paper, Other Types) and application (Transformers, Switchgears, Other Applications), offering a granular understanding of market performance across various segments. The report also highlights key players including GAMMA Insulator Company, ABB Ltd, ABB Ltd, Nexans SA, Nexans SA, Bharat Heavy Electricals Limited, CG Power and Industrial Solutions Limited, Siemens AG, Siemens AG, Eaton Corporation PLC, Eaton Corporation PLC, and General Electric Company. The total market size is projected to reach xx Million by 2033.
Electrical Bushing Market Market Structure & Competitive Dynamics
The Electrical Bushing market exhibits a moderately concentrated structure, with a handful of major players holding significant market share. The market share of the top 5 players is estimated at approximately 55% in 2025. Innovation plays a crucial role, with companies continuously investing in R&D to improve product efficiency, durability, and environmental performance. Regulatory frameworks, particularly concerning safety and environmental standards, significantly influence market dynamics. The presence of substitute products, such as alternative insulation materials, poses a competitive challenge. End-user trends, especially the growth in renewable energy and smart grids, are driving market demand. M&A activity has been moderate, with several strategic acquisitions aimed at expanding market reach and technological capabilities. Deal values have ranged from xx Million to xx Million in recent years.
- Market Concentration: Moderately concentrated, with top 5 players holding ~55% market share (2025).
- Innovation Ecosystem: Strong emphasis on R&D, focusing on improved efficiency and sustainability.
- Regulatory Framework: Stringent safety and environmental standards influence product development and adoption.
- Product Substitutes: Alternative insulation materials present a competitive threat.
- End-User Trends: Growth in renewable energy and smart grids fuels market demand.
- M&A Activity: Moderate activity, with deals ranging from xx Million to xx Million.
Electrical Bushing Market Industry Trends & Insights
The Electrical Bushing market is experiencing robust growth, driven by the expanding electricity infrastructure globally, particularly in developing economies. The market is projected to register a CAGR of xx% during the forecast period (2025-2033). Technological advancements, such as the adoption of advanced materials and smart grid technologies, are disrupting the industry, leading to increased efficiency and improved performance. Consumer preferences are shifting towards environmentally friendly and sustainable products, prompting manufacturers to develop eco-conscious solutions. Competitive dynamics are characterized by intense rivalry, with companies focusing on product differentiation, cost optimization, and strategic partnerships to gain a competitive edge. Market penetration of advanced bushing technologies, such as those incorporating condition monitoring capabilities, is steadily increasing.
Dominant Markets & Segments in Electrical Bushing Market
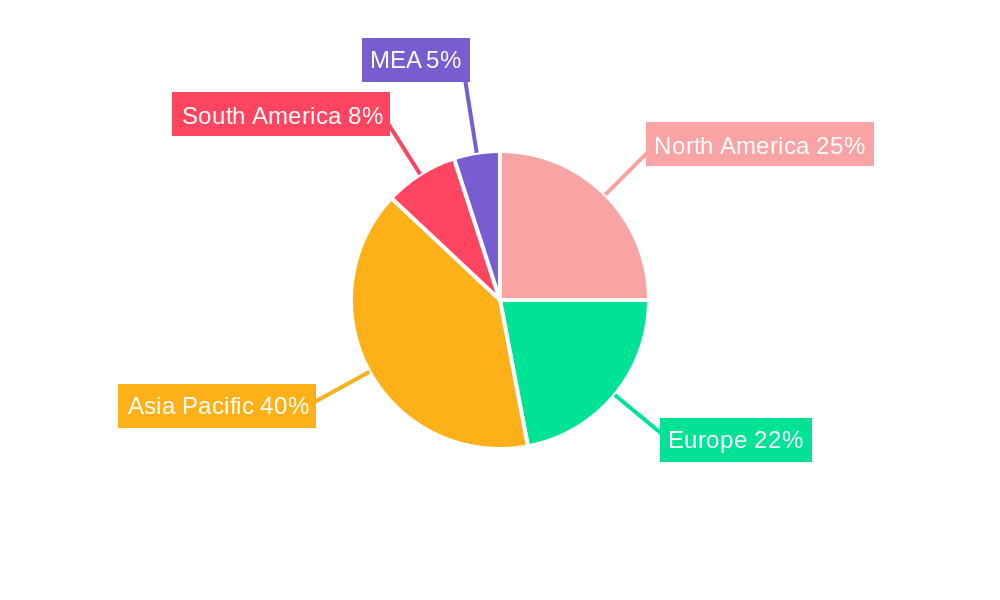
The Asia-Pacific region is currently the dominant market for electrical bushings, driven by rapid infrastructure development and increasing electricity consumption. Within this region, countries like China and India are experiencing particularly strong growth.
Type:
- Oil Impregnated Paper: This segment continues to dominate due to its established technology and cost-effectiveness. Key drivers include its reliability and wide availability.
- Resin Impregnated Paper: This segment is witnessing significant growth, driven by its superior performance characteristics and improved durability. Growing demand for high-voltage applications is fueling its expansion.
- Other Types: This segment includes emerging technologies and niche applications, showing promising growth potential.
Application:
- Transformers: This segment holds the largest market share, fueled by the increasing demand for electricity transmission and distribution. Strong economic growth and expansion of power grids are key drivers.
- Switchgears: This segment is growing steadily, driven by the increasing adoption of advanced switchgear technologies. Investments in smart grids and renewable energy infrastructure are contributing to growth.
- Other Applications: This segment encompasses various specialized applications, showing moderate but steady growth.
Key Drivers (Regional):
- Robust economic growth in developing economies.
- Expansion of power transmission and distribution infrastructure.
- Investments in renewable energy projects.
- Favorable government policies and incentives promoting grid modernization.
Electrical Bushing Market Product Innovations
Recent innovations focus on enhancing the efficiency, durability, and reliability of electrical bushings. Advanced materials, such as high-performance polymers and nanocomposites, are being incorporated to improve insulation properties and thermal management. Smart bushing technologies, incorporating sensors and data analytics, enable real-time condition monitoring and predictive maintenance, minimizing downtime and enhancing grid reliability. These innovations are crucial in catering to the growing demands of high-voltage applications and smart grids, offering significant competitive advantages.
Report Segmentation & Scope
This report segments the Electrical Bushing market by type: Oil Impregnated Paper, Resin Impregnated Paper, and Other Types. The Oil Impregnated Paper segment currently holds the largest market share, but the Resin Impregnated Paper segment is expected to experience faster growth due to its enhanced performance characteristics. The "Other Types" segment comprises niche applications with varying growth rates. The report also segments the market by application: Transformers, Switchgears, and Other Applications, with the Transformers segment dominating due to its extensive use in power transmission and distribution systems. Each segment's growth projections, market sizes, and competitive landscapes are analyzed in detail.
Key Drivers of Electrical Bushing Market Growth
The growth of the Electrical Bushing market is primarily driven by the expanding global electricity infrastructure, increasing demand for power transmission and distribution, and the growing adoption of renewable energy sources. Technological advancements, such as the development of advanced materials and smart grid technologies, further enhance market growth. Favorable government policies and regulations promoting grid modernization and energy efficiency also contribute significantly.
Challenges in the Electrical Bushing Market Sector
The Electrical Bushing market faces several challenges, including stringent regulatory compliance requirements, fluctuations in raw material prices, and intense competition from both established players and new entrants. Supply chain disruptions can also impact market stability and lead to price volatility. These factors can collectively impact profitability and overall market growth.
Leading Players in the Electrical Bushing Market Market
- GAMMA Insulator Company
- ABB Ltd
- Nexans SA
- Bharat Heavy Electricals Limited
- CG Power and Industrial Solutions Limited
- Siemens AG
- Eaton Corporation PLC
- General Electric Company
Key Developments in Electrical Bushing Market Sector
- 2022 Q4: ABB Ltd launched a new range of smart electrical bushings incorporating advanced sensor technology.
- 2023 Q1: Nexans SA announced a strategic partnership to expand its manufacturing capacity for resin-impregnated paper bushings.
- 2023 Q3: Siemens AG acquired a smaller competitor, enhancing its market share and product portfolio.
Strategic Electrical Bushing Market Market Outlook
The Electrical Bushing market presents significant growth opportunities driven by continuous infrastructure expansion and technological advancements. Strategic investments in R&D, focusing on innovative materials and smart technologies, will be key to success. Companies focusing on sustainability and meeting stringent regulatory standards will gain a competitive edge. The long-term outlook is positive, with substantial growth potential in developing economies and the increasing integration of renewable energy sources.
Electrical Bushing Market Segmentation
-
1. Type
- 1.1. Oil Impregnated Paper
- 1.2. Resin Impregnated Paper
- 1.3. Other Types
-
2. Application
- 2.1. Transformers
- 2.2. Switchgears
- 2.3. Other Applications
Electrical Bushing Market Segmentation By Geography
- 1. North America
- 2. Europe
- 3. Asia Pacific
- 4. South America
- 5. Middle East and Africa
Electrical Bushing Market REPORT HIGHLIGHTS
| Aspects | Details |
|---|---|
| Study Period | 2019-2033 |
| Base Year | 2024 |
| Estimated Year | 2025 |
| Forecast Period | 2025-2033 |
| Historical Period | 2019-2024 |
| Growth Rate | CAGR of > 5.60% from 2019-2033 |
| Segmentation |
|
Table of Contents
- 1. Introduction
- 1.1. Research Scope
- 1.2. Market Segmentation
- 1.3. Research Methodology
- 1.4. Definitions and Assumptions
- 2. Executive Summary
- 2.1. Introduction
- 3. Market Dynamics
- 3.1. Introduction
- 3.2. Market Drivers
- 3.2.1. Replacement of Existing Grids and the Expansion of Distribution Networks
- 3.3. Market Restrains
- 3.3.1. High Installation Costs
- 3.4. Market Trends
- 3.4.1. Transformer Application to Dominate the Market
- 4. Market Factor Analysis
- 4.1. Porters Five Forces
- 4.2. Supply/Value Chain
- 4.3. PESTEL analysis
- 4.4. Market Entropy
- 4.5. Patent/Trademark Analysis
- 5. Global Electrical Bushing Market Analysis, Insights and Forecast, 2019-2031
- 5.1. Market Analysis, Insights and Forecast - by Type
- 5.1.1. Oil Impregnated Paper
- 5.1.2. Resin Impregnated Paper
- 5.1.3. Other Types
- 5.2. Market Analysis, Insights and Forecast - by Application
- 5.2.1. Transformers
- 5.2.2. Switchgears
- 5.2.3. Other Applications
- 5.3. Market Analysis, Insights and Forecast - by Region
- 5.3.1. North America
- 5.3.2. Europe
- 5.3.3. Asia Pacific
- 5.3.4. South America
- 5.3.5. Middle East and Africa
- 5.1. Market Analysis, Insights and Forecast - by Type
- 6. North America Electrical Bushing Market Analysis, Insights and Forecast, 2019-2031
- 6.1. Market Analysis, Insights and Forecast - by Type
- 6.1.1. Oil Impregnated Paper
- 6.1.2. Resin Impregnated Paper
- 6.1.3. Other Types
- 6.2. Market Analysis, Insights and Forecast - by Application
- 6.2.1. Transformers
- 6.2.2. Switchgears
- 6.2.3. Other Applications
- 6.1. Market Analysis, Insights and Forecast - by Type
- 7. Europe Electrical Bushing Market Analysis, Insights and Forecast, 2019-2031
- 7.1. Market Analysis, Insights and Forecast - by Type
- 7.1.1. Oil Impregnated Paper
- 7.1.2. Resin Impregnated Paper
- 7.1.3. Other Types
- 7.2. Market Analysis, Insights and Forecast - by Application
- 7.2.1. Transformers
- 7.2.2. Switchgears
- 7.2.3. Other Applications
- 7.1. Market Analysis, Insights and Forecast - by Type
- 8. Asia Pacific Electrical Bushing Market Analysis, Insights and Forecast, 2019-2031
- 8.1. Market Analysis, Insights and Forecast - by Type
- 8.1.1. Oil Impregnated Paper
- 8.1.2. Resin Impregnated Paper
- 8.1.3. Other Types
- 8.2. Market Analysis, Insights and Forecast - by Application
- 8.2.1. Transformers
- 8.2.2. Switchgears
- 8.2.3. Other Applications
- 8.1. Market Analysis, Insights and Forecast - by Type
- 9. South America Electrical Bushing Market Analysis, Insights and Forecast, 2019-2031
- 9.1. Market Analysis, Insights and Forecast - by Type
- 9.1.1. Oil Impregnated Paper
- 9.1.2. Resin Impregnated Paper
- 9.1.3. Other Types
- 9.2. Market Analysis, Insights and Forecast - by Application
- 9.2.1. Transformers
- 9.2.2. Switchgears
- 9.2.3. Other Applications
- 9.1. Market Analysis, Insights and Forecast - by Type
- 10. Middle East and Africa Electrical Bushing Market Analysis, Insights and Forecast, 2019-2031
- 10.1. Market Analysis, Insights and Forecast - by Type
- 10.1.1. Oil Impregnated Paper
- 10.1.2. Resin Impregnated Paper
- 10.1.3. Other Types
- 10.2. Market Analysis, Insights and Forecast - by Application
- 10.2.1. Transformers
- 10.2.2. Switchgears
- 10.2.3. Other Applications
- 10.1. Market Analysis, Insights and Forecast - by Type
- 11. North America Electrical Bushing Market Analysis, Insights and Forecast, 2019-2031
- 11.1. Market Analysis, Insights and Forecast - By Country/Sub-region
- 11.1.1 United States
- 11.1.2 Canada
- 11.1.3 Mexico
- 12. Europe Electrical Bushing Market Analysis, Insights and Forecast, 2019-2031
- 12.1. Market Analysis, Insights and Forecast - By Country/Sub-region
- 12.1.1 Germany
- 12.1.2 United Kingdom
- 12.1.3 France
- 12.1.4 Spain
- 12.1.5 Italy
- 12.1.6 Spain
- 12.1.7 Belgium
- 12.1.8 Netherland
- 12.1.9 Nordics
- 12.1.10 Rest of Europe
- 13. Asia Pacific Electrical Bushing Market Analysis, Insights and Forecast, 2019-2031
- 13.1. Market Analysis, Insights and Forecast - By Country/Sub-region
- 13.1.1 China
- 13.1.2 Japan
- 13.1.3 India
- 13.1.4 South Korea
- 13.1.5 Southeast Asia
- 13.1.6 Australia
- 13.1.7 Indonesia
- 13.1.8 Phillipes
- 13.1.9 Singapore
- 13.1.10 Thailandc
- 13.1.11 Rest of Asia Pacific
- 14. South America Electrical Bushing Market Analysis, Insights and Forecast, 2019-2031
- 14.1. Market Analysis, Insights and Forecast - By Country/Sub-region
- 14.1.1 Brazil
- 14.1.2 Argentina
- 14.1.3 Peru
- 14.1.4 Chile
- 14.1.5 Colombia
- 14.1.6 Ecuador
- 14.1.7 Venezuela
- 14.1.8 Rest of South America
- 15. MEA Electrical Bushing Market Analysis, Insights and Forecast, 2019-2031
- 15.1. Market Analysis, Insights and Forecast - By Country/Sub-region
- 15.1.1 United Arab Emirates
- 15.1.2 Saudi Arabia
- 15.1.3 South Africa
- 15.1.4 Rest of Middle East and Africa
- 16. Competitive Analysis
- 16.1. Global Market Share Analysis 2024
- 16.2. Company Profiles
- 16.2.1 GAMMA Insulator Company
- 16.2.1.1. Overview
- 16.2.1.2. Products
- 16.2.1.3. SWOT Analysis
- 16.2.1.4. Recent Developments
- 16.2.1.5. Financials (Based on Availability)
- 16.2.2 ABB Ltd
- 16.2.2.1. Overview
- 16.2.2.2. Products
- 16.2.2.3. SWOT Analysis
- 16.2.2.4. Recent Developments
- 16.2.2.5. Financials (Based on Availability)
- 16.2.3 Nexans SA
- 16.2.3.1. Overview
- 16.2.3.2. Products
- 16.2.3.3. SWOT Analysis
- 16.2.3.4. Recent Developments
- 16.2.3.5. Financials (Based on Availability)
- 16.2.4 Bharat Heavy Electricals Limited
- 16.2.4.1. Overview
- 16.2.4.2. Products
- 16.2.4.3. SWOT Analysis
- 16.2.4.4. Recent Developments
- 16.2.4.5. Financials (Based on Availability)
- 16.2.5 CG Power and Industrial Solutions Limited
- 16.2.5.1. Overview
- 16.2.5.2. Products
- 16.2.5.3. SWOT Analysis
- 16.2.5.4. Recent Developments
- 16.2.5.5. Financials (Based on Availability)
- 16.2.6 Siemens AG
- 16.2.6.1. Overview
- 16.2.6.2. Products
- 16.2.6.3. SWOT Analysis
- 16.2.6.4. Recent Developments
- 16.2.6.5. Financials (Based on Availability)
- 16.2.7 Eaton Corporation PLC
- 16.2.7.1. Overview
- 16.2.7.2. Products
- 16.2.7.3. SWOT Analysis
- 16.2.7.4. Recent Developments
- 16.2.7.5. Financials (Based on Availability)
- 16.2.8 Nexans SA*List Not Exhaustive
- 16.2.8.1. Overview
- 16.2.8.2. Products
- 16.2.8.3. SWOT Analysis
- 16.2.8.4. Recent Developments
- 16.2.8.5. Financials (Based on Availability)
- 16.2.9 General Electric Company
- 16.2.9.1. Overview
- 16.2.9.2. Products
- 16.2.9.3. SWOT Analysis
- 16.2.9.4. Recent Developments
- 16.2.9.5. Financials (Based on Availability)
- 16.2.1 GAMMA Insulator Company
List of Figures
- Figure 1: Global Electrical Bushing Market Revenue Breakdown (Million, %) by Region 2024 & 2032
- Figure 2: Global Electrical Bushing Market Volume Breakdown (K Unit, %) by Region 2024 & 2032
- Figure 3: North America Electrical Bushing Market Revenue (Million), by Country 2024 & 2032
- Figure 4: North America Electrical Bushing Market Volume (K Unit), by Country 2024 & 2032
- Figure 5: North America Electrical Bushing Market Revenue Share (%), by Country 2024 & 2032
- Figure 6: North America Electrical Bushing Market Volume Share (%), by Country 2024 & 2032
- Figure 7: Europe Electrical Bushing Market Revenue (Million), by Country 2024 & 2032
- Figure 8: Europe Electrical Bushing Market Volume (K Unit), by Country 2024 & 2032
- Figure 9: Europe Electrical Bushing Market Revenue Share (%), by Country 2024 & 2032
- Figure 10: Europe Electrical Bushing Market Volume Share (%), by Country 2024 & 2032
- Figure 11: Asia Pacific Electrical Bushing Market Revenue (Million), by Country 2024 & 2032
- Figure 12: Asia Pacific Electrical Bushing Market Volume (K Unit), by Country 2024 & 2032
- Figure 13: Asia Pacific Electrical Bushing Market Revenue Share (%), by Country 2024 & 2032
- Figure 14: Asia Pacific Electrical Bushing Market Volume Share (%), by Country 2024 & 2032
- Figure 15: South America Electrical Bushing Market Revenue (Million), by Country 2024 & 2032
- Figure 16: South America Electrical Bushing Market Volume (K Unit), by Country 2024 & 2032
- Figure 17: South America Electrical Bushing Market Revenue Share (%), by Country 2024 & 2032
- Figure 18: South America Electrical Bushing Market Volume Share (%), by Country 2024 & 2032
- Figure 19: MEA Electrical Bushing Market Revenue (Million), by Country 2024 & 2032
- Figure 20: MEA Electrical Bushing Market Volume (K Unit), by Country 2024 & 2032
- Figure 21: MEA Electrical Bushing Market Revenue Share (%), by Country 2024 & 2032
- Figure 22: MEA Electrical Bushing Market Volume Share (%), by Country 2024 & 2032
- Figure 23: North America Electrical Bushing Market Revenue (Million), by Type 2024 & 2032
- Figure 24: North America Electrical Bushing Market Volume (K Unit), by Type 2024 & 2032
- Figure 25: North America Electrical Bushing Market Revenue Share (%), by Type 2024 & 2032
- Figure 26: North America Electrical Bushing Market Volume Share (%), by Type 2024 & 2032
- Figure 27: North America Electrical Bushing Market Revenue (Million), by Application 2024 & 2032
- Figure 28: North America Electrical Bushing Market Volume (K Unit), by Application 2024 & 2032
- Figure 29: North America Electrical Bushing Market Revenue Share (%), by Application 2024 & 2032
- Figure 30: North America Electrical Bushing Market Volume Share (%), by Application 2024 & 2032
- Figure 31: North America Electrical Bushing Market Revenue (Million), by Country 2024 & 2032
- Figure 32: North America Electrical Bushing Market Volume (K Unit), by Country 2024 & 2032
- Figure 33: North America Electrical Bushing Market Revenue Share (%), by Country 2024 & 2032
- Figure 34: North America Electrical Bushing Market Volume Share (%), by Country 2024 & 2032
- Figure 35: Europe Electrical Bushing Market Revenue (Million), by Type 2024 & 2032
- Figure 36: Europe Electrical Bushing Market Volume (K Unit), by Type 2024 & 2032
- Figure 37: Europe Electrical Bushing Market Revenue Share (%), by Type 2024 & 2032
- Figure 38: Europe Electrical Bushing Market Volume Share (%), by Type 2024 & 2032
- Figure 39: Europe Electrical Bushing Market Revenue (Million), by Application 2024 & 2032
- Figure 40: Europe Electrical Bushing Market Volume (K Unit), by Application 2024 & 2032
- Figure 41: Europe Electrical Bushing Market Revenue Share (%), by Application 2024 & 2032
- Figure 42: Europe Electrical Bushing Market Volume Share (%), by Application 2024 & 2032
- Figure 43: Europe Electrical Bushing Market Revenue (Million), by Country 2024 & 2032
- Figure 44: Europe Electrical Bushing Market Volume (K Unit), by Country 2024 & 2032
- Figure 45: Europe Electrical Bushing Market Revenue Share (%), by Country 2024 & 2032
- Figure 46: Europe Electrical Bushing Market Volume Share (%), by Country 2024 & 2032
- Figure 47: Asia Pacific Electrical Bushing Market Revenue (Million), by Type 2024 & 2032
- Figure 48: Asia Pacific Electrical Bushing Market Volume (K Unit), by Type 2024 & 2032
- Figure 49: Asia Pacific Electrical Bushing Market Revenue Share (%), by Type 2024 & 2032
- Figure 50: Asia Pacific Electrical Bushing Market Volume Share (%), by Type 2024 & 2032
- Figure 51: Asia Pacific Electrical Bushing Market Revenue (Million), by Application 2024 & 2032
- Figure 52: Asia Pacific Electrical Bushing Market Volume (K Unit), by Application 2024 & 2032
- Figure 53: Asia Pacific Electrical Bushing Market Revenue Share (%), by Application 2024 & 2032
- Figure 54: Asia Pacific Electrical Bushing Market Volume Share (%), by Application 2024 & 2032
- Figure 55: Asia Pacific Electrical Bushing Market Revenue (Million), by Country 2024 & 2032
- Figure 56: Asia Pacific Electrical Bushing Market Volume (K Unit), by Country 2024 & 2032
- Figure 57: Asia Pacific Electrical Bushing Market Revenue Share (%), by Country 2024 & 2032
- Figure 58: Asia Pacific Electrical Bushing Market Volume Share (%), by Country 2024 & 2032
- Figure 59: South America Electrical Bushing Market Revenue (Million), by Type 2024 & 2032
- Figure 60: South America Electrical Bushing Market Volume (K Unit), by Type 2024 & 2032
- Figure 61: South America Electrical Bushing Market Revenue Share (%), by Type 2024 & 2032
- Figure 62: South America Electrical Bushing Market Volume Share (%), by Type 2024 & 2032
- Figure 63: South America Electrical Bushing Market Revenue (Million), by Application 2024 & 2032
- Figure 64: South America Electrical Bushing Market Volume (K Unit), by Application 2024 & 2032
- Figure 65: South America Electrical Bushing Market Revenue Share (%), by Application 2024 & 2032
- Figure 66: South America Electrical Bushing Market Volume Share (%), by Application 2024 & 2032
- Figure 67: South America Electrical Bushing Market Revenue (Million), by Country 2024 & 2032
- Figure 68: South America Electrical Bushing Market Volume (K Unit), by Country 2024 & 2032
- Figure 69: South America Electrical Bushing Market Revenue Share (%), by Country 2024 & 2032
- Figure 70: South America Electrical Bushing Market Volume Share (%), by Country 2024 & 2032
- Figure 71: Middle East and Africa Electrical Bushing Market Revenue (Million), by Type 2024 & 2032
- Figure 72: Middle East and Africa Electrical Bushing Market Volume (K Unit), by Type 2024 & 2032
- Figure 73: Middle East and Africa Electrical Bushing Market Revenue Share (%), by Type 2024 & 2032
- Figure 74: Middle East and Africa Electrical Bushing Market Volume Share (%), by Type 2024 & 2032
- Figure 75: Middle East and Africa Electrical Bushing Market Revenue (Million), by Application 2024 & 2032
- Figure 76: Middle East and Africa Electrical Bushing Market Volume (K Unit), by Application 2024 & 2032
- Figure 77: Middle East and Africa Electrical Bushing Market Revenue Share (%), by Application 2024 & 2032
- Figure 78: Middle East and Africa Electrical Bushing Market Volume Share (%), by Application 2024 & 2032
- Figure 79: Middle East and Africa Electrical Bushing Market Revenue (Million), by Country 2024 & 2032
- Figure 80: Middle East and Africa Electrical Bushing Market Volume (K Unit), by Country 2024 & 2032
- Figure 81: Middle East and Africa Electrical Bushing Market Revenue Share (%), by Country 2024 & 2032
- Figure 82: Middle East and Africa Electrical Bushing Market Volume Share (%), by Country 2024 & 2032
List of Tables
- Table 1: Global Electrical Bushing Market Revenue Million Forecast, by Region 2019 & 2032
- Table 2: Global Electrical Bushing Market Volume K Unit Forecast, by Region 2019 & 2032
- Table 3: Global Electrical Bushing Market Revenue Million Forecast, by Type 2019 & 2032
- Table 4: Global Electrical Bushing Market Volume K Unit Forecast, by Type 2019 & 2032
- Table 5: Global Electrical Bushing Market Revenue Million Forecast, by Application 2019 & 2032
- Table 6: Global Electrical Bushing Market Volume K Unit Forecast, by Application 2019 & 2032
- Table 7: Global Electrical Bushing Market Revenue Million Forecast, by Region 2019 & 2032
- Table 8: Global Electrical Bushing Market Volume K Unit Forecast, by Region 2019 & 2032
- Table 9: Global Electrical Bushing Market Revenue Million Forecast, by Country 2019 & 2032
- Table 10: Global Electrical Bushing Market Volume K Unit Forecast, by Country 2019 & 2032
- Table 11: United States Electrical Bushing Market Revenue (Million) Forecast, by Application 2019 & 2032
- Table 12: United States Electrical Bushing Market Volume (K Unit) Forecast, by Application 2019 & 2032
- Table 13: Canada Electrical Bushing Market Revenue (Million) Forecast, by Application 2019 & 2032
- Table 14: Canada Electrical Bushing Market Volume (K Unit) Forecast, by Application 2019 & 2032
- Table 15: Mexico Electrical Bushing Market Revenue (Million) Forecast, by Application 2019 & 2032
- Table 16: Mexico Electrical Bushing Market Volume (K Unit) Forecast, by Application 2019 & 2032
- Table 17: Global Electrical Bushing Market Revenue Million Forecast, by Country 2019 & 2032
- Table 18: Global Electrical Bushing Market Volume K Unit Forecast, by Country 2019 & 2032
- Table 19: Germany Electrical Bushing Market Revenue (Million) Forecast, by Application 2019 & 2032
- Table 20: Germany Electrical Bushing Market Volume (K Unit) Forecast, by Application 2019 & 2032
- Table 21: United Kingdom Electrical Bushing Market Revenue (Million) Forecast, by Application 2019 & 2032
- Table 22: United Kingdom Electrical Bushing Market Volume (K Unit) Forecast, by Application 2019 & 2032
- Table 23: France Electrical Bushing Market Revenue (Million) Forecast, by Application 2019 & 2032
- Table 24: France Electrical Bushing Market Volume (K Unit) Forecast, by Application 2019 & 2032
- Table 25: Spain Electrical Bushing Market Revenue (Million) Forecast, by Application 2019 & 2032
- Table 26: Spain Electrical Bushing Market Volume (K Unit) Forecast, by Application 2019 & 2032
- Table 27: Italy Electrical Bushing Market Revenue (Million) Forecast, by Application 2019 & 2032
- Table 28: Italy Electrical Bushing Market Volume (K Unit) Forecast, by Application 2019 & 2032
- Table 29: Spain Electrical Bushing Market Revenue (Million) Forecast, by Application 2019 & 2032
- Table 30: Spain Electrical Bushing Market Volume (K Unit) Forecast, by Application 2019 & 2032
- Table 31: Belgium Electrical Bushing Market Revenue (Million) Forecast, by Application 2019 & 2032
- Table 32: Belgium Electrical Bushing Market Volume (K Unit) Forecast, by Application 2019 & 2032
- Table 33: Netherland Electrical Bushing Market Revenue (Million) Forecast, by Application 2019 & 2032
- Table 34: Netherland Electrical Bushing Market Volume (K Unit) Forecast, by Application 2019 & 2032
- Table 35: Nordics Electrical Bushing Market Revenue (Million) Forecast, by Application 2019 & 2032
- Table 36: Nordics Electrical Bushing Market Volume (K Unit) Forecast, by Application 2019 & 2032
- Table 37: Rest of Europe Electrical Bushing Market Revenue (Million) Forecast, by Application 2019 & 2032
- Table 38: Rest of Europe Electrical Bushing Market Volume (K Unit) Forecast, by Application 2019 & 2032
- Table 39: Global Electrical Bushing Market Revenue Million Forecast, by Country 2019 & 2032
- Table 40: Global Electrical Bushing Market Volume K Unit Forecast, by Country 2019 & 2032
- Table 41: China Electrical Bushing Market Revenue (Million) Forecast, by Application 2019 & 2032
- Table 42: China Electrical Bushing Market Volume (K Unit) Forecast, by Application 2019 & 2032
- Table 43: Japan Electrical Bushing Market Revenue (Million) Forecast, by Application 2019 & 2032
- Table 44: Japan Electrical Bushing Market Volume (K Unit) Forecast, by Application 2019 & 2032
- Table 45: India Electrical Bushing Market Revenue (Million) Forecast, by Application 2019 & 2032
- Table 46: India Electrical Bushing Market Volume (K Unit) Forecast, by Application 2019 & 2032
- Table 47: South Korea Electrical Bushing Market Revenue (Million) Forecast, by Application 2019 & 2032
- Table 48: South Korea Electrical Bushing Market Volume (K Unit) Forecast, by Application 2019 & 2032
- Table 49: Southeast Asia Electrical Bushing Market Revenue (Million) Forecast, by Application 2019 & 2032
- Table 50: Southeast Asia Electrical Bushing Market Volume (K Unit) Forecast, by Application 2019 & 2032
- Table 51: Australia Electrical Bushing Market Revenue (Million) Forecast, by Application 2019 & 2032
- Table 52: Australia Electrical Bushing Market Volume (K Unit) Forecast, by Application 2019 & 2032
- Table 53: Indonesia Electrical Bushing Market Revenue (Million) Forecast, by Application 2019 & 2032
- Table 54: Indonesia Electrical Bushing Market Volume (K Unit) Forecast, by Application 2019 & 2032
- Table 55: Phillipes Electrical Bushing Market Revenue (Million) Forecast, by Application 2019 & 2032
- Table 56: Phillipes Electrical Bushing Market Volume (K Unit) Forecast, by Application 2019 & 2032
- Table 57: Singapore Electrical Bushing Market Revenue (Million) Forecast, by Application 2019 & 2032
- Table 58: Singapore Electrical Bushing Market Volume (K Unit) Forecast, by Application 2019 & 2032
- Table 59: Thailandc Electrical Bushing Market Revenue (Million) Forecast, by Application 2019 & 2032
- Table 60: Thailandc Electrical Bushing Market Volume (K Unit) Forecast, by Application 2019 & 2032
- Table 61: Rest of Asia Pacific Electrical Bushing Market Revenue (Million) Forecast, by Application 2019 & 2032
- Table 62: Rest of Asia Pacific Electrical Bushing Market Volume (K Unit) Forecast, by Application 2019 & 2032
- Table 63: Global Electrical Bushing Market Revenue Million Forecast, by Country 2019 & 2032
- Table 64: Global Electrical Bushing Market Volume K Unit Forecast, by Country 2019 & 2032
- Table 65: Brazil Electrical Bushing Market Revenue (Million) Forecast, by Application 2019 & 2032
- Table 66: Brazil Electrical Bushing Market Volume (K Unit) Forecast, by Application 2019 & 2032
- Table 67: Argentina Electrical Bushing Market Revenue (Million) Forecast, by Application 2019 & 2032
- Table 68: Argentina Electrical Bushing Market Volume (K Unit) Forecast, by Application 2019 & 2032
- Table 69: Peru Electrical Bushing Market Revenue (Million) Forecast, by Application 2019 & 2032
- Table 70: Peru Electrical Bushing Market Volume (K Unit) Forecast, by Application 2019 & 2032
- Table 71: Chile Electrical Bushing Market Revenue (Million) Forecast, by Application 2019 & 2032
- Table 72: Chile Electrical Bushing Market Volume (K Unit) Forecast, by Application 2019 & 2032
- Table 73: Colombia Electrical Bushing Market Revenue (Million) Forecast, by Application 2019 & 2032
- Table 74: Colombia Electrical Bushing Market Volume (K Unit) Forecast, by Application 2019 & 2032
- Table 75: Ecuador Electrical Bushing Market Revenue (Million) Forecast, by Application 2019 & 2032
- Table 76: Ecuador Electrical Bushing Market Volume (K Unit) Forecast, by Application 2019 & 2032
- Table 77: Venezuela Electrical Bushing Market Revenue (Million) Forecast, by Application 2019 & 2032
- Table 78: Venezuela Electrical Bushing Market Volume (K Unit) Forecast, by Application 2019 & 2032
- Table 79: Rest of South America Electrical Bushing Market Revenue (Million) Forecast, by Application 2019 & 2032
- Table 80: Rest of South America Electrical Bushing Market Volume (K Unit) Forecast, by Application 2019 & 2032
- Table 81: Global Electrical Bushing Market Revenue Million Forecast, by Country 2019 & 2032
- Table 82: Global Electrical Bushing Market Volume K Unit Forecast, by Country 2019 & 2032
- Table 83: United Arab Emirates Electrical Bushing Market Revenue (Million) Forecast, by Application 2019 & 2032
- Table 84: United Arab Emirates Electrical Bushing Market Volume (K Unit) Forecast, by Application 2019 & 2032
- Table 85: Saudi Arabia Electrical Bushing Market Revenue (Million) Forecast, by Application 2019 & 2032
- Table 86: Saudi Arabia Electrical Bushing Market Volume (K Unit) Forecast, by Application 2019 & 2032
- Table 87: South Africa Electrical Bushing Market Revenue (Million) Forecast, by Application 2019 & 2032
- Table 88: South Africa Electrical Bushing Market Volume (K Unit) Forecast, by Application 2019 & 2032
- Table 89: Rest of Middle East and Africa Electrical Bushing Market Revenue (Million) Forecast, by Application 2019 & 2032
- Table 90: Rest of Middle East and Africa Electrical Bushing Market Volume (K Unit) Forecast, by Application 2019 & 2032
- Table 91: Global Electrical Bushing Market Revenue Million Forecast, by Type 2019 & 2032
- Table 92: Global Electrical Bushing Market Volume K Unit Forecast, by Type 2019 & 2032
- Table 93: Global Electrical Bushing Market Revenue Million Forecast, by Application 2019 & 2032
- Table 94: Global Electrical Bushing Market Volume K Unit Forecast, by Application 2019 & 2032
- Table 95: Global Electrical Bushing Market Revenue Million Forecast, by Country 2019 & 2032
- Table 96: Global Electrical Bushing Market Volume K Unit Forecast, by Country 2019 & 2032
- Table 97: Global Electrical Bushing Market Revenue Million Forecast, by Type 2019 & 2032
- Table 98: Global Electrical Bushing Market Volume K Unit Forecast, by Type 2019 & 2032
- Table 99: Global Electrical Bushing Market Revenue Million Forecast, by Application 2019 & 2032
- Table 100: Global Electrical Bushing Market Volume K Unit Forecast, by Application 2019 & 2032
- Table 101: Global Electrical Bushing Market Revenue Million Forecast, by Country 2019 & 2032
- Table 102: Global Electrical Bushing Market Volume K Unit Forecast, by Country 2019 & 2032
- Table 103: Global Electrical Bushing Market Revenue Million Forecast, by Type 2019 & 2032
- Table 104: Global Electrical Bushing Market Volume K Unit Forecast, by Type 2019 & 2032
- Table 105: Global Electrical Bushing Market Revenue Million Forecast, by Application 2019 & 2032
- Table 106: Global Electrical Bushing Market Volume K Unit Forecast, by Application 2019 & 2032
- Table 107: Global Electrical Bushing Market Revenue Million Forecast, by Country 2019 & 2032
- Table 108: Global Electrical Bushing Market Volume K Unit Forecast, by Country 2019 & 2032
- Table 109: Global Electrical Bushing Market Revenue Million Forecast, by Type 2019 & 2032
- Table 110: Global Electrical Bushing Market Volume K Unit Forecast, by Type 2019 & 2032
- Table 111: Global Electrical Bushing Market Revenue Million Forecast, by Application 2019 & 2032
- Table 112: Global Electrical Bushing Market Volume K Unit Forecast, by Application 2019 & 2032
- Table 113: Global Electrical Bushing Market Revenue Million Forecast, by Country 2019 & 2032
- Table 114: Global Electrical Bushing Market Volume K Unit Forecast, by Country 2019 & 2032
- Table 115: Global Electrical Bushing Market Revenue Million Forecast, by Type 2019 & 2032
- Table 116: Global Electrical Bushing Market Volume K Unit Forecast, by Type 2019 & 2032
- Table 117: Global Electrical Bushing Market Revenue Million Forecast, by Application 2019 & 2032
- Table 118: Global Electrical Bushing Market Volume K Unit Forecast, by Application 2019 & 2032
- Table 119: Global Electrical Bushing Market Revenue Million Forecast, by Country 2019 & 2032
- Table 120: Global Electrical Bushing Market Volume K Unit Forecast, by Country 2019 & 2032
Frequently Asked Questions
1. What is the projected Compound Annual Growth Rate (CAGR) of the Electrical Bushing Market?
The projected CAGR is approximately > 5.60%.
2. Which companies are prominent players in the Electrical Bushing Market?
Key companies in the market include GAMMA Insulator Company, ABB Ltd, Nexans SA, Bharat Heavy Electricals Limited, CG Power and Industrial Solutions Limited, Siemens AG, Eaton Corporation PLC, Nexans SA*List Not Exhaustive, General Electric Company.
3. What are the main segments of the Electrical Bushing Market?
The market segments include Type, Application.
4. Can you provide details about the market size?
The market size is estimated to be USD XX Million as of 2022.
5. What are some drivers contributing to market growth?
Replacement of Existing Grids and the Expansion of Distribution Networks.
6. What are the notable trends driving market growth?
Transformer Application to Dominate the Market.
7. Are there any restraints impacting market growth?
High Installation Costs.
8. Can you provide examples of recent developments in the market?
N/A
9. What pricing options are available for accessing the report?
Pricing options include single-user, multi-user, and enterprise licenses priced at USD 4750, USD 5250, and USD 8750 respectively.
10. Is the market size provided in terms of value or volume?
The market size is provided in terms of value, measured in Million and volume, measured in K Unit.
11. Are there any specific market keywords associated with the report?
Yes, the market keyword associated with the report is "Electrical Bushing Market," which aids in identifying and referencing the specific market segment covered.
12. How do I determine which pricing option suits my needs best?
The pricing options vary based on user requirements and access needs. Individual users may opt for single-user licenses, while businesses requiring broader access may choose multi-user or enterprise licenses for cost-effective access to the report.
13. Are there any additional resources or data provided in the Electrical Bushing Market report?
While the report offers comprehensive insights, it's advisable to review the specific contents or supplementary materials provided to ascertain if additional resources or data are available.
14. How can I stay updated on further developments or reports in the Electrical Bushing Market?
To stay informed about further developments, trends, and reports in the Electrical Bushing Market, consider subscribing to industry newsletters, following relevant companies and organizations, or regularly checking reputable industry news sources and publications.
Methodology
Step 1 - Identification of Relevant Samples Size from Population Database


Step 2 - Approaches for Defining Global Market Size (Value, Volume* & Price*)

Note*: In applicable scenarios
Step 3 - Data Sources
Primary Research
- Web Analytics
- Survey Reports
- Research Institute
- Latest Research Reports
- Opinion Leaders
Secondary Research
- Annual Reports
- White Paper
- Latest Press Release
- Industry Association
- Paid Database
- Investor Presentations

Step 4 - Data Triangulation
Involves using different sources of information in order to increase the validity of a study
These sources are likely to be stakeholders in a program - participants, other researchers, program staff, other community members, and so on.
Then we put all data in single framework & apply various statistical tools to find out the dynamic on the market.
During the analysis stage, feedback from the stakeholder groups would be compared to determine areas of agreement as well as areas of divergence


