
Key Insights
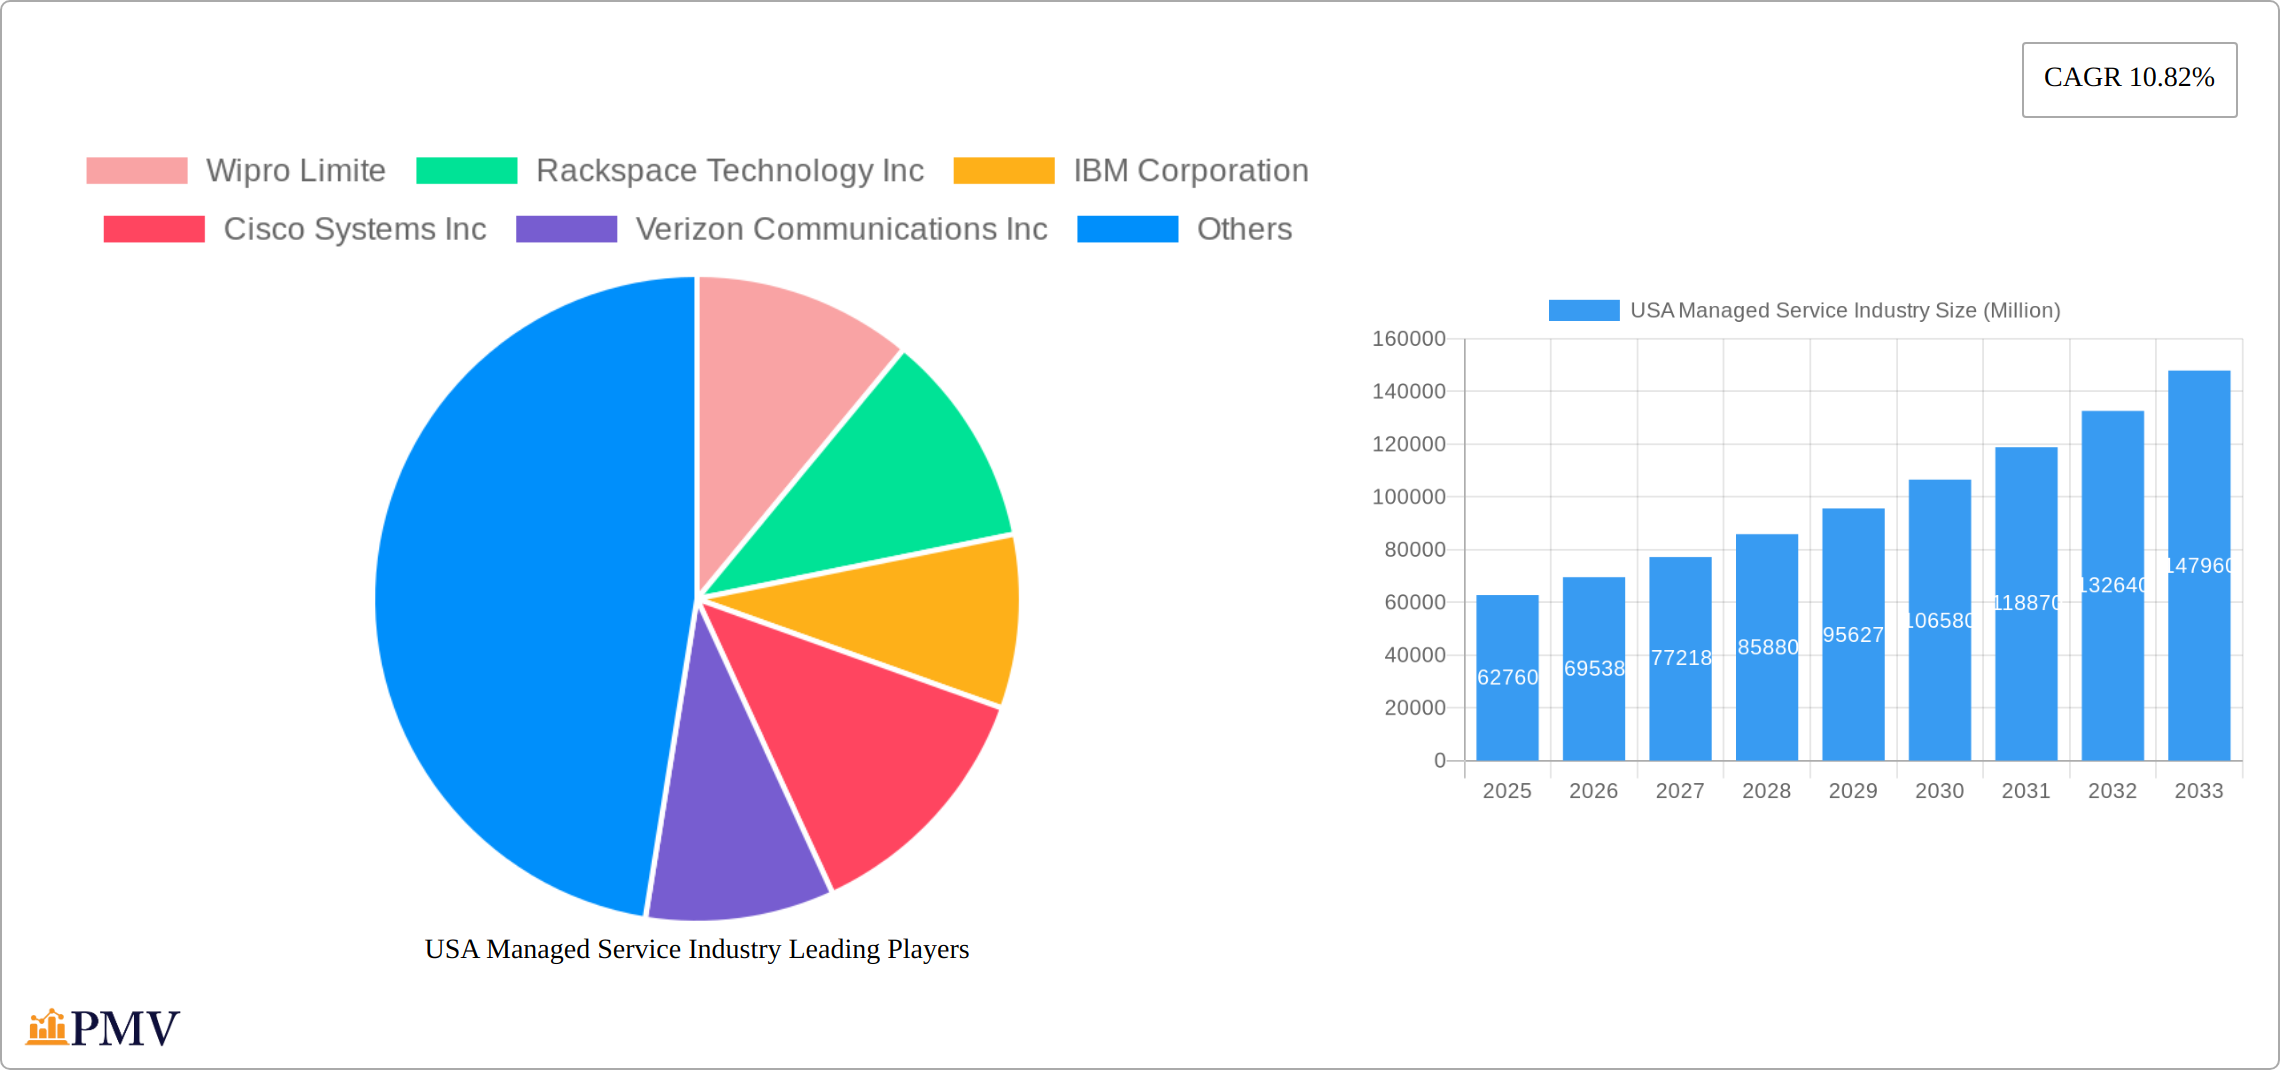
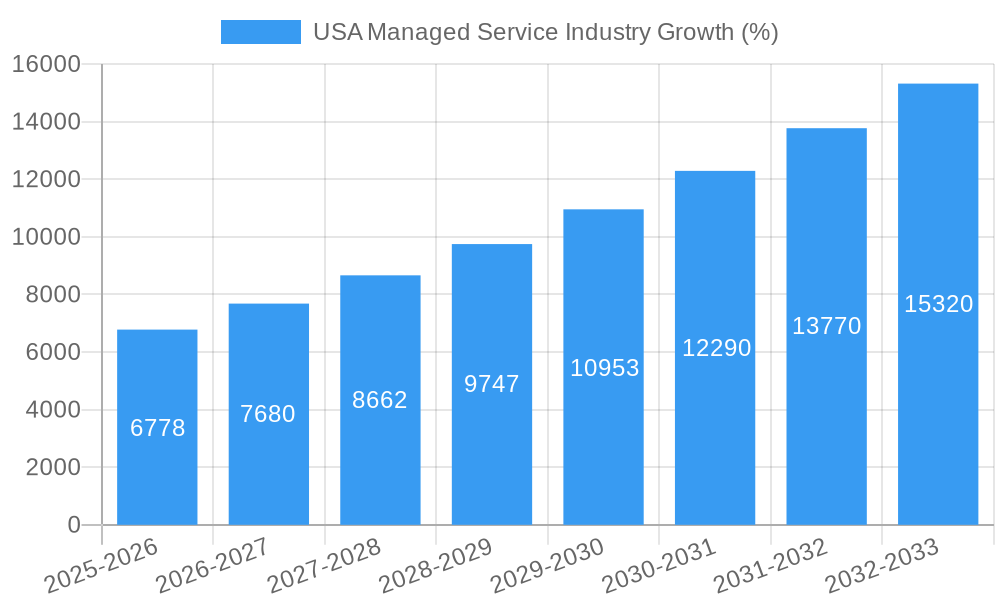
The US managed services market, valued at $62.76 billion in 2025, is experiencing robust growth, projected to expand at a Compound Annual Growth Rate (CAGR) of 10.82% from 2025 to 2033. This significant expansion is driven by several key factors. The increasing adoption of cloud computing necessitates robust managed services for security, infrastructure, and application management. Furthermore, the rising demand for digital transformation initiatives across various sectors, including BFSI, healthcare, and IT & Telecom, fuels the need for reliable and scalable managed services. Businesses are increasingly outsourcing IT operations to focus on core competencies, driving the growth of managed data centers, security, and network services. The preference for hybrid cloud models further boosts demand, requiring specialized expertise offered by managed service providers. Finally, stringent data privacy regulations and cybersecurity threats are compelling enterprises to leverage the security expertise of managed service providers, furthering market expansion.
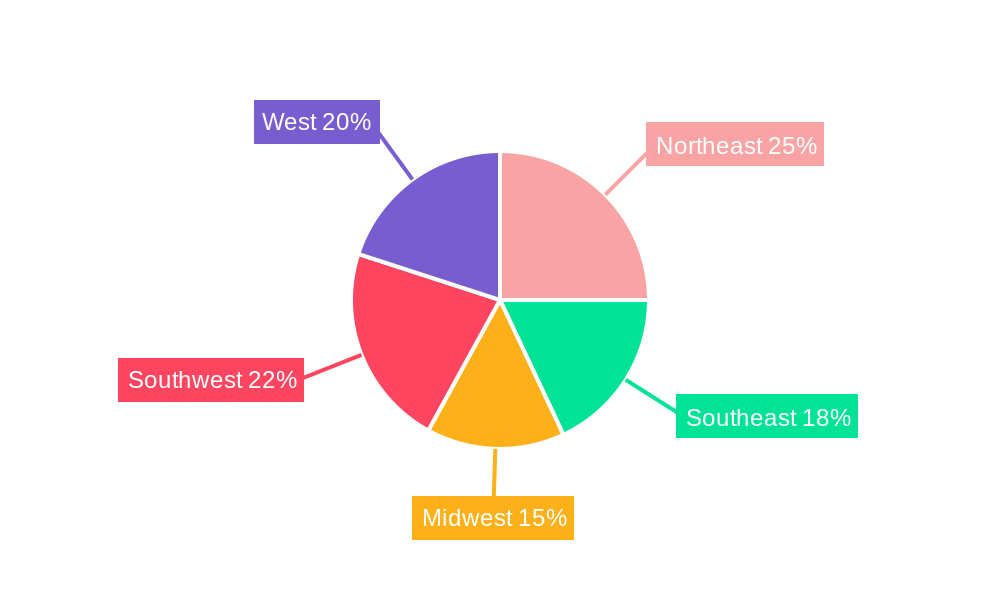
The market segmentation reveals a diverse landscape. Cloud-based managed services are experiencing faster growth compared to on-premise solutions, reflecting the industry-wide shift towards cloud adoption. Within the type segment, managed security services are witnessing particularly high demand due to increasing cyber threats and data breaches. Large enterprises dominate the market share due to their higher IT budgets and complex infrastructure needs, but SMEs are also adopting managed services at a rapid pace, driven by cost efficiency and scalability advantages. Geographically, the Northeast, West, and Southwest regions of the US are anticipated to be key contributors to market growth given their high concentration of technology companies and data centers. The competitive landscape is dominated by major players like IBM, Cisco, Microsoft, and Wipro, who are constantly innovating and expanding their service offerings to cater to the evolving needs of businesses. Continued technological advancements, coupled with the growing demand for managed services, indicate a highly positive outlook for the US market throughout the forecast period.
USA Managed Service Industry Market Report: 2019-2033
This comprehensive report provides an in-depth analysis of the USA Managed Service Industry, offering crucial insights for businesses and investors navigating this dynamic market. The report covers the period 2019-2033, with a focus on 2025, incorporating historical data, current market conditions, and future projections. The US$ xx Million market is segmented by deployment (on-premise, cloud), type (managed data center, managed security, managed communications, managed network, managed infrastructure, managed mobility), enterprise size (SMEs, large enterprises), and end-user vertical (BFSI, IT & Telecom, Healthcare, Entertainment & Media, Retail, Manufacturing, Government, others). Key players like Wipro Limited, Rackspace Technology Inc, IBM Corporation, and others are profiled, providing a complete understanding of the competitive landscape and growth opportunities.
USA Managed Service Industry Market Structure & Competitive Dynamics
The USA Managed Service Industry exhibits a moderately concentrated market structure, with a few dominant players and numerous smaller niche providers. Market share is largely determined by technological capabilities, service portfolio breadth, global reach, and customer relationships. Significant M&A activity has shaped the market landscape, with deal values exceeding US$ xx Million in recent years. Regulatory frameworks, particularly concerning data privacy and security (e.g., GDPR, CCPA), significantly influence market practices. Innovation ecosystems are vibrant, with continuous advancements in cloud computing, AI, and cybersecurity driving product differentiation and service offerings. End-user trends indicate a growing preference for cloud-based managed services, driven by scalability, cost-efficiency, and enhanced security. The substitution of legacy on-premise solutions with cloud-based alternatives continues to reshape the market.
- Market Concentration: High (Top 5 players hold approximately xx% market share).
- M&A Activity: US$ xx Million in deals recorded between 2019-2024, indicating consolidation trends.
- Innovation: Focus on AI-powered automation, cloud-native security, and IoT integration.
- Regulatory Landscape: Stringent data privacy regulations impacting service delivery and data security practices.
USA Managed Service Industry Industry Trends & Insights
The USA Managed Service Industry is experiencing robust growth, driven by the increasing adoption of cloud technologies, digital transformation initiatives across various sectors, and a heightened focus on cybersecurity. The market is projected to achieve a Compound Annual Growth Rate (CAGR) of xx% during the forecast period (2025-2033). Market penetration is highest in large enterprises, although significant growth is expected from SMEs adopting managed services to improve operational efficiency and reduce IT infrastructure costs. Technological disruptions, such as the rise of serverless computing and edge computing, are reshaping service offerings and driving innovation. Consumer preferences are shifting towards flexible, scalable, and cost-effective solutions, influencing the design and pricing of managed services. Competitive dynamics are characterized by strategic partnerships, technological advancements, and a focus on customer experience.
Dominant Markets & Segments in USA Managed Service Industry
The Cloud segment within the Managed Service sector dominates the market, experiencing exponential growth due to enhanced scalability, cost-effectiveness, and accessibility. The Managed Security segment displays strong growth, driven by increasing cyber threats and regulatory requirements for robust data protection. Within end-user verticals, the BFSI and IT & Telecom sectors demonstrate the highest adoption rates, while Healthcare and Manufacturing are witnessing considerable growth. Large enterprises represent the most significant market segment, owing to their extensive IT infrastructure and higher budgets.
- Key Drivers for Cloud Segment Dominance: Reduced capital expenditure, improved scalability, enhanced agility.
- Key Drivers for Managed Security Segment Growth: Rising cyber threats, compliance mandates, need for proactive security measures.
- Key Drivers for BFSI Sector Adoption: Stringent regulatory compliance, need for robust data protection, transaction processing needs.
- Key Drivers for Large Enterprise Segment Dominance: Larger budgets, complex IT infrastructure, need for specialized services.
USA Managed Service Industry Product Innovations
Recent product innovations focus on integrating AI and machine learning for enhanced automation, predictive analytics, and improved security. Cloud-native solutions are gaining popularity, offering seamless integration with cloud platforms like AWS, Azure, and Google Cloud. The emphasis is on providing comprehensive, end-to-end managed services that address multiple business needs, rather than isolated functionalities. These innovations enhance operational efficiency, reduce costs, and improve security posture for businesses of all sizes.
Report Segmentation & Scope
The report comprehensively segments the market by deployment (on-premise and cloud), type (managed data center, managed security, managed communications, managed network, managed infrastructure, and managed mobility), enterprise size (SMEs and large enterprises), and end-user vertical (BFSI, IT & Telecom, Healthcare, Entertainment & Media, Retail, Manufacturing, Government, and others). Each segment’s market size, growth projections, and competitive landscape are analyzed in detail. For example, the cloud segment is expected to register a CAGR of xx% during the forecast period, while the managed security segment is projected to grow at xx%. The competitive dynamics within each segment vary, with some exhibiting high concentration and others showing a more fragmented structure.
Key Drivers of USA Managed Service Industry Growth
The growth of the USA Managed Service Industry is fueled by several factors. Technological advancements, such as cloud computing, AI, and IoT, are driving innovation and expanding the range of available services. Economic factors, including the rising cost of in-house IT infrastructure and the increasing need for efficient operations, are pushing businesses to adopt managed services. Favorable government policies and regulations supporting digital transformation are also contributing to market growth.
Challenges in the USA Managed Service Industry Sector
Despite significant growth, the USA Managed Service Industry faces challenges including intense competition, evolving technological landscapes demanding continuous upskilling, and potential supply chain disruptions impacting service delivery. Stringent security and compliance regulations increase operational costs and necessitate robust security measures. These factors, along with potential economic downturns, could impact the market's growth trajectory.
Leading Players in the USA Managed Service Industry Market
- Wipro Limited
- Rackspace Technology Inc
- IBM Corporation
- Cisco Systems Inc
- Verizon Communications Inc
- Microsoft Corporation
- HP Inc
- Fujitsu Limited
- Tata Consultancy Services Limited
- Dell Technologies Inc
- AT&T Inc
- Citrix Systems Inc
Key Developments in USA Managed Service Industry Sector
- October 2023: Rackspace Technology launched Rackspace Managed Cloud (RMC), expanding its cloud management services portfolio.
- August 2023: Verizon Business partnered with HCLTech for Managed Network Services (MNS), strengthening its global enterprise networking capabilities.
Strategic USA Managed Service Industry Market Outlook
The future of the USA Managed Service Industry is bright, with continued growth driven by the increasing adoption of cloud computing, the rise of AI-powered solutions, and a growing emphasis on cybersecurity. Strategic opportunities exist for companies that can effectively leverage these technological advancements to deliver innovative, cost-effective, and secure managed services. Focusing on specialized niches, developing robust cybersecurity offerings, and fostering strong customer relationships will be crucial for success in this competitive market.
USA Managed Service Industry Segmentation
-
1. Deployment
- 1.1. On-premise
- 1.2. Cloud
-
2. Type
- 2.1. Managed Data Center
- 2.2. Managed Security
- 2.3. Managed Communications
- 2.4. Managed Network
- 2.5. Managed Infrastructure
- 2.6. Managed Mobility
-
3. Enterprise Size
- 3.1. Small and Medium Enterprises
- 3.2. Large Enterprises
-
4. End-user Vertical
- 4.1. BFSI
- 4.2. IT and Telecom
- 4.3. Healthcare
- 4.4. Entertainment and Media
- 4.5. Retail
- 4.6. Manufacturing
- 4.7. Government
- 4.8. Other End-user Verticals
USA Managed Service Industry Segmentation By Geography
-
1. North America
- 1.1. United States
- 1.2. Canada
- 1.3. Mexico
-
2. South America
- 2.1. Brazil
- 2.2. Argentina
- 2.3. Rest of South America
-
3. Europe
- 3.1. United Kingdom
- 3.2. Germany
- 3.3. France
- 3.4. Italy
- 3.5. Spain
- 3.6. Russia
- 3.7. Benelux
- 3.8. Nordics
- 3.9. Rest of Europe
-
4. Middle East & Africa
- 4.1. Turkey
- 4.2. Israel
- 4.3. GCC
- 4.4. North Africa
- 4.5. South Africa
- 4.6. Rest of Middle East & Africa
-
5. Asia Pacific
- 5.1. China
- 5.2. India
- 5.3. Japan
- 5.4. South Korea
- 5.5. ASEAN
- 5.6. Oceania
- 5.7. Rest of Asia Pacific
USA Managed Service Industry REPORT HIGHLIGHTS
| Aspects | Details |
|---|---|
| Study Period | 2019-2033 |
| Base Year | 2024 |
| Estimated Year | 2025 |
| Forecast Period | 2025-2033 |
| Historical Period | 2019-2024 |
| Growth Rate | CAGR of 10.82% from 2019-2033 |
| Segmentation |
|
Table of Contents
- 1. Introduction
- 1.1. Research Scope
- 1.2. Market Segmentation
- 1.3. Research Methodology
- 1.4. Definitions and Assumptions
- 2. Executive Summary
- 2.1. Introduction
- 3. Market Dynamics
- 3.1. Introduction
- 3.2. Market Drivers
- 3.2.1. Increasing Shift to Hybrid IT; Improved Cost and Operational Efficiency
- 3.3. Market Restrains
- 3.3.1 High Risk of Radiation Since it uses Gamma Rays
- 3.3.2 X-Rays; High Deployment Costs
- 3.4. Market Trends
- 3.4.1. Cloud to Witness Significant Growth
- 4. Market Factor Analysis
- 4.1. Porters Five Forces
- 4.2. Supply/Value Chain
- 4.3. PESTEL analysis
- 4.4. Market Entropy
- 4.5. Patent/Trademark Analysis
- 5. Global USA Managed Service Industry Analysis, Insights and Forecast, 2019-2031
- 5.1. Market Analysis, Insights and Forecast - by Deployment
- 5.1.1. On-premise
- 5.1.2. Cloud
- 5.2. Market Analysis, Insights and Forecast - by Type
- 5.2.1. Managed Data Center
- 5.2.2. Managed Security
- 5.2.3. Managed Communications
- 5.2.4. Managed Network
- 5.2.5. Managed Infrastructure
- 5.2.6. Managed Mobility
- 5.3. Market Analysis, Insights and Forecast - by Enterprise Size
- 5.3.1. Small and Medium Enterprises
- 5.3.2. Large Enterprises
- 5.4. Market Analysis, Insights and Forecast - by End-user Vertical
- 5.4.1. BFSI
- 5.4.2. IT and Telecom
- 5.4.3. Healthcare
- 5.4.4. Entertainment and Media
- 5.4.5. Retail
- 5.4.6. Manufacturing
- 5.4.7. Government
- 5.4.8. Other End-user Verticals
- 5.5. Market Analysis, Insights and Forecast - by Region
- 5.5.1. North America
- 5.5.2. South America
- 5.5.3. Europe
- 5.5.4. Middle East & Africa
- 5.5.5. Asia Pacific
- 5.1. Market Analysis, Insights and Forecast - by Deployment
- 6. North America USA Managed Service Industry Analysis, Insights and Forecast, 2019-2031
- 6.1. Market Analysis, Insights and Forecast - by Deployment
- 6.1.1. On-premise
- 6.1.2. Cloud
- 6.2. Market Analysis, Insights and Forecast - by Type
- 6.2.1. Managed Data Center
- 6.2.2. Managed Security
- 6.2.3. Managed Communications
- 6.2.4. Managed Network
- 6.2.5. Managed Infrastructure
- 6.2.6. Managed Mobility
- 6.3. Market Analysis, Insights and Forecast - by Enterprise Size
- 6.3.1. Small and Medium Enterprises
- 6.3.2. Large Enterprises
- 6.4. Market Analysis, Insights and Forecast - by End-user Vertical
- 6.4.1. BFSI
- 6.4.2. IT and Telecom
- 6.4.3. Healthcare
- 6.4.4. Entertainment and Media
- 6.4.5. Retail
- 6.4.6. Manufacturing
- 6.4.7. Government
- 6.4.8. Other End-user Verticals
- 6.1. Market Analysis, Insights and Forecast - by Deployment
- 7. South America USA Managed Service Industry Analysis, Insights and Forecast, 2019-2031
- 7.1. Market Analysis, Insights and Forecast - by Deployment
- 7.1.1. On-premise
- 7.1.2. Cloud
- 7.2. Market Analysis, Insights and Forecast - by Type
- 7.2.1. Managed Data Center
- 7.2.2. Managed Security
- 7.2.3. Managed Communications
- 7.2.4. Managed Network
- 7.2.5. Managed Infrastructure
- 7.2.6. Managed Mobility
- 7.3. Market Analysis, Insights and Forecast - by Enterprise Size
- 7.3.1. Small and Medium Enterprises
- 7.3.2. Large Enterprises
- 7.4. Market Analysis, Insights and Forecast - by End-user Vertical
- 7.4.1. BFSI
- 7.4.2. IT and Telecom
- 7.4.3. Healthcare
- 7.4.4. Entertainment and Media
- 7.4.5. Retail
- 7.4.6. Manufacturing
- 7.4.7. Government
- 7.4.8. Other End-user Verticals
- 7.1. Market Analysis, Insights and Forecast - by Deployment
- 8. Europe USA Managed Service Industry Analysis, Insights and Forecast, 2019-2031
- 8.1. Market Analysis, Insights and Forecast - by Deployment
- 8.1.1. On-premise
- 8.1.2. Cloud
- 8.2. Market Analysis, Insights and Forecast - by Type
- 8.2.1. Managed Data Center
- 8.2.2. Managed Security
- 8.2.3. Managed Communications
- 8.2.4. Managed Network
- 8.2.5. Managed Infrastructure
- 8.2.6. Managed Mobility
- 8.3. Market Analysis, Insights and Forecast - by Enterprise Size
- 8.3.1. Small and Medium Enterprises
- 8.3.2. Large Enterprises
- 8.4. Market Analysis, Insights and Forecast - by End-user Vertical
- 8.4.1. BFSI
- 8.4.2. IT and Telecom
- 8.4.3. Healthcare
- 8.4.4. Entertainment and Media
- 8.4.5. Retail
- 8.4.6. Manufacturing
- 8.4.7. Government
- 8.4.8. Other End-user Verticals
- 8.1. Market Analysis, Insights and Forecast - by Deployment
- 9. Middle East & Africa USA Managed Service Industry Analysis, Insights and Forecast, 2019-2031
- 9.1. Market Analysis, Insights and Forecast - by Deployment
- 9.1.1. On-premise
- 9.1.2. Cloud
- 9.2. Market Analysis, Insights and Forecast - by Type
- 9.2.1. Managed Data Center
- 9.2.2. Managed Security
- 9.2.3. Managed Communications
- 9.2.4. Managed Network
- 9.2.5. Managed Infrastructure
- 9.2.6. Managed Mobility
- 9.3. Market Analysis, Insights and Forecast - by Enterprise Size
- 9.3.1. Small and Medium Enterprises
- 9.3.2. Large Enterprises
- 9.4. Market Analysis, Insights and Forecast - by End-user Vertical
- 9.4.1. BFSI
- 9.4.2. IT and Telecom
- 9.4.3. Healthcare
- 9.4.4. Entertainment and Media
- 9.4.5. Retail
- 9.4.6. Manufacturing
- 9.4.7. Government
- 9.4.8. Other End-user Verticals
- 9.1. Market Analysis, Insights and Forecast - by Deployment
- 10. Asia Pacific USA Managed Service Industry Analysis, Insights and Forecast, 2019-2031
- 10.1. Market Analysis, Insights and Forecast - by Deployment
- 10.1.1. On-premise
- 10.1.2. Cloud
- 10.2. Market Analysis, Insights and Forecast - by Type
- 10.2.1. Managed Data Center
- 10.2.2. Managed Security
- 10.2.3. Managed Communications
- 10.2.4. Managed Network
- 10.2.5. Managed Infrastructure
- 10.2.6. Managed Mobility
- 10.3. Market Analysis, Insights and Forecast - by Enterprise Size
- 10.3.1. Small and Medium Enterprises
- 10.3.2. Large Enterprises
- 10.4. Market Analysis, Insights and Forecast - by End-user Vertical
- 10.4.1. BFSI
- 10.4.2. IT and Telecom
- 10.4.3. Healthcare
- 10.4.4. Entertainment and Media
- 10.4.5. Retail
- 10.4.6. Manufacturing
- 10.4.7. Government
- 10.4.8. Other End-user Verticals
- 10.1. Market Analysis, Insights and Forecast - by Deployment
- 11. Northeast USA Managed Service Industry Analysis, Insights and Forecast, 2019-2031
- 12. Southeast USA Managed Service Industry Analysis, Insights and Forecast, 2019-2031
- 13. Midwest USA Managed Service Industry Analysis, Insights and Forecast, 2019-2031
- 14. Southwest USA Managed Service Industry Analysis, Insights and Forecast, 2019-2031
- 15. West USA Managed Service Industry Analysis, Insights and Forecast, 2019-2031
- 16. Competitive Analysis
- 16.1. Global Market Share Analysis 2024
- 16.2. Company Profiles
- 16.2.1 Wipro Limite
- 16.2.1.1. Overview
- 16.2.1.2. Products
- 16.2.1.3. SWOT Analysis
- 16.2.1.4. Recent Developments
- 16.2.1.5. Financials (Based on Availability)
- 16.2.2 Rackspace Technology Inc
- 16.2.2.1. Overview
- 16.2.2.2. Products
- 16.2.2.3. SWOT Analysis
- 16.2.2.4. Recent Developments
- 16.2.2.5. Financials (Based on Availability)
- 16.2.3 IBM Corporation
- 16.2.3.1. Overview
- 16.2.3.2. Products
- 16.2.3.3. SWOT Analysis
- 16.2.3.4. Recent Developments
- 16.2.3.5. Financials (Based on Availability)
- 16.2.4 Cisco Systems Inc
- 16.2.4.1. Overview
- 16.2.4.2. Products
- 16.2.4.3. SWOT Analysis
- 16.2.4.4. Recent Developments
- 16.2.4.5. Financials (Based on Availability)
- 16.2.5 Verizon Communications Inc
- 16.2.5.1. Overview
- 16.2.5.2. Products
- 16.2.5.3. SWOT Analysis
- 16.2.5.4. Recent Developments
- 16.2.5.5. Financials (Based on Availability)
- 16.2.6 Microsoft Corporation
- 16.2.6.1. Overview
- 16.2.6.2. Products
- 16.2.6.3. SWOT Analysis
- 16.2.6.4. Recent Developments
- 16.2.6.5. Financials (Based on Availability)
- 16.2.7 HP Inc
- 16.2.7.1. Overview
- 16.2.7.2. Products
- 16.2.7.3. SWOT Analysis
- 16.2.7.4. Recent Developments
- 16.2.7.5. Financials (Based on Availability)
- 16.2.8 Fujitsu Limited
- 16.2.8.1. Overview
- 16.2.8.2. Products
- 16.2.8.3. SWOT Analysis
- 16.2.8.4. Recent Developments
- 16.2.8.5. Financials (Based on Availability)
- 16.2.9 Tata Consultancy Services Limited
- 16.2.9.1. Overview
- 16.2.9.2. Products
- 16.2.9.3. SWOT Analysis
- 16.2.9.4. Recent Developments
- 16.2.9.5. Financials (Based on Availability)
- 16.2.10 Dell Technologies Inc
- 16.2.10.1. Overview
- 16.2.10.2. Products
- 16.2.10.3. SWOT Analysis
- 16.2.10.4. Recent Developments
- 16.2.10.5. Financials (Based on Availability)
- 16.2.11 AT&T Inc
- 16.2.11.1. Overview
- 16.2.11.2. Products
- 16.2.11.3. SWOT Analysis
- 16.2.11.4. Recent Developments
- 16.2.11.5. Financials (Based on Availability)
- 16.2.12 Citrix Systems Inc
- 16.2.12.1. Overview
- 16.2.12.2. Products
- 16.2.12.3. SWOT Analysis
- 16.2.12.4. Recent Developments
- 16.2.12.5. Financials (Based on Availability)
- 16.2.1 Wipro Limite
List of Figures
- Figure 1: Global USA Managed Service Industry Revenue Breakdown (Million, %) by Region 2024 & 2032
- Figure 2: United states USA Managed Service Industry Revenue (Million), by Country 2024 & 2032
- Figure 3: United states USA Managed Service Industry Revenue Share (%), by Country 2024 & 2032
- Figure 4: North America USA Managed Service Industry Revenue (Million), by Deployment 2024 & 2032
- Figure 5: North America USA Managed Service Industry Revenue Share (%), by Deployment 2024 & 2032
- Figure 6: North America USA Managed Service Industry Revenue (Million), by Type 2024 & 2032
- Figure 7: North America USA Managed Service Industry Revenue Share (%), by Type 2024 & 2032
- Figure 8: North America USA Managed Service Industry Revenue (Million), by Enterprise Size 2024 & 2032
- Figure 9: North America USA Managed Service Industry Revenue Share (%), by Enterprise Size 2024 & 2032
- Figure 10: North America USA Managed Service Industry Revenue (Million), by End-user Vertical 2024 & 2032
- Figure 11: North America USA Managed Service Industry Revenue Share (%), by End-user Vertical 2024 & 2032
- Figure 12: North America USA Managed Service Industry Revenue (Million), by Country 2024 & 2032
- Figure 13: North America USA Managed Service Industry Revenue Share (%), by Country 2024 & 2032
- Figure 14: South America USA Managed Service Industry Revenue (Million), by Deployment 2024 & 2032
- Figure 15: South America USA Managed Service Industry Revenue Share (%), by Deployment 2024 & 2032
- Figure 16: South America USA Managed Service Industry Revenue (Million), by Type 2024 & 2032
- Figure 17: South America USA Managed Service Industry Revenue Share (%), by Type 2024 & 2032
- Figure 18: South America USA Managed Service Industry Revenue (Million), by Enterprise Size 2024 & 2032
- Figure 19: South America USA Managed Service Industry Revenue Share (%), by Enterprise Size 2024 & 2032
- Figure 20: South America USA Managed Service Industry Revenue (Million), by End-user Vertical 2024 & 2032
- Figure 21: South America USA Managed Service Industry Revenue Share (%), by End-user Vertical 2024 & 2032
- Figure 22: South America USA Managed Service Industry Revenue (Million), by Country 2024 & 2032
- Figure 23: South America USA Managed Service Industry Revenue Share (%), by Country 2024 & 2032
- Figure 24: Europe USA Managed Service Industry Revenue (Million), by Deployment 2024 & 2032
- Figure 25: Europe USA Managed Service Industry Revenue Share (%), by Deployment 2024 & 2032
- Figure 26: Europe USA Managed Service Industry Revenue (Million), by Type 2024 & 2032
- Figure 27: Europe USA Managed Service Industry Revenue Share (%), by Type 2024 & 2032
- Figure 28: Europe USA Managed Service Industry Revenue (Million), by Enterprise Size 2024 & 2032
- Figure 29: Europe USA Managed Service Industry Revenue Share (%), by Enterprise Size 2024 & 2032
- Figure 30: Europe USA Managed Service Industry Revenue (Million), by End-user Vertical 2024 & 2032
- Figure 31: Europe USA Managed Service Industry Revenue Share (%), by End-user Vertical 2024 & 2032
- Figure 32: Europe USA Managed Service Industry Revenue (Million), by Country 2024 & 2032
- Figure 33: Europe USA Managed Service Industry Revenue Share (%), by Country 2024 & 2032
- Figure 34: Middle East & Africa USA Managed Service Industry Revenue (Million), by Deployment 2024 & 2032
- Figure 35: Middle East & Africa USA Managed Service Industry Revenue Share (%), by Deployment 2024 & 2032
- Figure 36: Middle East & Africa USA Managed Service Industry Revenue (Million), by Type 2024 & 2032
- Figure 37: Middle East & Africa USA Managed Service Industry Revenue Share (%), by Type 2024 & 2032
- Figure 38: Middle East & Africa USA Managed Service Industry Revenue (Million), by Enterprise Size 2024 & 2032
- Figure 39: Middle East & Africa USA Managed Service Industry Revenue Share (%), by Enterprise Size 2024 & 2032
- Figure 40: Middle East & Africa USA Managed Service Industry Revenue (Million), by End-user Vertical 2024 & 2032
- Figure 41: Middle East & Africa USA Managed Service Industry Revenue Share (%), by End-user Vertical 2024 & 2032
- Figure 42: Middle East & Africa USA Managed Service Industry Revenue (Million), by Country 2024 & 2032
- Figure 43: Middle East & Africa USA Managed Service Industry Revenue Share (%), by Country 2024 & 2032
- Figure 44: Asia Pacific USA Managed Service Industry Revenue (Million), by Deployment 2024 & 2032
- Figure 45: Asia Pacific USA Managed Service Industry Revenue Share (%), by Deployment 2024 & 2032
- Figure 46: Asia Pacific USA Managed Service Industry Revenue (Million), by Type 2024 & 2032
- Figure 47: Asia Pacific USA Managed Service Industry Revenue Share (%), by Type 2024 & 2032
- Figure 48: Asia Pacific USA Managed Service Industry Revenue (Million), by Enterprise Size 2024 & 2032
- Figure 49: Asia Pacific USA Managed Service Industry Revenue Share (%), by Enterprise Size 2024 & 2032
- Figure 50: Asia Pacific USA Managed Service Industry Revenue (Million), by End-user Vertical 2024 & 2032
- Figure 51: Asia Pacific USA Managed Service Industry Revenue Share (%), by End-user Vertical 2024 & 2032
- Figure 52: Asia Pacific USA Managed Service Industry Revenue (Million), by Country 2024 & 2032
- Figure 53: Asia Pacific USA Managed Service Industry Revenue Share (%), by Country 2024 & 2032
List of Tables
- Table 1: Global USA Managed Service Industry Revenue Million Forecast, by Region 2019 & 2032
- Table 2: Global USA Managed Service Industry Revenue Million Forecast, by Deployment 2019 & 2032
- Table 3: Global USA Managed Service Industry Revenue Million Forecast, by Type 2019 & 2032
- Table 4: Global USA Managed Service Industry Revenue Million Forecast, by Enterprise Size 2019 & 2032
- Table 5: Global USA Managed Service Industry Revenue Million Forecast, by End-user Vertical 2019 & 2032
- Table 6: Global USA Managed Service Industry Revenue Million Forecast, by Region 2019 & 2032
- Table 7: Global USA Managed Service Industry Revenue Million Forecast, by Country 2019 & 2032
- Table 8: Northeast USA Managed Service Industry Revenue (Million) Forecast, by Application 2019 & 2032
- Table 9: Southeast USA Managed Service Industry Revenue (Million) Forecast, by Application 2019 & 2032
- Table 10: Midwest USA Managed Service Industry Revenue (Million) Forecast, by Application 2019 & 2032
- Table 11: Southwest USA Managed Service Industry Revenue (Million) Forecast, by Application 2019 & 2032
- Table 12: West USA Managed Service Industry Revenue (Million) Forecast, by Application 2019 & 2032
- Table 13: Global USA Managed Service Industry Revenue Million Forecast, by Deployment 2019 & 2032
- Table 14: Global USA Managed Service Industry Revenue Million Forecast, by Type 2019 & 2032
- Table 15: Global USA Managed Service Industry Revenue Million Forecast, by Enterprise Size 2019 & 2032
- Table 16: Global USA Managed Service Industry Revenue Million Forecast, by End-user Vertical 2019 & 2032
- Table 17: Global USA Managed Service Industry Revenue Million Forecast, by Country 2019 & 2032
- Table 18: United States USA Managed Service Industry Revenue (Million) Forecast, by Application 2019 & 2032
- Table 19: Canada USA Managed Service Industry Revenue (Million) Forecast, by Application 2019 & 2032
- Table 20: Mexico USA Managed Service Industry Revenue (Million) Forecast, by Application 2019 & 2032
- Table 21: Global USA Managed Service Industry Revenue Million Forecast, by Deployment 2019 & 2032
- Table 22: Global USA Managed Service Industry Revenue Million Forecast, by Type 2019 & 2032
- Table 23: Global USA Managed Service Industry Revenue Million Forecast, by Enterprise Size 2019 & 2032
- Table 24: Global USA Managed Service Industry Revenue Million Forecast, by End-user Vertical 2019 & 2032
- Table 25: Global USA Managed Service Industry Revenue Million Forecast, by Country 2019 & 2032
- Table 26: Brazil USA Managed Service Industry Revenue (Million) Forecast, by Application 2019 & 2032
- Table 27: Argentina USA Managed Service Industry Revenue (Million) Forecast, by Application 2019 & 2032
- Table 28: Rest of South America USA Managed Service Industry Revenue (Million) Forecast, by Application 2019 & 2032
- Table 29: Global USA Managed Service Industry Revenue Million Forecast, by Deployment 2019 & 2032
- Table 30: Global USA Managed Service Industry Revenue Million Forecast, by Type 2019 & 2032
- Table 31: Global USA Managed Service Industry Revenue Million Forecast, by Enterprise Size 2019 & 2032
- Table 32: Global USA Managed Service Industry Revenue Million Forecast, by End-user Vertical 2019 & 2032
- Table 33: Global USA Managed Service Industry Revenue Million Forecast, by Country 2019 & 2032
- Table 34: United Kingdom USA Managed Service Industry Revenue (Million) Forecast, by Application 2019 & 2032
- Table 35: Germany USA Managed Service Industry Revenue (Million) Forecast, by Application 2019 & 2032
- Table 36: France USA Managed Service Industry Revenue (Million) Forecast, by Application 2019 & 2032
- Table 37: Italy USA Managed Service Industry Revenue (Million) Forecast, by Application 2019 & 2032
- Table 38: Spain USA Managed Service Industry Revenue (Million) Forecast, by Application 2019 & 2032
- Table 39: Russia USA Managed Service Industry Revenue (Million) Forecast, by Application 2019 & 2032
- Table 40: Benelux USA Managed Service Industry Revenue (Million) Forecast, by Application 2019 & 2032
- Table 41: Nordics USA Managed Service Industry Revenue (Million) Forecast, by Application 2019 & 2032
- Table 42: Rest of Europe USA Managed Service Industry Revenue (Million) Forecast, by Application 2019 & 2032
- Table 43: Global USA Managed Service Industry Revenue Million Forecast, by Deployment 2019 & 2032
- Table 44: Global USA Managed Service Industry Revenue Million Forecast, by Type 2019 & 2032
- Table 45: Global USA Managed Service Industry Revenue Million Forecast, by Enterprise Size 2019 & 2032
- Table 46: Global USA Managed Service Industry Revenue Million Forecast, by End-user Vertical 2019 & 2032
- Table 47: Global USA Managed Service Industry Revenue Million Forecast, by Country 2019 & 2032
- Table 48: Turkey USA Managed Service Industry Revenue (Million) Forecast, by Application 2019 & 2032
- Table 49: Israel USA Managed Service Industry Revenue (Million) Forecast, by Application 2019 & 2032
- Table 50: GCC USA Managed Service Industry Revenue (Million) Forecast, by Application 2019 & 2032
- Table 51: North Africa USA Managed Service Industry Revenue (Million) Forecast, by Application 2019 & 2032
- Table 52: South Africa USA Managed Service Industry Revenue (Million) Forecast, by Application 2019 & 2032
- Table 53: Rest of Middle East & Africa USA Managed Service Industry Revenue (Million) Forecast, by Application 2019 & 2032
- Table 54: Global USA Managed Service Industry Revenue Million Forecast, by Deployment 2019 & 2032
- Table 55: Global USA Managed Service Industry Revenue Million Forecast, by Type 2019 & 2032
- Table 56: Global USA Managed Service Industry Revenue Million Forecast, by Enterprise Size 2019 & 2032
- Table 57: Global USA Managed Service Industry Revenue Million Forecast, by End-user Vertical 2019 & 2032
- Table 58: Global USA Managed Service Industry Revenue Million Forecast, by Country 2019 & 2032
- Table 59: China USA Managed Service Industry Revenue (Million) Forecast, by Application 2019 & 2032
- Table 60: India USA Managed Service Industry Revenue (Million) Forecast, by Application 2019 & 2032
- Table 61: Japan USA Managed Service Industry Revenue (Million) Forecast, by Application 2019 & 2032
- Table 62: South Korea USA Managed Service Industry Revenue (Million) Forecast, by Application 2019 & 2032
- Table 63: ASEAN USA Managed Service Industry Revenue (Million) Forecast, by Application 2019 & 2032
- Table 64: Oceania USA Managed Service Industry Revenue (Million) Forecast, by Application 2019 & 2032
- Table 65: Rest of Asia Pacific USA Managed Service Industry Revenue (Million) Forecast, by Application 2019 & 2032
Frequently Asked Questions
1. What is the projected Compound Annual Growth Rate (CAGR) of the USA Managed Service Industry?
The projected CAGR is approximately 10.82%.
2. Which companies are prominent players in the USA Managed Service Industry?
Key companies in the market include Wipro Limite, Rackspace Technology Inc, IBM Corporation, Cisco Systems Inc, Verizon Communications Inc, Microsoft Corporation, HP Inc, Fujitsu Limited, Tata Consultancy Services Limited, Dell Technologies Inc, AT&T Inc, Citrix Systems Inc.
3. What are the main segments of the USA Managed Service Industry?
The market segments include Deployment, Type, Enterprise Size, End-user Vertical.
4. Can you provide details about the market size?
The market size is estimated to be USD 62.76 Million as of 2022.
5. What are some drivers contributing to market growth?
Increasing Shift to Hybrid IT; Improved Cost and Operational Efficiency.
6. What are the notable trends driving market growth?
Cloud to Witness Significant Growth.
7. Are there any restraints impacting market growth?
High Risk of Radiation Since it uses Gamma Rays. X-Rays; High Deployment Costs.
8. Can you provide examples of recent developments in the market?
October 2023 - Rackspace Technology introduced Rackspace Managed Cloud (RMC), an all-inclusive service enabling customers to delegate their cloud environments' management and operations. This comprehensive solution is tailored for organizations utilizing platforms such as AWS, Azure, Google Cloud, Rackspace Private Cloud, and on-premises infrastructure.
9. What pricing options are available for accessing the report?
Pricing options include single-user, multi-user, and enterprise licenses priced at USD 3800, USD 4500, and USD 5800 respectively.
10. Is the market size provided in terms of value or volume?
The market size is provided in terms of value, measured in Million.
11. Are there any specific market keywords associated with the report?
Yes, the market keyword associated with the report is "USA Managed Service Industry," which aids in identifying and referencing the specific market segment covered.
12. How do I determine which pricing option suits my needs best?
The pricing options vary based on user requirements and access needs. Individual users may opt for single-user licenses, while businesses requiring broader access may choose multi-user or enterprise licenses for cost-effective access to the report.
13. Are there any additional resources or data provided in the USA Managed Service Industry report?
While the report offers comprehensive insights, it's advisable to review the specific contents or supplementary materials provided to ascertain if additional resources or data are available.
14. How can I stay updated on further developments or reports in the USA Managed Service Industry?
To stay informed about further developments, trends, and reports in the USA Managed Service Industry, consider subscribing to industry newsletters, following relevant companies and organizations, or regularly checking reputable industry news sources and publications.
Methodology
Step 1 - Identification of Relevant Samples Size from Population Database


Step 2 - Approaches for Defining Global Market Size (Value, Volume* & Price*)

Note*: In applicable scenarios
Step 3 - Data Sources
Primary Research
- Web Analytics
- Survey Reports
- Research Institute
- Latest Research Reports
- Opinion Leaders
Secondary Research
- Annual Reports
- White Paper
- Latest Press Release
- Industry Association
- Paid Database
- Investor Presentations

Step 4 - Data Triangulation
Involves using different sources of information in order to increase the validity of a study
These sources are likely to be stakeholders in a program - participants, other researchers, program staff, other community members, and so on.
Then we put all data in single framework & apply various statistical tools to find out the dynamic on the market.
During the analysis stage, feedback from the stakeholder groups would be compared to determine areas of agreement as well as areas of divergence


