
Key Insights
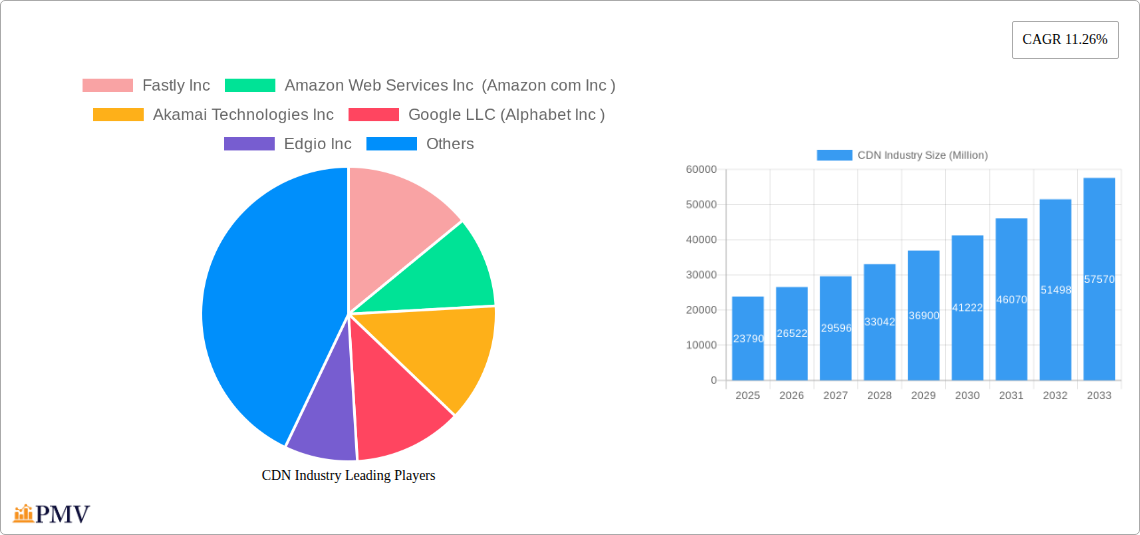
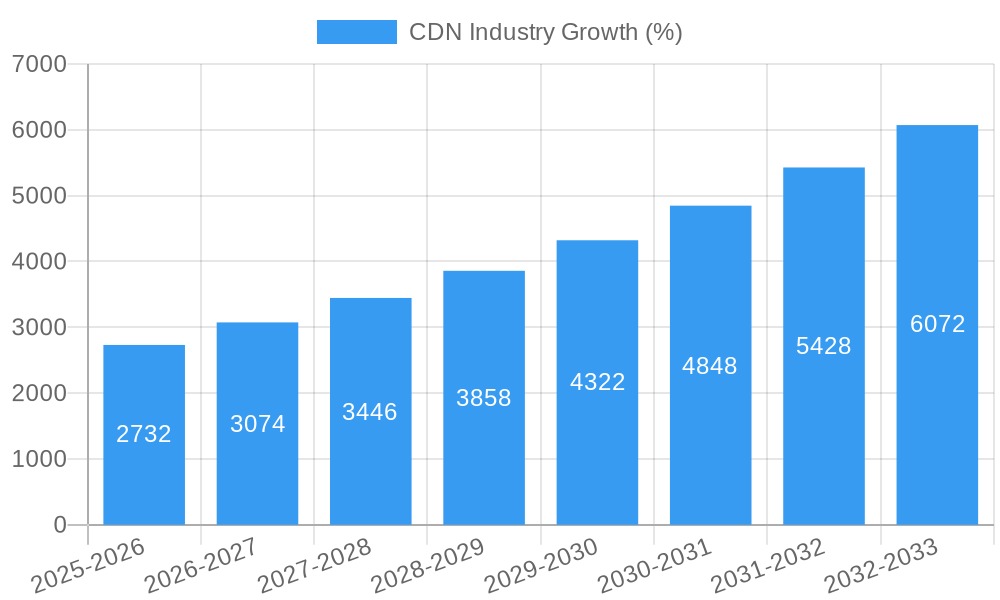
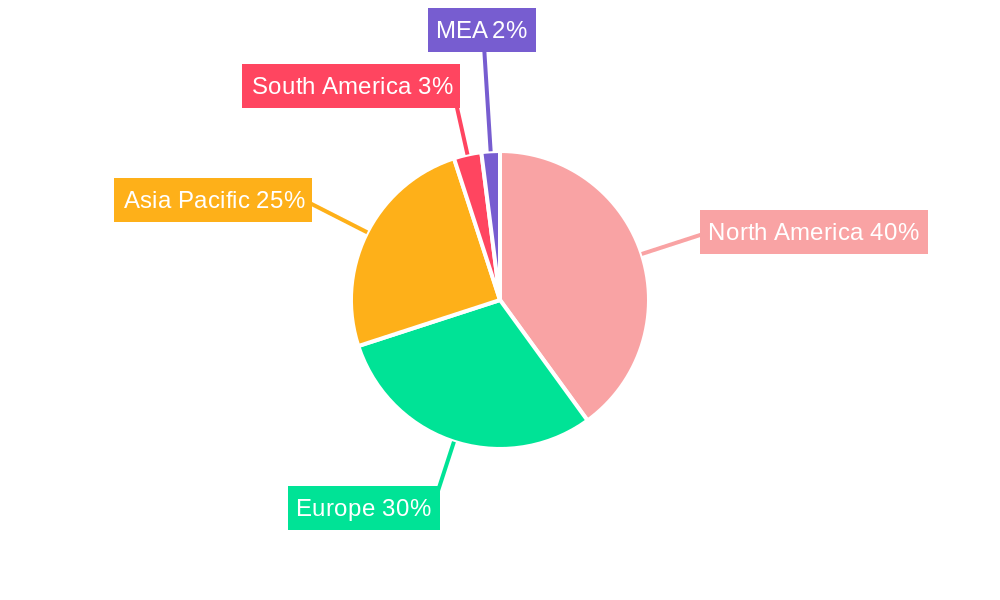
The Content Delivery Network (CDN) industry is experiencing robust growth, projected to reach a market size of $23.79 billion in 2025, expanding at a Compound Annual Growth Rate (CAGR) of 11.26%. This expansion is fueled by several key drivers. The increasing adoption of cloud computing and the surge in online video streaming and e-commerce are significantly boosting CDN demand. Businesses are increasingly reliant on fast, reliable content delivery to enhance user experience and maintain competitive edge, driving investments in CDN solutions. Furthermore, the growing need for enhanced security features, such as DDoS mitigation and web application firewalls, integrated within CDN services is a significant market accelerator. Segmentation reveals strong growth across various sectors. Media and Entertainment remains a dominant end-user, followed by rapidly expanding segments like e-commerce and healthcare, which are increasingly reliant on high-bandwidth content delivery. Geographic analysis indicates that North America currently holds a substantial market share, followed by Europe and Asia Pacific. However, the Asia Pacific region is poised for substantial growth due to the burgeoning digital economy and increasing internet penetration in developing markets like India and Southeast Asia. Competitive dynamics are characterized by the presence of both large established players, such as Akamai and Amazon Web Services, and emerging innovative companies, ensuring a vibrant and competitive landscape.
The forecast period (2025-2033) anticipates continued strong growth, driven by ongoing technological advancements such as edge computing and 5G network deployments. These advancements will further enhance the speed, reliability, and security of content delivery, expanding the applications and benefits of CDN technology. However, potential restraints include the complexity of implementing and managing CDN solutions, and the need for significant upfront investment. Despite these challenges, the long-term outlook for the CDN market remains exceptionally positive, fueled by the unrelenting growth of digital content consumption and the ever-increasing need for efficient and secure content delivery across diverse geographic locations and user devices. The industry's consistent innovation and its ability to adapt to evolving technological landscapes ensure its continued prominence in the global digital infrastructure.
Comprehensive Report: CDN Industry Market Analysis, 2019-2033
This in-depth report provides a comprehensive analysis of the Content Delivery Network (CDN) industry, offering invaluable insights for businesses, investors, and researchers. Covering the period from 2019 to 2033, with a focus on 2025, this report meticulously examines market structure, competitive dynamics, dominant segments, technological innovations, and future growth prospects. The report projects a CDN market valued at xx Million by 2033, exhibiting a CAGR of xx% during the forecast period (2025-2033).
CDN Industry Market Structure & Competitive Dynamics
The CDN industry exhibits a moderately concentrated market structure, dominated by a few major players alongside a multitude of smaller, specialized providers. Market share is constantly shifting due to intense competition and rapid technological advancements. Key players such as Fastly Inc, Amazon Web Services Inc (Amazon.com Inc), Akamai Technologies Inc, Google LLC (Alphabet Inc), Edgio Inc, Microsoft Corporation, Cloudflare Inc, Tata Communications Limite, AT&T Inc, and CDNetworks Inc constantly innovate and engage in mergers and acquisitions (M&A) to expand their market reach and service offerings.
- Market Concentration: The top 5 players collectively hold approximately xx% of the global market share in 2025.
- Innovation Ecosystems: Significant investments in R&D drive continuous innovation in areas like edge computing, AI-powered optimization, and enhanced security features.
- Regulatory Frameworks: Varying data privacy regulations across different geographies impact CDN deployment and operational strategies.
- Product Substitutes: While direct substitutes are limited, alternative solutions like peer-to-peer networks exist, but lack the scalability and reliability of CDNs.
- End-User Trends: Increasing adoption of cloud computing, the proliferation of video streaming, and the growing demand for faster website loading times significantly drive CDN market expansion.
- M&A Activities: The past five years have witnessed several significant M&A deals, with total transaction values exceeding xx Million. These activities reshape the competitive landscape and broaden service portfolios.
CDN Industry Industry Trends & Insights
The CDN industry is experiencing rapid growth fueled by several key factors. The surge in global internet penetration, escalating demand for high-quality streaming video content, and the increasing reliance on cloud-based applications significantly bolster the market's expansion. Technological disruptions, such as the rise of edge computing and the increasing integration of AI and machine learning in CDN operations, enhance performance and efficiency. The shift towards personalized user experiences further fuels CDN adoption. The market is witnessing a high degree of competition, with established players constantly innovating to stay ahead and new entrants emerging with disruptive technologies. The predicted CAGR for the period between 2025 and 2033 is expected to be xx%, indicating robust growth. Market penetration in key sectors like media and entertainment is nearing xx%, with significant potential for further expansion in other segments.
Dominant Markets & Segments in CDN Industry
North America currently holds the largest market share in the CDN industry, driven by factors like robust technological infrastructure, high internet penetration rates, and the presence of major technology companies and significant media and entertainment businesses. Other regions, notably Europe and Asia-Pacific, are also demonstrating considerable growth.
By Solution and Service:
- Media Delivery: This segment dominates the market, driven by increasing demand for high-quality video streaming.
- Cloud Security: Growing concerns regarding data breaches fuel the demand for enhanced security features within CDNs.
- Web Performance: Optimization of website loading times is a key factor influencing CDN adoption.
By End User:
- Media and Entertainment: This is the leading segment, characterized by the high bandwidth requirements of streaming media services.
- E-commerce: E-commerce companies leverage CDNs to deliver seamless online shopping experiences.
- Advertising: Efficient delivery of ad content is a significant driver in this segment.
- Healthcare, Business and Financial Services, Research and Education, Other End Users: These sectors are adopting CDNs at increasing rates.
Key Drivers:
- North America's dominance is rooted in a well-developed digital infrastructure, and a strong presence of major technology companies.
- Strong government support for digital transformation and investment in infrastructure development in other regions is propelling growth.
- Favorable economic policies and a thriving digital economy in developing countries are facilitating the adoption of CDN solutions.
CDN Industry Product Innovations
Recent years have witnessed significant advancements in CDN technology, including the integration of AI and machine learning for optimized content delivery, the rise of edge computing for reduced latency, and the incorporation of advanced security features such as DDoS mitigation and bot management. These innovations enhance the performance, security, and scalability of CDN services, making them increasingly attractive to a wider range of businesses. The market fit for these enhanced features is substantial due to increasing demands for security and performance in modern applications.
Report Segmentation & Scope
This report provides detailed segmentation of the CDN market based on solution and service (Media Delivery, Cloud Security, Web Performance) and end-user segments (Media and Entertainment, Advertising, E-commerce, Healthcare, Business and Financial Services, Research and Education, Other End Users). Each segment’s growth projections, market sizes, and competitive landscapes are analyzed separately. The competitive dynamics within each segment are influenced by factors such as pricing strategies, technological capabilities, and customer support. The analysis covers the historical period (2019-2024), the base year (2025), and the forecast period (2025-2033).
Key Drivers of CDN Industry Growth
Several factors drive the growth of the CDN industry. Firstly, the ever-increasing demand for high-quality streaming video and online gaming fuels the need for efficient content delivery. Secondly, the rise of mobile devices and the increasing reliance on cloud-based applications necessitate robust and scalable CDN solutions. Thirdly, government initiatives promoting digital transformation and infrastructure development across many nations further catalyze growth.
Challenges in the CDN Industry Sector
The CDN industry faces challenges including increasing competition, the need for continuous technological upgrades to keep up with evolving user demands, and managing the complexities of global regulatory compliance across various jurisdictions. Supply chain disruptions can also impact service availability and costs. Finally, securing customer data in the face of ever-sophisticated cyber threats is a significant operational challenge. These factors can cumulatively affect profitability and market penetration.
Leading Players in the CDN Industry Market
- Fastly Inc
- Amazon Web Services Inc (Amazon.com Inc)
- Akamai Technologies Inc
- Google LLC (Alphabet Inc)
- Edgio Inc
- Microsoft Corporation
- Cloudflare Inc
- Tata Communications Limite
- AT&T Inc
- CDNetworks Inc
Key Developments in CDN Industry Sector
- September 2023: Edgio's strategic partnership with Accedo, Bitmovin, Grabyo, and Vimond strengthens its position in the OTT video streaming market.
- August 2023: Nexcess's integration of Cloudflare-powered CDN expands Cloudflare's reach in the B2B hosting market.
Strategic CDN Industry Market Outlook
The future of the CDN industry appears bright, with continued growth expected across various segments. The increasing adoption of edge computing, AI-powered optimization, and enhanced security features will further drive market expansion. Companies that effectively leverage these technologies and cater to evolving customer needs are poised for significant success in this dynamic and rapidly expanding market. Strategic partnerships and acquisitions will likely continue to shape the competitive landscape.
CDN Industry Segmentation
-
1. Offering
-
1.1. Solutions
- 1.1.1. Media Delivery
- 1.1.2. Cloud Security
- 1.1.3. Web Performance
-
1.2. Services
- 1.2.1. Content Delivery
- 1.2.2. Cloud Security
- 1.2.3. Web Performance
-
1.1. Solutions
-
2. End User
- 2.1. Media and Entertainment
- 2.2. Advertising
- 2.3. E-commerce
- 2.4. Healthcare
- 2.5. Business and Financial Services
- 2.6. Research and Education
- 2.7. Other End Users
CDN Industry Segmentation By Geography
-
1. North America
- 1.1. United States
- 1.2. Canada
-
2. Europe
- 2.1. Germany
- 2.2. United Kingdom
- 2.3. France
- 2.4. Rest of Europe
-
3. Asia Pacific
- 3.1. China
- 3.2. Japan
- 3.3. India
- 3.4. South Korea
- 3.5. Rest of Asia Pacific
-
4. Latin America
- 4.1. Brazil
- 4.2. Mexico
- 4.3. Rest of Latin America
-
5. Middle East and Africa
- 5.1. United Arab Emirates
- 5.2. South Africa
- 5.3. Saudi Arabia
- 5.4. Rest of Middle East
CDN Industry REPORT HIGHLIGHTS
| Aspects | Details |
|---|---|
| Study Period | 2019-2033 |
| Base Year | 2024 |
| Estimated Year | 2025 |
| Forecast Period | 2025-2033 |
| Historical Period | 2019-2024 |
| Growth Rate | CAGR of 11.26% from 2019-2033 |
| Segmentation |
|
Table of Contents
- 1. Introduction
- 1.1. Research Scope
- 1.2. Market Segmentation
- 1.3. Research Methodology
- 1.4. Definitions and Assumptions
- 2. Executive Summary
- 2.1. Introduction
- 3. Market Dynamics
- 3.1. Introduction
- 3.2. Market Drivers
- 3.2.1 Increasing Online Users
- 3.2.2 Per Capita Online Consumption
- 3.2.3 and Demand for High -quality Video Content� Drives Growth; Growing Demand from Online Gaming Industries Adding to Market Growth
- 3.3. Market Restrains
- 3.3.1. Larger Organizations Tending to Build their Own CDNS; Bandwidth Concerns Particularly in Developing and Undeveloped Economies
- 3.4. Market Trends
- 3.4.1. Media and Entertainment (M&E) segment to Witness Major Growth
- 4. Market Factor Analysis
- 4.1. Porters Five Forces
- 4.2. Supply/Value Chain
- 4.3. PESTEL analysis
- 4.4. Market Entropy
- 4.5. Patent/Trademark Analysis
- 5. Global CDN Industry Analysis, Insights and Forecast, 2019-2031
- 5.1. Market Analysis, Insights and Forecast - by Offering
- 5.1.1. Solutions
- 5.1.1.1. Media Delivery
- 5.1.1.2. Cloud Security
- 5.1.1.3. Web Performance
- 5.1.2. Services
- 5.1.2.1. Content Delivery
- 5.1.2.2. Cloud Security
- 5.1.2.3. Web Performance
- 5.1.1. Solutions
- 5.2. Market Analysis, Insights and Forecast - by End User
- 5.2.1. Media and Entertainment
- 5.2.2. Advertising
- 5.2.3. E-commerce
- 5.2.4. Healthcare
- 5.2.5. Business and Financial Services
- 5.2.6. Research and Education
- 5.2.7. Other End Users
- 5.3. Market Analysis, Insights and Forecast - by Region
- 5.3.1. North America
- 5.3.2. Europe
- 5.3.3. Asia Pacific
- 5.3.4. Latin America
- 5.3.5. Middle East and Africa
- 5.1. Market Analysis, Insights and Forecast - by Offering
- 6. North America CDN Industry Analysis, Insights and Forecast, 2019-2031
- 6.1. Market Analysis, Insights and Forecast - by Offering
- 6.1.1. Solutions
- 6.1.1.1. Media Delivery
- 6.1.1.2. Cloud Security
- 6.1.1.3. Web Performance
- 6.1.2. Services
- 6.1.2.1. Content Delivery
- 6.1.2.2. Cloud Security
- 6.1.2.3. Web Performance
- 6.1.1. Solutions
- 6.2. Market Analysis, Insights and Forecast - by End User
- 6.2.1. Media and Entertainment
- 6.2.2. Advertising
- 6.2.3. E-commerce
- 6.2.4. Healthcare
- 6.2.5. Business and Financial Services
- 6.2.6. Research and Education
- 6.2.7. Other End Users
- 6.1. Market Analysis, Insights and Forecast - by Offering
- 7. Europe CDN Industry Analysis, Insights and Forecast, 2019-2031
- 7.1. Market Analysis, Insights and Forecast - by Offering
- 7.1.1. Solutions
- 7.1.1.1. Media Delivery
- 7.1.1.2. Cloud Security
- 7.1.1.3. Web Performance
- 7.1.2. Services
- 7.1.2.1. Content Delivery
- 7.1.2.2. Cloud Security
- 7.1.2.3. Web Performance
- 7.1.1. Solutions
- 7.2. Market Analysis, Insights and Forecast - by End User
- 7.2.1. Media and Entertainment
- 7.2.2. Advertising
- 7.2.3. E-commerce
- 7.2.4. Healthcare
- 7.2.5. Business and Financial Services
- 7.2.6. Research and Education
- 7.2.7. Other End Users
- 7.1. Market Analysis, Insights and Forecast - by Offering
- 8. Asia Pacific CDN Industry Analysis, Insights and Forecast, 2019-2031
- 8.1. Market Analysis, Insights and Forecast - by Offering
- 8.1.1. Solutions
- 8.1.1.1. Media Delivery
- 8.1.1.2. Cloud Security
- 8.1.1.3. Web Performance
- 8.1.2. Services
- 8.1.2.1. Content Delivery
- 8.1.2.2. Cloud Security
- 8.1.2.3. Web Performance
- 8.1.1. Solutions
- 8.2. Market Analysis, Insights and Forecast - by End User
- 8.2.1. Media and Entertainment
- 8.2.2. Advertising
- 8.2.3. E-commerce
- 8.2.4. Healthcare
- 8.2.5. Business and Financial Services
- 8.2.6. Research and Education
- 8.2.7. Other End Users
- 8.1. Market Analysis, Insights and Forecast - by Offering
- 9. Latin America CDN Industry Analysis, Insights and Forecast, 2019-2031
- 9.1. Market Analysis, Insights and Forecast - by Offering
- 9.1.1. Solutions
- 9.1.1.1. Media Delivery
- 9.1.1.2. Cloud Security
- 9.1.1.3. Web Performance
- 9.1.2. Services
- 9.1.2.1. Content Delivery
- 9.1.2.2. Cloud Security
- 9.1.2.3. Web Performance
- 9.1.1. Solutions
- 9.2. Market Analysis, Insights and Forecast - by End User
- 9.2.1. Media and Entertainment
- 9.2.2. Advertising
- 9.2.3. E-commerce
- 9.2.4. Healthcare
- 9.2.5. Business and Financial Services
- 9.2.6. Research and Education
- 9.2.7. Other End Users
- 9.1. Market Analysis, Insights and Forecast - by Offering
- 10. Middle East and Africa CDN Industry Analysis, Insights and Forecast, 2019-2031
- 10.1. Market Analysis, Insights and Forecast - by Offering
- 10.1.1. Solutions
- 10.1.1.1. Media Delivery
- 10.1.1.2. Cloud Security
- 10.1.1.3. Web Performance
- 10.1.2. Services
- 10.1.2.1. Content Delivery
- 10.1.2.2. Cloud Security
- 10.1.2.3. Web Performance
- 10.1.1. Solutions
- 10.2. Market Analysis, Insights and Forecast - by End User
- 10.2.1. Media and Entertainment
- 10.2.2. Advertising
- 10.2.3. E-commerce
- 10.2.4. Healthcare
- 10.2.5. Business and Financial Services
- 10.2.6. Research and Education
- 10.2.7. Other End Users
- 10.1. Market Analysis, Insights and Forecast - by Offering
- 11. North America CDN Industry Analysis, Insights and Forecast, 2019-2031
- 11.1. Market Analysis, Insights and Forecast - By Country/Sub-region
- 11.1.1 United States
- 11.1.2 Canada
- 11.1.3 Mexico
- 12. Europe CDN Industry Analysis, Insights and Forecast, 2019-2031
- 12.1. Market Analysis, Insights and Forecast - By Country/Sub-region
- 12.1.1 Germany
- 12.1.2 United Kingdom
- 12.1.3 France
- 12.1.4 Spain
- 12.1.5 Italy
- 12.1.6 Spain
- 12.1.7 Belgium
- 12.1.8 Netherland
- 12.1.9 Nordics
- 12.1.10 Rest of Europe
- 13. Asia Pacific CDN Industry Analysis, Insights and Forecast, 2019-2031
- 13.1. Market Analysis, Insights and Forecast - By Country/Sub-region
- 13.1.1 China
- 13.1.2 Japan
- 13.1.3 India
- 13.1.4 South Korea
- 13.1.5 Southeast Asia
- 13.1.6 Australia
- 13.1.7 Indonesia
- 13.1.8 Phillipes
- 13.1.9 Singapore
- 13.1.10 Thailandc
- 13.1.11 Rest of Asia Pacific
- 14. South America CDN Industry Analysis, Insights and Forecast, 2019-2031
- 14.1. Market Analysis, Insights and Forecast - By Country/Sub-region
- 14.1.1 Brazil
- 14.1.2 Argentina
- 14.1.3 Peru
- 14.1.4 Chile
- 14.1.5 Colombia
- 14.1.6 Ecuador
- 14.1.7 Venezuela
- 14.1.8 Rest of South America
- 15. North America CDN Industry Analysis, Insights and Forecast, 2019-2031
- 15.1. Market Analysis, Insights and Forecast - By Country/Sub-region
- 15.1.1 United States
- 15.1.2 Canada
- 15.1.3 Mexico
- 16. MEA CDN Industry Analysis, Insights and Forecast, 2019-2031
- 16.1. Market Analysis, Insights and Forecast - By Country/Sub-region
- 16.1.1 United Arab Emirates
- 16.1.2 Saudi Arabia
- 16.1.3 South Africa
- 16.1.4 Rest of Middle East and Africa
- 17. Competitive Analysis
- 17.1. Global Market Share Analysis 2024
- 17.2. Company Profiles
- 17.2.1 Fastly Inc
- 17.2.1.1. Overview
- 17.2.1.2. Products
- 17.2.1.3. SWOT Analysis
- 17.2.1.4. Recent Developments
- 17.2.1.5. Financials (Based on Availability)
- 17.2.2 Amazon Web Services Inc (Amazon com Inc )
- 17.2.2.1. Overview
- 17.2.2.2. Products
- 17.2.2.3. SWOT Analysis
- 17.2.2.4. Recent Developments
- 17.2.2.5. Financials (Based on Availability)
- 17.2.3 Akamai Technologies Inc
- 17.2.3.1. Overview
- 17.2.3.2. Products
- 17.2.3.3. SWOT Analysis
- 17.2.3.4. Recent Developments
- 17.2.3.5. Financials (Based on Availability)
- 17.2.4 Google LLC (Alphabet Inc )
- 17.2.4.1. Overview
- 17.2.4.2. Products
- 17.2.4.3. SWOT Analysis
- 17.2.4.4. Recent Developments
- 17.2.4.5. Financials (Based on Availability)
- 17.2.5 Edgio Inc
- 17.2.5.1. Overview
- 17.2.5.2. Products
- 17.2.5.3. SWOT Analysis
- 17.2.5.4. Recent Developments
- 17.2.5.5. Financials (Based on Availability)
- 17.2.6 Microsoft Corporation
- 17.2.6.1. Overview
- 17.2.6.2. Products
- 17.2.6.3. SWOT Analysis
- 17.2.6.4. Recent Developments
- 17.2.6.5. Financials (Based on Availability)
- 17.2.7 Cloudflare Inc
- 17.2.7.1. Overview
- 17.2.7.2. Products
- 17.2.7.3. SWOT Analysis
- 17.2.7.4. Recent Developments
- 17.2.7.5. Financials (Based on Availability)
- 17.2.8 Tata Communications Limite
- 17.2.8.1. Overview
- 17.2.8.2. Products
- 17.2.8.3. SWOT Analysis
- 17.2.8.4. Recent Developments
- 17.2.8.5. Financials (Based on Availability)
- 17.2.9 AT&T Inc
- 17.2.9.1. Overview
- 17.2.9.2. Products
- 17.2.9.3. SWOT Analysis
- 17.2.9.4. Recent Developments
- 17.2.9.5. Financials (Based on Availability)
- 17.2.10 CDNetworks Inc
- 17.2.10.1. Overview
- 17.2.10.2. Products
- 17.2.10.3. SWOT Analysis
- 17.2.10.4. Recent Developments
- 17.2.10.5. Financials (Based on Availability)
- 17.2.1 Fastly Inc
List of Figures
- Figure 1: Global CDN Industry Revenue Breakdown (Million, %) by Region 2024 & 2032
- Figure 2: Global CDN Industry Volume Breakdown (K Unit, %) by Region 2024 & 2032
- Figure 3: North America CDN Industry Revenue (Million), by Country 2024 & 2032
- Figure 4: North America CDN Industry Volume (K Unit), by Country 2024 & 2032
- Figure 5: North America CDN Industry Revenue Share (%), by Country 2024 & 2032
- Figure 6: North America CDN Industry Volume Share (%), by Country 2024 & 2032
- Figure 7: Europe CDN Industry Revenue (Million), by Country 2024 & 2032
- Figure 8: Europe CDN Industry Volume (K Unit), by Country 2024 & 2032
- Figure 9: Europe CDN Industry Revenue Share (%), by Country 2024 & 2032
- Figure 10: Europe CDN Industry Volume Share (%), by Country 2024 & 2032
- Figure 11: Asia Pacific CDN Industry Revenue (Million), by Country 2024 & 2032
- Figure 12: Asia Pacific CDN Industry Volume (K Unit), by Country 2024 & 2032
- Figure 13: Asia Pacific CDN Industry Revenue Share (%), by Country 2024 & 2032
- Figure 14: Asia Pacific CDN Industry Volume Share (%), by Country 2024 & 2032
- Figure 15: South America CDN Industry Revenue (Million), by Country 2024 & 2032
- Figure 16: South America CDN Industry Volume (K Unit), by Country 2024 & 2032
- Figure 17: South America CDN Industry Revenue Share (%), by Country 2024 & 2032
- Figure 18: South America CDN Industry Volume Share (%), by Country 2024 & 2032
- Figure 19: North America CDN Industry Revenue (Million), by Country 2024 & 2032
- Figure 20: North America CDN Industry Volume (K Unit), by Country 2024 & 2032
- Figure 21: North America CDN Industry Revenue Share (%), by Country 2024 & 2032
- Figure 22: North America CDN Industry Volume Share (%), by Country 2024 & 2032
- Figure 23: MEA CDN Industry Revenue (Million), by Country 2024 & 2032
- Figure 24: MEA CDN Industry Volume (K Unit), by Country 2024 & 2032
- Figure 25: MEA CDN Industry Revenue Share (%), by Country 2024 & 2032
- Figure 26: MEA CDN Industry Volume Share (%), by Country 2024 & 2032
- Figure 27: North America CDN Industry Revenue (Million), by Offering 2024 & 2032
- Figure 28: North America CDN Industry Volume (K Unit), by Offering 2024 & 2032
- Figure 29: North America CDN Industry Revenue Share (%), by Offering 2024 & 2032
- Figure 30: North America CDN Industry Volume Share (%), by Offering 2024 & 2032
- Figure 31: North America CDN Industry Revenue (Million), by End User 2024 & 2032
- Figure 32: North America CDN Industry Volume (K Unit), by End User 2024 & 2032
- Figure 33: North America CDN Industry Revenue Share (%), by End User 2024 & 2032
- Figure 34: North America CDN Industry Volume Share (%), by End User 2024 & 2032
- Figure 35: North America CDN Industry Revenue (Million), by Country 2024 & 2032
- Figure 36: North America CDN Industry Volume (K Unit), by Country 2024 & 2032
- Figure 37: North America CDN Industry Revenue Share (%), by Country 2024 & 2032
- Figure 38: North America CDN Industry Volume Share (%), by Country 2024 & 2032
- Figure 39: Europe CDN Industry Revenue (Million), by Offering 2024 & 2032
- Figure 40: Europe CDN Industry Volume (K Unit), by Offering 2024 & 2032
- Figure 41: Europe CDN Industry Revenue Share (%), by Offering 2024 & 2032
- Figure 42: Europe CDN Industry Volume Share (%), by Offering 2024 & 2032
- Figure 43: Europe CDN Industry Revenue (Million), by End User 2024 & 2032
- Figure 44: Europe CDN Industry Volume (K Unit), by End User 2024 & 2032
- Figure 45: Europe CDN Industry Revenue Share (%), by End User 2024 & 2032
- Figure 46: Europe CDN Industry Volume Share (%), by End User 2024 & 2032
- Figure 47: Europe CDN Industry Revenue (Million), by Country 2024 & 2032
- Figure 48: Europe CDN Industry Volume (K Unit), by Country 2024 & 2032
- Figure 49: Europe CDN Industry Revenue Share (%), by Country 2024 & 2032
- Figure 50: Europe CDN Industry Volume Share (%), by Country 2024 & 2032
- Figure 51: Asia Pacific CDN Industry Revenue (Million), by Offering 2024 & 2032
- Figure 52: Asia Pacific CDN Industry Volume (K Unit), by Offering 2024 & 2032
- Figure 53: Asia Pacific CDN Industry Revenue Share (%), by Offering 2024 & 2032
- Figure 54: Asia Pacific CDN Industry Volume Share (%), by Offering 2024 & 2032
- Figure 55: Asia Pacific CDN Industry Revenue (Million), by End User 2024 & 2032
- Figure 56: Asia Pacific CDN Industry Volume (K Unit), by End User 2024 & 2032
- Figure 57: Asia Pacific CDN Industry Revenue Share (%), by End User 2024 & 2032
- Figure 58: Asia Pacific CDN Industry Volume Share (%), by End User 2024 & 2032
- Figure 59: Asia Pacific CDN Industry Revenue (Million), by Country 2024 & 2032
- Figure 60: Asia Pacific CDN Industry Volume (K Unit), by Country 2024 & 2032
- Figure 61: Asia Pacific CDN Industry Revenue Share (%), by Country 2024 & 2032
- Figure 62: Asia Pacific CDN Industry Volume Share (%), by Country 2024 & 2032
- Figure 63: Latin America CDN Industry Revenue (Million), by Offering 2024 & 2032
- Figure 64: Latin America CDN Industry Volume (K Unit), by Offering 2024 & 2032
- Figure 65: Latin America CDN Industry Revenue Share (%), by Offering 2024 & 2032
- Figure 66: Latin America CDN Industry Volume Share (%), by Offering 2024 & 2032
- Figure 67: Latin America CDN Industry Revenue (Million), by End User 2024 & 2032
- Figure 68: Latin America CDN Industry Volume (K Unit), by End User 2024 & 2032
- Figure 69: Latin America CDN Industry Revenue Share (%), by End User 2024 & 2032
- Figure 70: Latin America CDN Industry Volume Share (%), by End User 2024 & 2032
- Figure 71: Latin America CDN Industry Revenue (Million), by Country 2024 & 2032
- Figure 72: Latin America CDN Industry Volume (K Unit), by Country 2024 & 2032
- Figure 73: Latin America CDN Industry Revenue Share (%), by Country 2024 & 2032
- Figure 74: Latin America CDN Industry Volume Share (%), by Country 2024 & 2032
- Figure 75: Middle East and Africa CDN Industry Revenue (Million), by Offering 2024 & 2032
- Figure 76: Middle East and Africa CDN Industry Volume (K Unit), by Offering 2024 & 2032
- Figure 77: Middle East and Africa CDN Industry Revenue Share (%), by Offering 2024 & 2032
- Figure 78: Middle East and Africa CDN Industry Volume Share (%), by Offering 2024 & 2032
- Figure 79: Middle East and Africa CDN Industry Revenue (Million), by End User 2024 & 2032
- Figure 80: Middle East and Africa CDN Industry Volume (K Unit), by End User 2024 & 2032
- Figure 81: Middle East and Africa CDN Industry Revenue Share (%), by End User 2024 & 2032
- Figure 82: Middle East and Africa CDN Industry Volume Share (%), by End User 2024 & 2032
- Figure 83: Middle East and Africa CDN Industry Revenue (Million), by Country 2024 & 2032
- Figure 84: Middle East and Africa CDN Industry Volume (K Unit), by Country 2024 & 2032
- Figure 85: Middle East and Africa CDN Industry Revenue Share (%), by Country 2024 & 2032
- Figure 86: Middle East and Africa CDN Industry Volume Share (%), by Country 2024 & 2032
List of Tables
- Table 1: Global CDN Industry Revenue Million Forecast, by Region 2019 & 2032
- Table 2: Global CDN Industry Volume K Unit Forecast, by Region 2019 & 2032
- Table 3: Global CDN Industry Revenue Million Forecast, by Offering 2019 & 2032
- Table 4: Global CDN Industry Volume K Unit Forecast, by Offering 2019 & 2032
- Table 5: Global CDN Industry Revenue Million Forecast, by End User 2019 & 2032
- Table 6: Global CDN Industry Volume K Unit Forecast, by End User 2019 & 2032
- Table 7: Global CDN Industry Revenue Million Forecast, by Region 2019 & 2032
- Table 8: Global CDN Industry Volume K Unit Forecast, by Region 2019 & 2032
- Table 9: Global CDN Industry Revenue Million Forecast, by Country 2019 & 2032
- Table 10: Global CDN Industry Volume K Unit Forecast, by Country 2019 & 2032
- Table 11: United States CDN Industry Revenue (Million) Forecast, by Application 2019 & 2032
- Table 12: United States CDN Industry Volume (K Unit) Forecast, by Application 2019 & 2032
- Table 13: Canada CDN Industry Revenue (Million) Forecast, by Application 2019 & 2032
- Table 14: Canada CDN Industry Volume (K Unit) Forecast, by Application 2019 & 2032
- Table 15: Mexico CDN Industry Revenue (Million) Forecast, by Application 2019 & 2032
- Table 16: Mexico CDN Industry Volume (K Unit) Forecast, by Application 2019 & 2032
- Table 17: Global CDN Industry Revenue Million Forecast, by Country 2019 & 2032
- Table 18: Global CDN Industry Volume K Unit Forecast, by Country 2019 & 2032
- Table 19: Germany CDN Industry Revenue (Million) Forecast, by Application 2019 & 2032
- Table 20: Germany CDN Industry Volume (K Unit) Forecast, by Application 2019 & 2032
- Table 21: United Kingdom CDN Industry Revenue (Million) Forecast, by Application 2019 & 2032
- Table 22: United Kingdom CDN Industry Volume (K Unit) Forecast, by Application 2019 & 2032
- Table 23: France CDN Industry Revenue (Million) Forecast, by Application 2019 & 2032
- Table 24: France CDN Industry Volume (K Unit) Forecast, by Application 2019 & 2032
- Table 25: Spain CDN Industry Revenue (Million) Forecast, by Application 2019 & 2032
- Table 26: Spain CDN Industry Volume (K Unit) Forecast, by Application 2019 & 2032
- Table 27: Italy CDN Industry Revenue (Million) Forecast, by Application 2019 & 2032
- Table 28: Italy CDN Industry Volume (K Unit) Forecast, by Application 2019 & 2032
- Table 29: Spain CDN Industry Revenue (Million) Forecast, by Application 2019 & 2032
- Table 30: Spain CDN Industry Volume (K Unit) Forecast, by Application 2019 & 2032
- Table 31: Belgium CDN Industry Revenue (Million) Forecast, by Application 2019 & 2032
- Table 32: Belgium CDN Industry Volume (K Unit) Forecast, by Application 2019 & 2032
- Table 33: Netherland CDN Industry Revenue (Million) Forecast, by Application 2019 & 2032
- Table 34: Netherland CDN Industry Volume (K Unit) Forecast, by Application 2019 & 2032
- Table 35: Nordics CDN Industry Revenue (Million) Forecast, by Application 2019 & 2032
- Table 36: Nordics CDN Industry Volume (K Unit) Forecast, by Application 2019 & 2032
- Table 37: Rest of Europe CDN Industry Revenue (Million) Forecast, by Application 2019 & 2032
- Table 38: Rest of Europe CDN Industry Volume (K Unit) Forecast, by Application 2019 & 2032
- Table 39: Global CDN Industry Revenue Million Forecast, by Country 2019 & 2032
- Table 40: Global CDN Industry Volume K Unit Forecast, by Country 2019 & 2032
- Table 41: China CDN Industry Revenue (Million) Forecast, by Application 2019 & 2032
- Table 42: China CDN Industry Volume (K Unit) Forecast, by Application 2019 & 2032
- Table 43: Japan CDN Industry Revenue (Million) Forecast, by Application 2019 & 2032
- Table 44: Japan CDN Industry Volume (K Unit) Forecast, by Application 2019 & 2032
- Table 45: India CDN Industry Revenue (Million) Forecast, by Application 2019 & 2032
- Table 46: India CDN Industry Volume (K Unit) Forecast, by Application 2019 & 2032
- Table 47: South Korea CDN Industry Revenue (Million) Forecast, by Application 2019 & 2032
- Table 48: South Korea CDN Industry Volume (K Unit) Forecast, by Application 2019 & 2032
- Table 49: Southeast Asia CDN Industry Revenue (Million) Forecast, by Application 2019 & 2032
- Table 50: Southeast Asia CDN Industry Volume (K Unit) Forecast, by Application 2019 & 2032
- Table 51: Australia CDN Industry Revenue (Million) Forecast, by Application 2019 & 2032
- Table 52: Australia CDN Industry Volume (K Unit) Forecast, by Application 2019 & 2032
- Table 53: Indonesia CDN Industry Revenue (Million) Forecast, by Application 2019 & 2032
- Table 54: Indonesia CDN Industry Volume (K Unit) Forecast, by Application 2019 & 2032
- Table 55: Phillipes CDN Industry Revenue (Million) Forecast, by Application 2019 & 2032
- Table 56: Phillipes CDN Industry Volume (K Unit) Forecast, by Application 2019 & 2032
- Table 57: Singapore CDN Industry Revenue (Million) Forecast, by Application 2019 & 2032
- Table 58: Singapore CDN Industry Volume (K Unit) Forecast, by Application 2019 & 2032
- Table 59: Thailandc CDN Industry Revenue (Million) Forecast, by Application 2019 & 2032
- Table 60: Thailandc CDN Industry Volume (K Unit) Forecast, by Application 2019 & 2032
- Table 61: Rest of Asia Pacific CDN Industry Revenue (Million) Forecast, by Application 2019 & 2032
- Table 62: Rest of Asia Pacific CDN Industry Volume (K Unit) Forecast, by Application 2019 & 2032
- Table 63: Global CDN Industry Revenue Million Forecast, by Country 2019 & 2032
- Table 64: Global CDN Industry Volume K Unit Forecast, by Country 2019 & 2032
- Table 65: Brazil CDN Industry Revenue (Million) Forecast, by Application 2019 & 2032
- Table 66: Brazil CDN Industry Volume (K Unit) Forecast, by Application 2019 & 2032
- Table 67: Argentina CDN Industry Revenue (Million) Forecast, by Application 2019 & 2032
- Table 68: Argentina CDN Industry Volume (K Unit) Forecast, by Application 2019 & 2032
- Table 69: Peru CDN Industry Revenue (Million) Forecast, by Application 2019 & 2032
- Table 70: Peru CDN Industry Volume (K Unit) Forecast, by Application 2019 & 2032
- Table 71: Chile CDN Industry Revenue (Million) Forecast, by Application 2019 & 2032
- Table 72: Chile CDN Industry Volume (K Unit) Forecast, by Application 2019 & 2032
- Table 73: Colombia CDN Industry Revenue (Million) Forecast, by Application 2019 & 2032
- Table 74: Colombia CDN Industry Volume (K Unit) Forecast, by Application 2019 & 2032
- Table 75: Ecuador CDN Industry Revenue (Million) Forecast, by Application 2019 & 2032
- Table 76: Ecuador CDN Industry Volume (K Unit) Forecast, by Application 2019 & 2032
- Table 77: Venezuela CDN Industry Revenue (Million) Forecast, by Application 2019 & 2032
- Table 78: Venezuela CDN Industry Volume (K Unit) Forecast, by Application 2019 & 2032
- Table 79: Rest of South America CDN Industry Revenue (Million) Forecast, by Application 2019 & 2032
- Table 80: Rest of South America CDN Industry Volume (K Unit) Forecast, by Application 2019 & 2032
- Table 81: Global CDN Industry Revenue Million Forecast, by Country 2019 & 2032
- Table 82: Global CDN Industry Volume K Unit Forecast, by Country 2019 & 2032
- Table 83: United States CDN Industry Revenue (Million) Forecast, by Application 2019 & 2032
- Table 84: United States CDN Industry Volume (K Unit) Forecast, by Application 2019 & 2032
- Table 85: Canada CDN Industry Revenue (Million) Forecast, by Application 2019 & 2032
- Table 86: Canada CDN Industry Volume (K Unit) Forecast, by Application 2019 & 2032
- Table 87: Mexico CDN Industry Revenue (Million) Forecast, by Application 2019 & 2032
- Table 88: Mexico CDN Industry Volume (K Unit) Forecast, by Application 2019 & 2032
- Table 89: Global CDN Industry Revenue Million Forecast, by Country 2019 & 2032
- Table 90: Global CDN Industry Volume K Unit Forecast, by Country 2019 & 2032
- Table 91: United Arab Emirates CDN Industry Revenue (Million) Forecast, by Application 2019 & 2032
- Table 92: United Arab Emirates CDN Industry Volume (K Unit) Forecast, by Application 2019 & 2032
- Table 93: Saudi Arabia CDN Industry Revenue (Million) Forecast, by Application 2019 & 2032
- Table 94: Saudi Arabia CDN Industry Volume (K Unit) Forecast, by Application 2019 & 2032
- Table 95: South Africa CDN Industry Revenue (Million) Forecast, by Application 2019 & 2032
- Table 96: South Africa CDN Industry Volume (K Unit) Forecast, by Application 2019 & 2032
- Table 97: Rest of Middle East and Africa CDN Industry Revenue (Million) Forecast, by Application 2019 & 2032
- Table 98: Rest of Middle East and Africa CDN Industry Volume (K Unit) Forecast, by Application 2019 & 2032
- Table 99: Global CDN Industry Revenue Million Forecast, by Offering 2019 & 2032
- Table 100: Global CDN Industry Volume K Unit Forecast, by Offering 2019 & 2032
- Table 101: Global CDN Industry Revenue Million Forecast, by End User 2019 & 2032
- Table 102: Global CDN Industry Volume K Unit Forecast, by End User 2019 & 2032
- Table 103: Global CDN Industry Revenue Million Forecast, by Country 2019 & 2032
- Table 104: Global CDN Industry Volume K Unit Forecast, by Country 2019 & 2032
- Table 105: United States CDN Industry Revenue (Million) Forecast, by Application 2019 & 2032
- Table 106: United States CDN Industry Volume (K Unit) Forecast, by Application 2019 & 2032
- Table 107: Canada CDN Industry Revenue (Million) Forecast, by Application 2019 & 2032
- Table 108: Canada CDN Industry Volume (K Unit) Forecast, by Application 2019 & 2032
- Table 109: Global CDN Industry Revenue Million Forecast, by Offering 2019 & 2032
- Table 110: Global CDN Industry Volume K Unit Forecast, by Offering 2019 & 2032
- Table 111: Global CDN Industry Revenue Million Forecast, by End User 2019 & 2032
- Table 112: Global CDN Industry Volume K Unit Forecast, by End User 2019 & 2032
- Table 113: Global CDN Industry Revenue Million Forecast, by Country 2019 & 2032
- Table 114: Global CDN Industry Volume K Unit Forecast, by Country 2019 & 2032
- Table 115: Germany CDN Industry Revenue (Million) Forecast, by Application 2019 & 2032
- Table 116: Germany CDN Industry Volume (K Unit) Forecast, by Application 2019 & 2032
- Table 117: United Kingdom CDN Industry Revenue (Million) Forecast, by Application 2019 & 2032
- Table 118: United Kingdom CDN Industry Volume (K Unit) Forecast, by Application 2019 & 2032
- Table 119: France CDN Industry Revenue (Million) Forecast, by Application 2019 & 2032
- Table 120: France CDN Industry Volume (K Unit) Forecast, by Application 2019 & 2032
- Table 121: Rest of Europe CDN Industry Revenue (Million) Forecast, by Application 2019 & 2032
- Table 122: Rest of Europe CDN Industry Volume (K Unit) Forecast, by Application 2019 & 2032
- Table 123: Global CDN Industry Revenue Million Forecast, by Offering 2019 & 2032
- Table 124: Global CDN Industry Volume K Unit Forecast, by Offering 2019 & 2032
- Table 125: Global CDN Industry Revenue Million Forecast, by End User 2019 & 2032
- Table 126: Global CDN Industry Volume K Unit Forecast, by End User 2019 & 2032
- Table 127: Global CDN Industry Revenue Million Forecast, by Country 2019 & 2032
- Table 128: Global CDN Industry Volume K Unit Forecast, by Country 2019 & 2032
- Table 129: China CDN Industry Revenue (Million) Forecast, by Application 2019 & 2032
- Table 130: China CDN Industry Volume (K Unit) Forecast, by Application 2019 & 2032
- Table 131: Japan CDN Industry Revenue (Million) Forecast, by Application 2019 & 2032
- Table 132: Japan CDN Industry Volume (K Unit) Forecast, by Application 2019 & 2032
- Table 133: India CDN Industry Revenue (Million) Forecast, by Application 2019 & 2032
- Table 134: India CDN Industry Volume (K Unit) Forecast, by Application 2019 & 2032
- Table 135: South Korea CDN Industry Revenue (Million) Forecast, by Application 2019 & 2032
- Table 136: South Korea CDN Industry Volume (K Unit) Forecast, by Application 2019 & 2032
- Table 137: Rest of Asia Pacific CDN Industry Revenue (Million) Forecast, by Application 2019 & 2032
- Table 138: Rest of Asia Pacific CDN Industry Volume (K Unit) Forecast, by Application 2019 & 2032
- Table 139: Global CDN Industry Revenue Million Forecast, by Offering 2019 & 2032
- Table 140: Global CDN Industry Volume K Unit Forecast, by Offering 2019 & 2032
- Table 141: Global CDN Industry Revenue Million Forecast, by End User 2019 & 2032
- Table 142: Global CDN Industry Volume K Unit Forecast, by End User 2019 & 2032
- Table 143: Global CDN Industry Revenue Million Forecast, by Country 2019 & 2032
- Table 144: Global CDN Industry Volume K Unit Forecast, by Country 2019 & 2032
- Table 145: Brazil CDN Industry Revenue (Million) Forecast, by Application 2019 & 2032
- Table 146: Brazil CDN Industry Volume (K Unit) Forecast, by Application 2019 & 2032
- Table 147: Mexico CDN Industry Revenue (Million) Forecast, by Application 2019 & 2032
- Table 148: Mexico CDN Industry Volume (K Unit) Forecast, by Application 2019 & 2032
- Table 149: Rest of Latin America CDN Industry Revenue (Million) Forecast, by Application 2019 & 2032
- Table 150: Rest of Latin America CDN Industry Volume (K Unit) Forecast, by Application 2019 & 2032
- Table 151: Global CDN Industry Revenue Million Forecast, by Offering 2019 & 2032
- Table 152: Global CDN Industry Volume K Unit Forecast, by Offering 2019 & 2032
- Table 153: Global CDN Industry Revenue Million Forecast, by End User 2019 & 2032
- Table 154: Global CDN Industry Volume K Unit Forecast, by End User 2019 & 2032
- Table 155: Global CDN Industry Revenue Million Forecast, by Country 2019 & 2032
- Table 156: Global CDN Industry Volume K Unit Forecast, by Country 2019 & 2032
- Table 157: United Arab Emirates CDN Industry Revenue (Million) Forecast, by Application 2019 & 2032
- Table 158: United Arab Emirates CDN Industry Volume (K Unit) Forecast, by Application 2019 & 2032
- Table 159: South Africa CDN Industry Revenue (Million) Forecast, by Application 2019 & 2032
- Table 160: South Africa CDN Industry Volume (K Unit) Forecast, by Application 2019 & 2032
- Table 161: Saudi Arabia CDN Industry Revenue (Million) Forecast, by Application 2019 & 2032
- Table 162: Saudi Arabia CDN Industry Volume (K Unit) Forecast, by Application 2019 & 2032
- Table 163: Rest of Middle East CDN Industry Revenue (Million) Forecast, by Application 2019 & 2032
- Table 164: Rest of Middle East CDN Industry Volume (K Unit) Forecast, by Application 2019 & 2032
Frequently Asked Questions
1. What is the projected Compound Annual Growth Rate (CAGR) of the CDN Industry?
The projected CAGR is approximately 11.26%.
2. Which companies are prominent players in the CDN Industry?
Key companies in the market include Fastly Inc, Amazon Web Services Inc (Amazon com Inc ), Akamai Technologies Inc, Google LLC (Alphabet Inc ), Edgio Inc, Microsoft Corporation, Cloudflare Inc, Tata Communications Limite, AT&T Inc, CDNetworks Inc.
3. What are the main segments of the CDN Industry?
The market segments include Offering, End User.
4. Can you provide details about the market size?
The market size is estimated to be USD 23.79 Million as of 2022.
5. What are some drivers contributing to market growth?
Increasing Online Users. Per Capita Online Consumption. and Demand for High -quality Video Content� Drives Growth; Growing Demand from Online Gaming Industries Adding to Market Growth.
6. What are the notable trends driving market growth?
Media and Entertainment (M&E) segment to Witness Major Growth.
7. Are there any restraints impacting market growth?
Larger Organizations Tending to Build their Own CDNS; Bandwidth Concerns Particularly in Developing and Undeveloped Economies.
8. Can you provide examples of recent developments in the market?
September 2023 - The Edgio announced a strategic partnership with streaming technology providers Accedo, Bitmovin, Grabyo, and Vimond to address the rising need faced by media and entertainment when it comes to delivering OTT video due to its ability to quickly assemble and manage a streaming ecosystem that brings high-quality linear, live or on-demand video while reducing costs and growing efficiencies, which would support its market share in line with the strategic growth through partnerships.
9. What pricing options are available for accessing the report?
Pricing options include single-user, multi-user, and enterprise licenses priced at USD 4750, USD 5250, and USD 8750 respectively.
10. Is the market size provided in terms of value or volume?
The market size is provided in terms of value, measured in Million and volume, measured in K Unit.
11. Are there any specific market keywords associated with the report?
Yes, the market keyword associated with the report is "CDN Industry," which aids in identifying and referencing the specific market segment covered.
12. How do I determine which pricing option suits my needs best?
The pricing options vary based on user requirements and access needs. Individual users may opt for single-user licenses, while businesses requiring broader access may choose multi-user or enterprise licenses for cost-effective access to the report.
13. Are there any additional resources or data provided in the CDN Industry report?
While the report offers comprehensive insights, it's advisable to review the specific contents or supplementary materials provided to ascertain if additional resources or data are available.
14. How can I stay updated on further developments or reports in the CDN Industry?
To stay informed about further developments, trends, and reports in the CDN Industry, consider subscribing to industry newsletters, following relevant companies and organizations, or regularly checking reputable industry news sources and publications.
Methodology
Step 1 - Identification of Relevant Samples Size from Population Database


Step 2 - Approaches for Defining Global Market Size (Value, Volume* & Price*)

Note*: In applicable scenarios
Step 3 - Data Sources
Primary Research
- Web Analytics
- Survey Reports
- Research Institute
- Latest Research Reports
- Opinion Leaders
Secondary Research
- Annual Reports
- White Paper
- Latest Press Release
- Industry Association
- Paid Database
- Investor Presentations

Step 4 - Data Triangulation
Involves using different sources of information in order to increase the validity of a study
These sources are likely to be stakeholders in a program - participants, other researchers, program staff, other community members, and so on.
Then we put all data in single framework & apply various statistical tools to find out the dynamic on the market.
During the analysis stage, feedback from the stakeholder groups would be compared to determine areas of agreement as well as areas of divergence


