
Key Insights
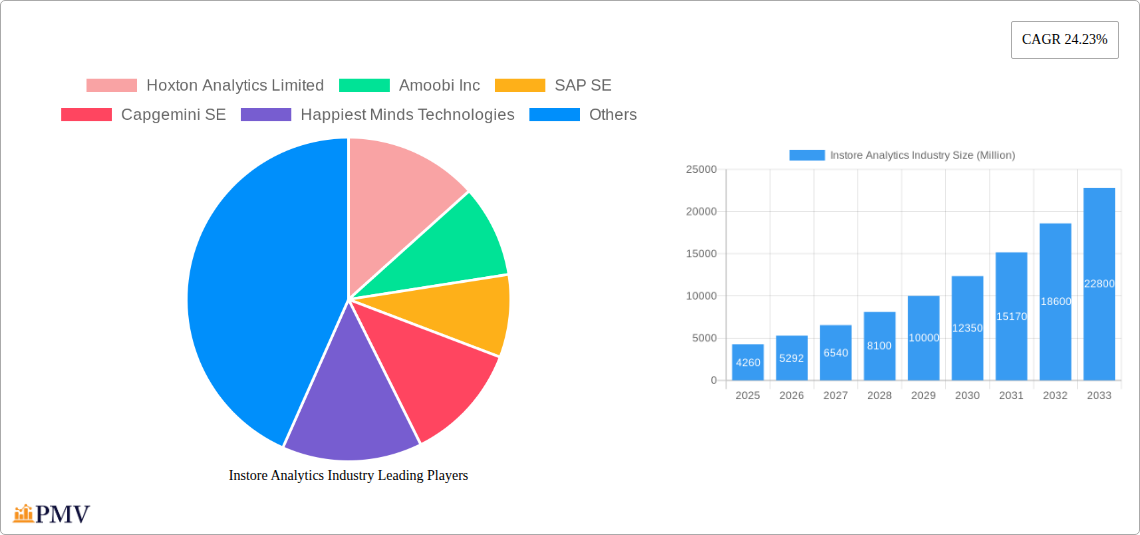
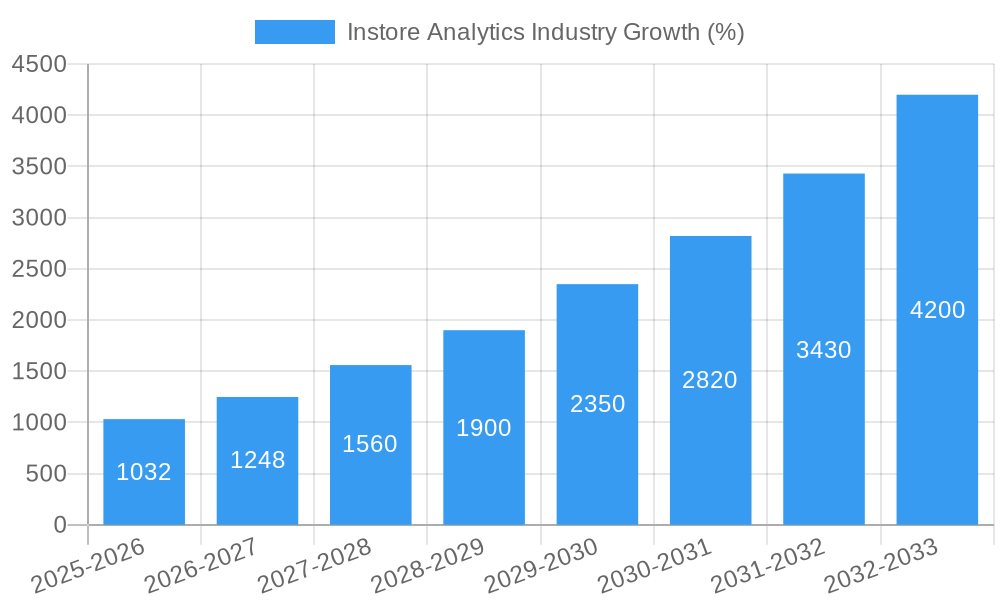
The Instore Analytics market is experiencing robust growth, projected to reach \$4.26 billion in 2025 and exhibiting a Compound Annual Growth Rate (CAGR) of 24.23% from 2025 to 2033. This expansion is fueled by several key drivers. Retailers are increasingly leveraging data-driven insights to optimize store operations, enhance customer experiences, and improve profitability. The rise of cloud-based solutions offers scalability and accessibility, fostering wider adoption across businesses of all sizes. Furthermore, advancements in technologies like computer vision, AI, and IoT are enabling more sophisticated analytics, providing granular insights into customer behavior, product placement, and inventory management. The increasing focus on personalized shopping experiences and the need for efficient supply chain management further contribute to market growth. Segmentation reveals a strong preference for cloud-based deployments and software solutions, reflecting the industry's shift toward digital transformation. Large enterprises currently dominate the market share, but the expanding adoption among SMEs signifies a future avenue for significant growth. The diverse application landscape, ranging from customer management and risk mitigation to optimized merchandise and store operations, underscores the versatility and critical role of instore analytics in modern retail strategies.
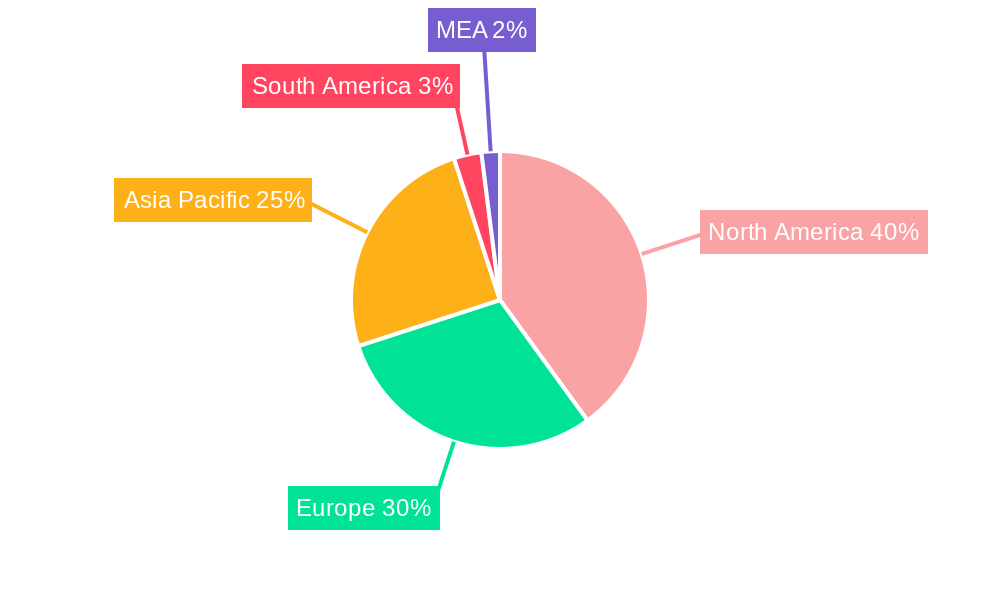
Geographical analysis indicates a significant presence across North America, Europe, and the Asia-Pacific region. North America is currently leading the market due to the early adoption of advanced technologies and the presence of major market players. However, Asia-Pacific is expected to witness accelerated growth driven by the rapid expansion of e-commerce and the increasing digitalization of brick-and-mortar stores in emerging markets like India and China. Europe is also poised for continued growth fueled by strong regulatory frameworks promoting data privacy and the increasing adoption of omnichannel retail strategies. The continued development and refinement of instore analytics technologies, coupled with a growing demand for actionable insights across various retail sectors, will sustain this market’s impressive growth trajectory in the coming years.
In-Store Analytics Market: A Comprehensive Report (2019-2033)
This comprehensive report provides an in-depth analysis of the In-Store Analytics market, offering actionable insights for businesses operating within this dynamic sector. With a study period spanning 2019-2033, a base year of 2025, and a forecast period of 2025-2033, this report leverages historical data (2019-2024) and projected figures to deliver a robust understanding of market trends, competitive dynamics, and future growth potential. The global In-Store Analytics market is estimated to reach xx Million by 2025 and is projected to grow at a xx% CAGR during the forecast period.
In-Store Analytics Industry Market Structure & Competitive Dynamics
This section analyzes the competitive landscape of the In-Store Analytics market, examining market concentration, innovation ecosystems, regulatory frameworks, product substitutes, end-user trends, and mergers & acquisitions (M&A) activities. The market is characterized by a mix of established players like SAP SE and Capgemini SE, and emerging innovative companies like Hoxton Analytics Limited and Amoobi Inc. Market share is highly dynamic, with the top 5 players holding an estimated xx% of the market in 2025. The value of M&A deals in the sector has shown significant growth in recent years, exceeding xx Million in 2024. Increased regulatory scrutiny regarding data privacy is a significant factor shaping the competitive landscape. The emergence of alternative technologies, such as AI-powered customer behavior analysis, presents both opportunities and challenges for existing players. The increasing demand for seamless omnichannel experiences is driving innovation and pushing companies to develop more integrated solutions.
- Market Concentration: Moderately concentrated, with a few dominant players.
- Innovation Ecosystems: Active, with significant investment in AI and machine learning.
- Regulatory Frameworks: Increasingly stringent data privacy regulations.
- Product Substitutes: Emerging technologies such as AI-powered video analytics.
- End-User Trends: Growing demand for real-time insights and personalized customer experiences.
- M&A Activity: Significant activity driven by consolidation and expansion strategies.
In-Store Analytics Industry Industry Trends & Insights
This section explores key trends shaping the In-Store Analytics market. The market is experiencing robust growth driven by the increasing adoption of advanced analytics technologies by retailers seeking to optimize operations, enhance customer experiences, and improve profitability. The shift towards omnichannel retail and the growing importance of data-driven decision-making are further contributing to market expansion. The COVID-19 pandemic accelerated the adoption of digital technologies, enhancing the demand for in-store analytics solutions. Technological advancements in areas such as computer vision, artificial intelligence, and machine learning are driving innovation and creating new opportunities for market participants. However, challenges remain, including data security concerns and the need for robust integration with existing retail systems.
Dominant Markets & Segments in Instore Analytics Industry
This section identifies the leading regions, countries, and segments within the In-Store Analytics market. The North American market currently holds the largest share, driven by high technology adoption rates and the presence of major retailers. However, the Asia-Pacific region is expected to witness significant growth in the coming years due to increasing digitalization and rising disposable incomes.
- By Component: The Software segment dominates, owing to the high demand for advanced analytical tools and platforms.
- By Deployment: Cloud-based deployments are gaining popularity due to their scalability and cost-effectiveness.
- By Organization Size: Large enterprises are the primary adopters due to their higher budgets and complex needs.
- By Application: Customer Management applications are most prevalent, followed by Store Operations Management.
Key Drivers for Dominance:
- North America: High technology adoption, large retail sector, robust IT infrastructure.
- Asia-Pacific: Rapid economic growth, increasing digitalization, expanding middle class.
- Software Segment: Sophisticated analytics, data visualization, and reporting capabilities.
- Cloud Deployment: Scalability, flexibility, cost-efficiency, and easy accessibility.
- Large Enterprises: Greater resources, advanced technology needs, higher ROI potential.
- Customer Management Applications: Focus on enhancing customer experience and loyalty.
Instore Analytics Industry Product Innovations
Recent product innovations in the In-Store Analytics market have focused on enhancing the capabilities of existing solutions and developing new applications. Advancements in AI and computer vision are enabling more accurate and real-time analysis of customer behavior, leading to more effective personalized marketing campaigns. Integration with other retail technologies, such as POS systems and CRM platforms, is also improving data accessibility and analysis. This has driven the development of solutions that provide comprehensive insights into customer journeys, enabling retailers to optimize store layouts, improve inventory management, and enhance overall customer experience.
Report Segmentation & Scope
This report segments the In-Store Analytics market across various dimensions:
- By Component: Software and Services, with the software segment projected to grow at a xx% CAGR.
- By Deployment: Cloud and On-Premises, with cloud deployment rapidly gaining market share.
- By Organization Size: Large Enterprises and Small & Medium Enterprises (SMEs), with large enterprises driving the majority of market revenue.
- By Application: Customer Management, Risk and Compliance Management, Store Operations Management, Merchandise Management, and Other Applications. Customer Management dominates, exhibiting strong growth potential.
Each segment is analyzed in detail, providing insights into its growth trajectory, market size, and competitive landscape.
Key Drivers of Instore Analytics Industry Growth
Several factors are driving the growth of the In-Store Analytics market, including:
- Technological advancements: AI, machine learning, computer vision, and IoT are creating more sophisticated analytics solutions.
- Rising demand for personalized customer experiences: Retailers are leveraging analytics to understand customer behavior and tailor offerings.
- Growing need for operational efficiency: Analytics help optimize inventory management, staffing, and other operational processes.
- Increasing investment in digital transformation: Businesses are investing heavily in upgrading their IT infrastructure to accommodate advanced analytics solutions.
Challenges in the Instore Analytics Industry Sector
Despite strong growth potential, several challenges hinder the In-Store Analytics market:
- Data security and privacy concerns: Stricter regulations and growing customer awareness necessitate robust data protection measures.
- High implementation costs: Implementing advanced analytics solutions can be expensive, particularly for SMEs.
- Integration complexities: Integrating In-Store Analytics solutions with existing IT systems can be complex and time-consuming.
- Lack of skilled professionals: A shortage of skilled professionals capable of implementing and managing these systems presents a barrier.
Leading Players in the Instore Analytics Industry Market
- Hoxton Analytics Limited
- Amoobi Inc
- SAP SE
- Capgemini SE
- Happiest Minds Technologies
- Cloud4Wi Inc
- Motionloft Inc
- Capillary Technologies
- Thinkinside SRL
- RetailNext Inc
- Trax Image Recognition
Key Developments in Instore Analytics Industry Sector
- December 2022: JRNI partnered with Mad Mobiles to create a complete solution for replicating in-store shopping experiences online. This enhances the omnichannel capabilities and strengthens the customer experience.
- November 2022: A California-based retail firm acquired The Retail Performance Company, expanding its in-store analytics reach in Europe and Asia, significantly increasing market share and capabilities.
Strategic Instore Analytics Industry Market Outlook
The In-Store Analytics market is poised for continued growth, driven by increasing technological advancements and a rising demand for data-driven decision-making within the retail industry. Strategic opportunities exist for companies focusing on developing innovative solutions that address the challenges of data security, integration complexity, and the need for skilled professionals. Companies that can offer seamless, scalable, and cost-effective solutions will be best positioned to capture market share in the years to come. The focus on enhancing the customer experience through personalized offerings and omnichannel integration will continue to be a key driver of market expansion.
Instore Analytics Industry Segmentation
-
1. Component
- 1.1. Software
- 1.2. Services
-
2. Deployment
- 2.1. Cloud
- 2.2. On-Premises
-
3. Organization Size
- 3.1. Large Enterprises
- 3.2. Small & Medium Enterprises
-
4. Application
- 4.1. Customer Management
- 4.2. Risk and Compliance Management
- 4.3. Store Operations Management
- 4.4. Merchandise Management
- 4.5. Other Applications
Instore Analytics Industry Segmentation By Geography
- 1. North America
- 2. Europe
- 3. Asia Pacific
- 4. Latin America
- 5. Middle East and Africa
Instore Analytics Industry REPORT HIGHLIGHTS
| Aspects | Details |
|---|---|
| Study Period | 2019-2033 |
| Base Year | 2024 |
| Estimated Year | 2025 |
| Forecast Period | 2025-2033 |
| Historical Period | 2019-2024 |
| Growth Rate | CAGR of 24.23% from 2019-2033 |
| Segmentation |
|
Table of Contents
- 1. Introduction
- 1.1. Research Scope
- 1.2. Market Segmentation
- 1.3. Research Methodology
- 1.4. Definitions and Assumptions
- 2. Executive Summary
- 2.1. Introduction
- 3. Market Dynamics
- 3.1. Introduction
- 3.2. Market Drivers
- 3.2.1. Increasing advantage of the Cloud; Need for Better Customer Service and Enhanced Shopping Experience; Customer Management Segment to Witness Significant Market Growth
- 3.3. Market Restrains
- 3.3.1. Lack of Personnel Skills
- 3.4. Market Trends
- 3.4.1. Customer Management Segment to Witness Significant Market Growth
- 4. Market Factor Analysis
- 4.1. Porters Five Forces
- 4.2. Supply/Value Chain
- 4.3. PESTEL analysis
- 4.4. Market Entropy
- 4.5. Patent/Trademark Analysis
- 5. Global Instore Analytics Industry Analysis, Insights and Forecast, 2019-2031
- 5.1. Market Analysis, Insights and Forecast - by Component
- 5.1.1. Software
- 5.1.2. Services
- 5.2. Market Analysis, Insights and Forecast - by Deployment
- 5.2.1. Cloud
- 5.2.2. On-Premises
- 5.3. Market Analysis, Insights and Forecast - by Organization Size
- 5.3.1. Large Enterprises
- 5.3.2. Small & Medium Enterprises
- 5.4. Market Analysis, Insights and Forecast - by Application
- 5.4.1. Customer Management
- 5.4.2. Risk and Compliance Management
- 5.4.3. Store Operations Management
- 5.4.4. Merchandise Management
- 5.4.5. Other Applications
- 5.5. Market Analysis, Insights and Forecast - by Region
- 5.5.1. North America
- 5.5.2. Europe
- 5.5.3. Asia Pacific
- 5.5.4. Latin America
- 5.5.5. Middle East and Africa
- 5.1. Market Analysis, Insights and Forecast - by Component
- 6. North America Instore Analytics Industry Analysis, Insights and Forecast, 2019-2031
- 6.1. Market Analysis, Insights and Forecast - by Component
- 6.1.1. Software
- 6.1.2. Services
- 6.2. Market Analysis, Insights and Forecast - by Deployment
- 6.2.1. Cloud
- 6.2.2. On-Premises
- 6.3. Market Analysis, Insights and Forecast - by Organization Size
- 6.3.1. Large Enterprises
- 6.3.2. Small & Medium Enterprises
- 6.4. Market Analysis, Insights and Forecast - by Application
- 6.4.1. Customer Management
- 6.4.2. Risk and Compliance Management
- 6.4.3. Store Operations Management
- 6.4.4. Merchandise Management
- 6.4.5. Other Applications
- 6.1. Market Analysis, Insights and Forecast - by Component
- 7. Europe Instore Analytics Industry Analysis, Insights and Forecast, 2019-2031
- 7.1. Market Analysis, Insights and Forecast - by Component
- 7.1.1. Software
- 7.1.2. Services
- 7.2. Market Analysis, Insights and Forecast - by Deployment
- 7.2.1. Cloud
- 7.2.2. On-Premises
- 7.3. Market Analysis, Insights and Forecast - by Organization Size
- 7.3.1. Large Enterprises
- 7.3.2. Small & Medium Enterprises
- 7.4. Market Analysis, Insights and Forecast - by Application
- 7.4.1. Customer Management
- 7.4.2. Risk and Compliance Management
- 7.4.3. Store Operations Management
- 7.4.4. Merchandise Management
- 7.4.5. Other Applications
- 7.1. Market Analysis, Insights and Forecast - by Component
- 8. Asia Pacific Instore Analytics Industry Analysis, Insights and Forecast, 2019-2031
- 8.1. Market Analysis, Insights and Forecast - by Component
- 8.1.1. Software
- 8.1.2. Services
- 8.2. Market Analysis, Insights and Forecast - by Deployment
- 8.2.1. Cloud
- 8.2.2. On-Premises
- 8.3. Market Analysis, Insights and Forecast - by Organization Size
- 8.3.1. Large Enterprises
- 8.3.2. Small & Medium Enterprises
- 8.4. Market Analysis, Insights and Forecast - by Application
- 8.4.1. Customer Management
- 8.4.2. Risk and Compliance Management
- 8.4.3. Store Operations Management
- 8.4.4. Merchandise Management
- 8.4.5. Other Applications
- 8.1. Market Analysis, Insights and Forecast - by Component
- 9. Latin America Instore Analytics Industry Analysis, Insights and Forecast, 2019-2031
- 9.1. Market Analysis, Insights and Forecast - by Component
- 9.1.1. Software
- 9.1.2. Services
- 9.2. Market Analysis, Insights and Forecast - by Deployment
- 9.2.1. Cloud
- 9.2.2. On-Premises
- 9.3. Market Analysis, Insights and Forecast - by Organization Size
- 9.3.1. Large Enterprises
- 9.3.2. Small & Medium Enterprises
- 9.4. Market Analysis, Insights and Forecast - by Application
- 9.4.1. Customer Management
- 9.4.2. Risk and Compliance Management
- 9.4.3. Store Operations Management
- 9.4.4. Merchandise Management
- 9.4.5. Other Applications
- 9.1. Market Analysis, Insights and Forecast - by Component
- 10. Middle East and Africa Instore Analytics Industry Analysis, Insights and Forecast, 2019-2031
- 10.1. Market Analysis, Insights and Forecast - by Component
- 10.1.1. Software
- 10.1.2. Services
- 10.2. Market Analysis, Insights and Forecast - by Deployment
- 10.2.1. Cloud
- 10.2.2. On-Premises
- 10.3. Market Analysis, Insights and Forecast - by Organization Size
- 10.3.1. Large Enterprises
- 10.3.2. Small & Medium Enterprises
- 10.4. Market Analysis, Insights and Forecast - by Application
- 10.4.1. Customer Management
- 10.4.2. Risk and Compliance Management
- 10.4.3. Store Operations Management
- 10.4.4. Merchandise Management
- 10.4.5. Other Applications
- 10.1. Market Analysis, Insights and Forecast - by Component
- 11. North America Instore Analytics Industry Analysis, Insights and Forecast, 2019-2031
- 11.1. Market Analysis, Insights and Forecast - By Country/Sub-region
- 11.1.1 United States
- 11.1.2 Canada
- 11.1.3 Mexico
- 12. Europe Instore Analytics Industry Analysis, Insights and Forecast, 2019-2031
- 12.1. Market Analysis, Insights and Forecast - By Country/Sub-region
- 12.1.1 Germany
- 12.1.2 United Kingdom
- 12.1.3 France
- 12.1.4 Spain
- 12.1.5 Italy
- 12.1.6 Spain
- 12.1.7 Belgium
- 12.1.8 Netherland
- 12.1.9 Nordics
- 12.1.10 Rest of Europe
- 13. Asia Pacific Instore Analytics Industry Analysis, Insights and Forecast, 2019-2031
- 13.1. Market Analysis, Insights and Forecast - By Country/Sub-region
- 13.1.1 China
- 13.1.2 Japan
- 13.1.3 India
- 13.1.4 South Korea
- 13.1.5 Southeast Asia
- 13.1.6 Australia
- 13.1.7 Indonesia
- 13.1.8 Phillipes
- 13.1.9 Singapore
- 13.1.10 Thailandc
- 13.1.11 Rest of Asia Pacific
- 14. South America Instore Analytics Industry Analysis, Insights and Forecast, 2019-2031
- 14.1. Market Analysis, Insights and Forecast - By Country/Sub-region
- 14.1.1 Brazil
- 14.1.2 Argentina
- 14.1.3 Peru
- 14.1.4 Chile
- 14.1.5 Colombia
- 14.1.6 Ecuador
- 14.1.7 Venezuela
- 14.1.8 Rest of South America
- 15. North America Instore Analytics Industry Analysis, Insights and Forecast, 2019-2031
- 15.1. Market Analysis, Insights and Forecast - By Country/Sub-region
- 15.1.1 United States
- 15.1.2 Canada
- 15.1.3 Mexico
- 16. MEA Instore Analytics Industry Analysis, Insights and Forecast, 2019-2031
- 16.1. Market Analysis, Insights and Forecast - By Country/Sub-region
- 16.1.1 United Arab Emirates
- 16.1.2 Saudi Arabia
- 16.1.3 South Africa
- 16.1.4 Rest of Middle East and Africa
- 17. Competitive Analysis
- 17.1. Global Market Share Analysis 2024
- 17.2. Company Profiles
- 17.2.1 Hoxton Analytics Limited
- 17.2.1.1. Overview
- 17.2.1.2. Products
- 17.2.1.3. SWOT Analysis
- 17.2.1.4. Recent Developments
- 17.2.1.5. Financials (Based on Availability)
- 17.2.2 Amoobi Inc
- 17.2.2.1. Overview
- 17.2.2.2. Products
- 17.2.2.3. SWOT Analysis
- 17.2.2.4. Recent Developments
- 17.2.2.5. Financials (Based on Availability)
- 17.2.3 SAP SE
- 17.2.3.1. Overview
- 17.2.3.2. Products
- 17.2.3.3. SWOT Analysis
- 17.2.3.4. Recent Developments
- 17.2.3.5. Financials (Based on Availability)
- 17.2.4 Capgemini SE
- 17.2.4.1. Overview
- 17.2.4.2. Products
- 17.2.4.3. SWOT Analysis
- 17.2.4.4. Recent Developments
- 17.2.4.5. Financials (Based on Availability)
- 17.2.5 Happiest Minds Technologies
- 17.2.5.1. Overview
- 17.2.5.2. Products
- 17.2.5.3. SWOT Analysis
- 17.2.5.4. Recent Developments
- 17.2.5.5. Financials (Based on Availability)
- 17.2.6 Cloud4Wi Inc
- 17.2.6.1. Overview
- 17.2.6.2. Products
- 17.2.6.3. SWOT Analysis
- 17.2.6.4. Recent Developments
- 17.2.6.5. Financials (Based on Availability)
- 17.2.7 Motionloft Inc
- 17.2.7.1. Overview
- 17.2.7.2. Products
- 17.2.7.3. SWOT Analysis
- 17.2.7.4. Recent Developments
- 17.2.7.5. Financials (Based on Availability)
- 17.2.8 Capillary Technologies
- 17.2.8.1. Overview
- 17.2.8.2. Products
- 17.2.8.3. SWOT Analysis
- 17.2.8.4. Recent Developments
- 17.2.8.5. Financials (Based on Availability)
- 17.2.9 Thinkinside SRL
- 17.2.9.1. Overview
- 17.2.9.2. Products
- 17.2.9.3. SWOT Analysis
- 17.2.9.4. Recent Developments
- 17.2.9.5. Financials (Based on Availability)
- 17.2.10 RetailNext Inc
- 17.2.10.1. Overview
- 17.2.10.2. Products
- 17.2.10.3. SWOT Analysis
- 17.2.10.4. Recent Developments
- 17.2.10.5. Financials (Based on Availability)
- 17.2.11 Trax Image Recognition
- 17.2.11.1. Overview
- 17.2.11.2. Products
- 17.2.11.3. SWOT Analysis
- 17.2.11.4. Recent Developments
- 17.2.11.5. Financials (Based on Availability)
- 17.2.1 Hoxton Analytics Limited
List of Figures
- Figure 1: Global Instore Analytics Industry Revenue Breakdown (Million, %) by Region 2024 & 2032
- Figure 2: North America Instore Analytics Industry Revenue (Million), by Country 2024 & 2032
- Figure 3: North America Instore Analytics Industry Revenue Share (%), by Country 2024 & 2032
- Figure 4: Europe Instore Analytics Industry Revenue (Million), by Country 2024 & 2032
- Figure 5: Europe Instore Analytics Industry Revenue Share (%), by Country 2024 & 2032
- Figure 6: Asia Pacific Instore Analytics Industry Revenue (Million), by Country 2024 & 2032
- Figure 7: Asia Pacific Instore Analytics Industry Revenue Share (%), by Country 2024 & 2032
- Figure 8: South America Instore Analytics Industry Revenue (Million), by Country 2024 & 2032
- Figure 9: South America Instore Analytics Industry Revenue Share (%), by Country 2024 & 2032
- Figure 10: North America Instore Analytics Industry Revenue (Million), by Country 2024 & 2032
- Figure 11: North America Instore Analytics Industry Revenue Share (%), by Country 2024 & 2032
- Figure 12: MEA Instore Analytics Industry Revenue (Million), by Country 2024 & 2032
- Figure 13: MEA Instore Analytics Industry Revenue Share (%), by Country 2024 & 2032
- Figure 14: North America Instore Analytics Industry Revenue (Million), by Component 2024 & 2032
- Figure 15: North America Instore Analytics Industry Revenue Share (%), by Component 2024 & 2032
- Figure 16: North America Instore Analytics Industry Revenue (Million), by Deployment 2024 & 2032
- Figure 17: North America Instore Analytics Industry Revenue Share (%), by Deployment 2024 & 2032
- Figure 18: North America Instore Analytics Industry Revenue (Million), by Organization Size 2024 & 2032
- Figure 19: North America Instore Analytics Industry Revenue Share (%), by Organization Size 2024 & 2032
- Figure 20: North America Instore Analytics Industry Revenue (Million), by Application 2024 & 2032
- Figure 21: North America Instore Analytics Industry Revenue Share (%), by Application 2024 & 2032
- Figure 22: North America Instore Analytics Industry Revenue (Million), by Country 2024 & 2032
- Figure 23: North America Instore Analytics Industry Revenue Share (%), by Country 2024 & 2032
- Figure 24: Europe Instore Analytics Industry Revenue (Million), by Component 2024 & 2032
- Figure 25: Europe Instore Analytics Industry Revenue Share (%), by Component 2024 & 2032
- Figure 26: Europe Instore Analytics Industry Revenue (Million), by Deployment 2024 & 2032
- Figure 27: Europe Instore Analytics Industry Revenue Share (%), by Deployment 2024 & 2032
- Figure 28: Europe Instore Analytics Industry Revenue (Million), by Organization Size 2024 & 2032
- Figure 29: Europe Instore Analytics Industry Revenue Share (%), by Organization Size 2024 & 2032
- Figure 30: Europe Instore Analytics Industry Revenue (Million), by Application 2024 & 2032
- Figure 31: Europe Instore Analytics Industry Revenue Share (%), by Application 2024 & 2032
- Figure 32: Europe Instore Analytics Industry Revenue (Million), by Country 2024 & 2032
- Figure 33: Europe Instore Analytics Industry Revenue Share (%), by Country 2024 & 2032
- Figure 34: Asia Pacific Instore Analytics Industry Revenue (Million), by Component 2024 & 2032
- Figure 35: Asia Pacific Instore Analytics Industry Revenue Share (%), by Component 2024 & 2032
- Figure 36: Asia Pacific Instore Analytics Industry Revenue (Million), by Deployment 2024 & 2032
- Figure 37: Asia Pacific Instore Analytics Industry Revenue Share (%), by Deployment 2024 & 2032
- Figure 38: Asia Pacific Instore Analytics Industry Revenue (Million), by Organization Size 2024 & 2032
- Figure 39: Asia Pacific Instore Analytics Industry Revenue Share (%), by Organization Size 2024 & 2032
- Figure 40: Asia Pacific Instore Analytics Industry Revenue (Million), by Application 2024 & 2032
- Figure 41: Asia Pacific Instore Analytics Industry Revenue Share (%), by Application 2024 & 2032
- Figure 42: Asia Pacific Instore Analytics Industry Revenue (Million), by Country 2024 & 2032
- Figure 43: Asia Pacific Instore Analytics Industry Revenue Share (%), by Country 2024 & 2032
- Figure 44: Latin America Instore Analytics Industry Revenue (Million), by Component 2024 & 2032
- Figure 45: Latin America Instore Analytics Industry Revenue Share (%), by Component 2024 & 2032
- Figure 46: Latin America Instore Analytics Industry Revenue (Million), by Deployment 2024 & 2032
- Figure 47: Latin America Instore Analytics Industry Revenue Share (%), by Deployment 2024 & 2032
- Figure 48: Latin America Instore Analytics Industry Revenue (Million), by Organization Size 2024 & 2032
- Figure 49: Latin America Instore Analytics Industry Revenue Share (%), by Organization Size 2024 & 2032
- Figure 50: Latin America Instore Analytics Industry Revenue (Million), by Application 2024 & 2032
- Figure 51: Latin America Instore Analytics Industry Revenue Share (%), by Application 2024 & 2032
- Figure 52: Latin America Instore Analytics Industry Revenue (Million), by Country 2024 & 2032
- Figure 53: Latin America Instore Analytics Industry Revenue Share (%), by Country 2024 & 2032
- Figure 54: Middle East and Africa Instore Analytics Industry Revenue (Million), by Component 2024 & 2032
- Figure 55: Middle East and Africa Instore Analytics Industry Revenue Share (%), by Component 2024 & 2032
- Figure 56: Middle East and Africa Instore Analytics Industry Revenue (Million), by Deployment 2024 & 2032
- Figure 57: Middle East and Africa Instore Analytics Industry Revenue Share (%), by Deployment 2024 & 2032
- Figure 58: Middle East and Africa Instore Analytics Industry Revenue (Million), by Organization Size 2024 & 2032
- Figure 59: Middle East and Africa Instore Analytics Industry Revenue Share (%), by Organization Size 2024 & 2032
- Figure 60: Middle East and Africa Instore Analytics Industry Revenue (Million), by Application 2024 & 2032
- Figure 61: Middle East and Africa Instore Analytics Industry Revenue Share (%), by Application 2024 & 2032
- Figure 62: Middle East and Africa Instore Analytics Industry Revenue (Million), by Country 2024 & 2032
- Figure 63: Middle East and Africa Instore Analytics Industry Revenue Share (%), by Country 2024 & 2032
List of Tables
- Table 1: Global Instore Analytics Industry Revenue Million Forecast, by Region 2019 & 2032
- Table 2: Global Instore Analytics Industry Revenue Million Forecast, by Component 2019 & 2032
- Table 3: Global Instore Analytics Industry Revenue Million Forecast, by Deployment 2019 & 2032
- Table 4: Global Instore Analytics Industry Revenue Million Forecast, by Organization Size 2019 & 2032
- Table 5: Global Instore Analytics Industry Revenue Million Forecast, by Application 2019 & 2032
- Table 6: Global Instore Analytics Industry Revenue Million Forecast, by Region 2019 & 2032
- Table 7: Global Instore Analytics Industry Revenue Million Forecast, by Country 2019 & 2032
- Table 8: United States Instore Analytics Industry Revenue (Million) Forecast, by Application 2019 & 2032
- Table 9: Canada Instore Analytics Industry Revenue (Million) Forecast, by Application 2019 & 2032
- Table 10: Mexico Instore Analytics Industry Revenue (Million) Forecast, by Application 2019 & 2032
- Table 11: Global Instore Analytics Industry Revenue Million Forecast, by Country 2019 & 2032
- Table 12: Germany Instore Analytics Industry Revenue (Million) Forecast, by Application 2019 & 2032
- Table 13: United Kingdom Instore Analytics Industry Revenue (Million) Forecast, by Application 2019 & 2032
- Table 14: France Instore Analytics Industry Revenue (Million) Forecast, by Application 2019 & 2032
- Table 15: Spain Instore Analytics Industry Revenue (Million) Forecast, by Application 2019 & 2032
- Table 16: Italy Instore Analytics Industry Revenue (Million) Forecast, by Application 2019 & 2032
- Table 17: Spain Instore Analytics Industry Revenue (Million) Forecast, by Application 2019 & 2032
- Table 18: Belgium Instore Analytics Industry Revenue (Million) Forecast, by Application 2019 & 2032
- Table 19: Netherland Instore Analytics Industry Revenue (Million) Forecast, by Application 2019 & 2032
- Table 20: Nordics Instore Analytics Industry Revenue (Million) Forecast, by Application 2019 & 2032
- Table 21: Rest of Europe Instore Analytics Industry Revenue (Million) Forecast, by Application 2019 & 2032
- Table 22: Global Instore Analytics Industry Revenue Million Forecast, by Country 2019 & 2032
- Table 23: China Instore Analytics Industry Revenue (Million) Forecast, by Application 2019 & 2032
- Table 24: Japan Instore Analytics Industry Revenue (Million) Forecast, by Application 2019 & 2032
- Table 25: India Instore Analytics Industry Revenue (Million) Forecast, by Application 2019 & 2032
- Table 26: South Korea Instore Analytics Industry Revenue (Million) Forecast, by Application 2019 & 2032
- Table 27: Southeast Asia Instore Analytics Industry Revenue (Million) Forecast, by Application 2019 & 2032
- Table 28: Australia Instore Analytics Industry Revenue (Million) Forecast, by Application 2019 & 2032
- Table 29: Indonesia Instore Analytics Industry Revenue (Million) Forecast, by Application 2019 & 2032
- Table 30: Phillipes Instore Analytics Industry Revenue (Million) Forecast, by Application 2019 & 2032
- Table 31: Singapore Instore Analytics Industry Revenue (Million) Forecast, by Application 2019 & 2032
- Table 32: Thailandc Instore Analytics Industry Revenue (Million) Forecast, by Application 2019 & 2032
- Table 33: Rest of Asia Pacific Instore Analytics Industry Revenue (Million) Forecast, by Application 2019 & 2032
- Table 34: Global Instore Analytics Industry Revenue Million Forecast, by Country 2019 & 2032
- Table 35: Brazil Instore Analytics Industry Revenue (Million) Forecast, by Application 2019 & 2032
- Table 36: Argentina Instore Analytics Industry Revenue (Million) Forecast, by Application 2019 & 2032
- Table 37: Peru Instore Analytics Industry Revenue (Million) Forecast, by Application 2019 & 2032
- Table 38: Chile Instore Analytics Industry Revenue (Million) Forecast, by Application 2019 & 2032
- Table 39: Colombia Instore Analytics Industry Revenue (Million) Forecast, by Application 2019 & 2032
- Table 40: Ecuador Instore Analytics Industry Revenue (Million) Forecast, by Application 2019 & 2032
- Table 41: Venezuela Instore Analytics Industry Revenue (Million) Forecast, by Application 2019 & 2032
- Table 42: Rest of South America Instore Analytics Industry Revenue (Million) Forecast, by Application 2019 & 2032
- Table 43: Global Instore Analytics Industry Revenue Million Forecast, by Country 2019 & 2032
- Table 44: United States Instore Analytics Industry Revenue (Million) Forecast, by Application 2019 & 2032
- Table 45: Canada Instore Analytics Industry Revenue (Million) Forecast, by Application 2019 & 2032
- Table 46: Mexico Instore Analytics Industry Revenue (Million) Forecast, by Application 2019 & 2032
- Table 47: Global Instore Analytics Industry Revenue Million Forecast, by Country 2019 & 2032
- Table 48: United Arab Emirates Instore Analytics Industry Revenue (Million) Forecast, by Application 2019 & 2032
- Table 49: Saudi Arabia Instore Analytics Industry Revenue (Million) Forecast, by Application 2019 & 2032
- Table 50: South Africa Instore Analytics Industry Revenue (Million) Forecast, by Application 2019 & 2032
- Table 51: Rest of Middle East and Africa Instore Analytics Industry Revenue (Million) Forecast, by Application 2019 & 2032
- Table 52: Global Instore Analytics Industry Revenue Million Forecast, by Component 2019 & 2032
- Table 53: Global Instore Analytics Industry Revenue Million Forecast, by Deployment 2019 & 2032
- Table 54: Global Instore Analytics Industry Revenue Million Forecast, by Organization Size 2019 & 2032
- Table 55: Global Instore Analytics Industry Revenue Million Forecast, by Application 2019 & 2032
- Table 56: Global Instore Analytics Industry Revenue Million Forecast, by Country 2019 & 2032
- Table 57: Global Instore Analytics Industry Revenue Million Forecast, by Component 2019 & 2032
- Table 58: Global Instore Analytics Industry Revenue Million Forecast, by Deployment 2019 & 2032
- Table 59: Global Instore Analytics Industry Revenue Million Forecast, by Organization Size 2019 & 2032
- Table 60: Global Instore Analytics Industry Revenue Million Forecast, by Application 2019 & 2032
- Table 61: Global Instore Analytics Industry Revenue Million Forecast, by Country 2019 & 2032
- Table 62: Global Instore Analytics Industry Revenue Million Forecast, by Component 2019 & 2032
- Table 63: Global Instore Analytics Industry Revenue Million Forecast, by Deployment 2019 & 2032
- Table 64: Global Instore Analytics Industry Revenue Million Forecast, by Organization Size 2019 & 2032
- Table 65: Global Instore Analytics Industry Revenue Million Forecast, by Application 2019 & 2032
- Table 66: Global Instore Analytics Industry Revenue Million Forecast, by Country 2019 & 2032
- Table 67: Global Instore Analytics Industry Revenue Million Forecast, by Component 2019 & 2032
- Table 68: Global Instore Analytics Industry Revenue Million Forecast, by Deployment 2019 & 2032
- Table 69: Global Instore Analytics Industry Revenue Million Forecast, by Organization Size 2019 & 2032
- Table 70: Global Instore Analytics Industry Revenue Million Forecast, by Application 2019 & 2032
- Table 71: Global Instore Analytics Industry Revenue Million Forecast, by Country 2019 & 2032
- Table 72: Global Instore Analytics Industry Revenue Million Forecast, by Component 2019 & 2032
- Table 73: Global Instore Analytics Industry Revenue Million Forecast, by Deployment 2019 & 2032
- Table 74: Global Instore Analytics Industry Revenue Million Forecast, by Organization Size 2019 & 2032
- Table 75: Global Instore Analytics Industry Revenue Million Forecast, by Application 2019 & 2032
- Table 76: Global Instore Analytics Industry Revenue Million Forecast, by Country 2019 & 2032
Frequently Asked Questions
1. What is the projected Compound Annual Growth Rate (CAGR) of the Instore Analytics Industry?
The projected CAGR is approximately 24.23%.
2. Which companies are prominent players in the Instore Analytics Industry?
Key companies in the market include Hoxton Analytics Limited, Amoobi Inc, SAP SE, Capgemini SE, Happiest Minds Technologies, Cloud4Wi Inc, Motionloft Inc, Capillary Technologies, Thinkinside SRL, RetailNext Inc, Trax Image Recognition.
3. What are the main segments of the Instore Analytics Industry?
The market segments include Component, Deployment, Organization Size, Application.
4. Can you provide details about the market size?
The market size is estimated to be USD 4.26 Million as of 2022.
5. What are some drivers contributing to market growth?
Increasing advantage of the Cloud; Need for Better Customer Service and Enhanced Shopping Experience; Customer Management Segment to Witness Significant Market Growth.
6. What are the notable trends driving market growth?
Customer Management Segment to Witness Significant Market Growth.
7. Are there any restraints impacting market growth?
Lack of Personnel Skills.
8. Can you provide examples of recent developments in the market?
December 2022 - JRNI, a leading customer engagement platform, partnered with Mad Mobiles, a Retail associate platform for managing online and in-store customer shopping experiences. This integration would provide clients with a complete solution to replicate an in-person, in-store shopping experience from anywhere.
9. What pricing options are available for accessing the report?
Pricing options include single-user, multi-user, and enterprise licenses priced at USD 4750, USD 5250, and USD 8750 respectively.
10. Is the market size provided in terms of value or volume?
The market size is provided in terms of value, measured in Million.
11. Are there any specific market keywords associated with the report?
Yes, the market keyword associated with the report is "Instore Analytics Industry," which aids in identifying and referencing the specific market segment covered.
12. How do I determine which pricing option suits my needs best?
The pricing options vary based on user requirements and access needs. Individual users may opt for single-user licenses, while businesses requiring broader access may choose multi-user or enterprise licenses for cost-effective access to the report.
13. Are there any additional resources or data provided in the Instore Analytics Industry report?
While the report offers comprehensive insights, it's advisable to review the specific contents or supplementary materials provided to ascertain if additional resources or data are available.
14. How can I stay updated on further developments or reports in the Instore Analytics Industry?
To stay informed about further developments, trends, and reports in the Instore Analytics Industry, consider subscribing to industry newsletters, following relevant companies and organizations, or regularly checking reputable industry news sources and publications.
Methodology
Step 1 - Identification of Relevant Samples Size from Population Database


Step 2 - Approaches for Defining Global Market Size (Value, Volume* & Price*)

Note*: In applicable scenarios
Step 3 - Data Sources
Primary Research
- Web Analytics
- Survey Reports
- Research Institute
- Latest Research Reports
- Opinion Leaders
Secondary Research
- Annual Reports
- White Paper
- Latest Press Release
- Industry Association
- Paid Database
- Investor Presentations

Step 4 - Data Triangulation
Involves using different sources of information in order to increase the validity of a study
These sources are likely to be stakeholders in a program - participants, other researchers, program staff, other community members, and so on.
Then we put all data in single framework & apply various statistical tools to find out the dynamic on the market.
During the analysis stage, feedback from the stakeholder groups would be compared to determine areas of agreement as well as areas of divergence


