
Key Insights
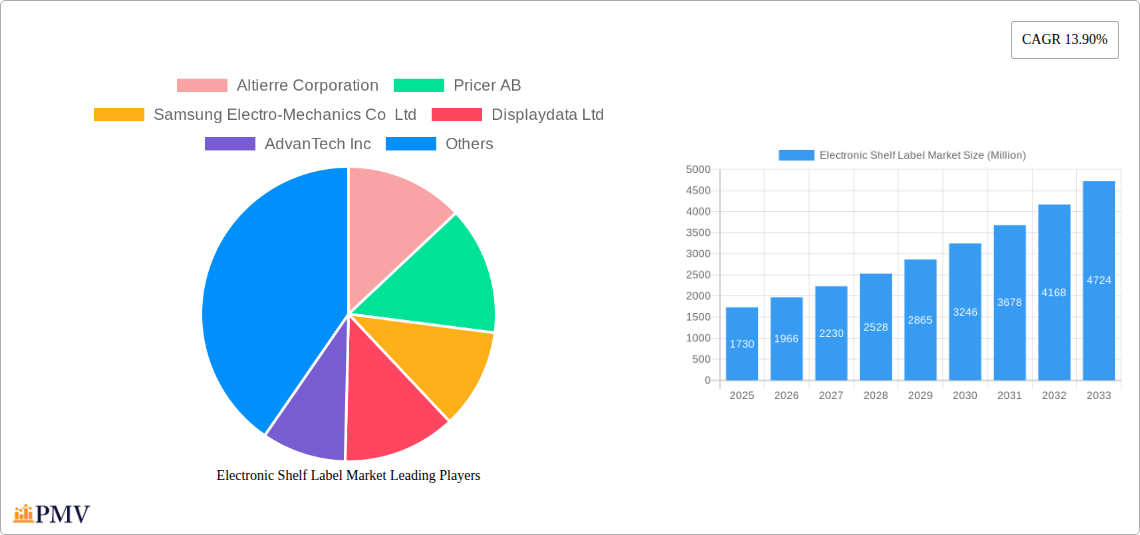
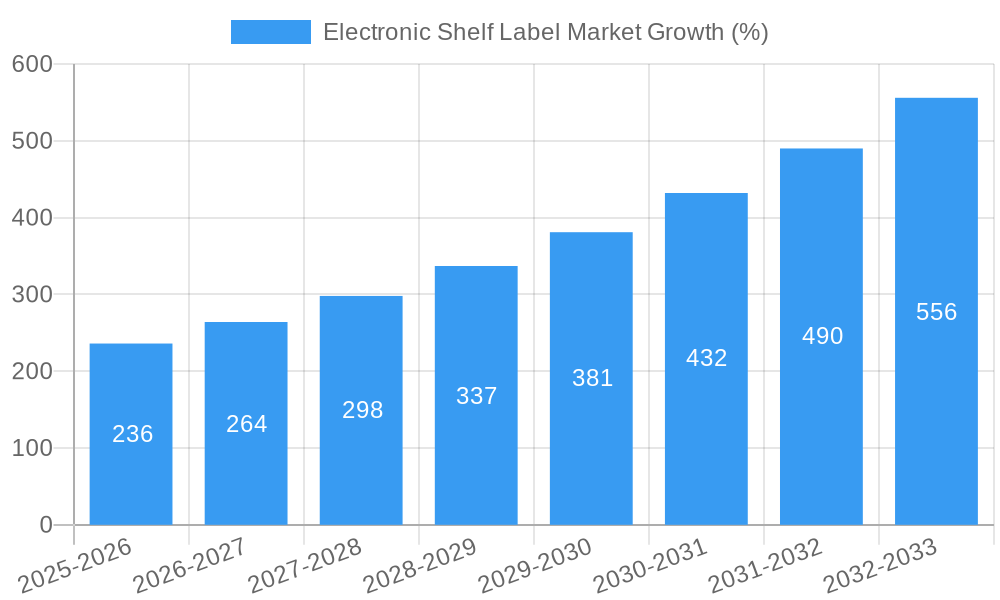
The Electronic Shelf Label (ESL) market is experiencing robust growth, projected to reach a value of $1.73 billion in 2025 and maintain a Compound Annual Growth Rate (CAGR) of 13.90% from 2025 to 2033. This expansion is driven by several key factors. The increasing adoption of digitalization within the retail sector, particularly in hypermarkets and supermarkets, is a primary driver. Retailers are leveraging ESLs to improve operational efficiency, reduce labor costs associated with manual price updates, and enhance the overall shopping experience through dynamic pricing strategies and targeted promotions. Furthermore, the growing consumer demand for real-time pricing information and improved in-store navigation contributes significantly to market growth. Technological advancements in ESL technology, such as the development of more energy-efficient E-paper ESLs and the integration of advanced features like interactive displays and inventory management capabilities, are further fueling this expansion. While the initial investment in ESL infrastructure can be a restraint for some smaller retailers, the long-term cost savings and enhanced operational efficiency are proving to be compelling arguments for adoption across various retail segments, including specialty stores and non-food retail. Competition amongst established players like Pricer AB, Samsung Electro-Mechanics, and SES-imagotag, along with the emergence of new entrants, is driving innovation and fostering a dynamic market landscape.
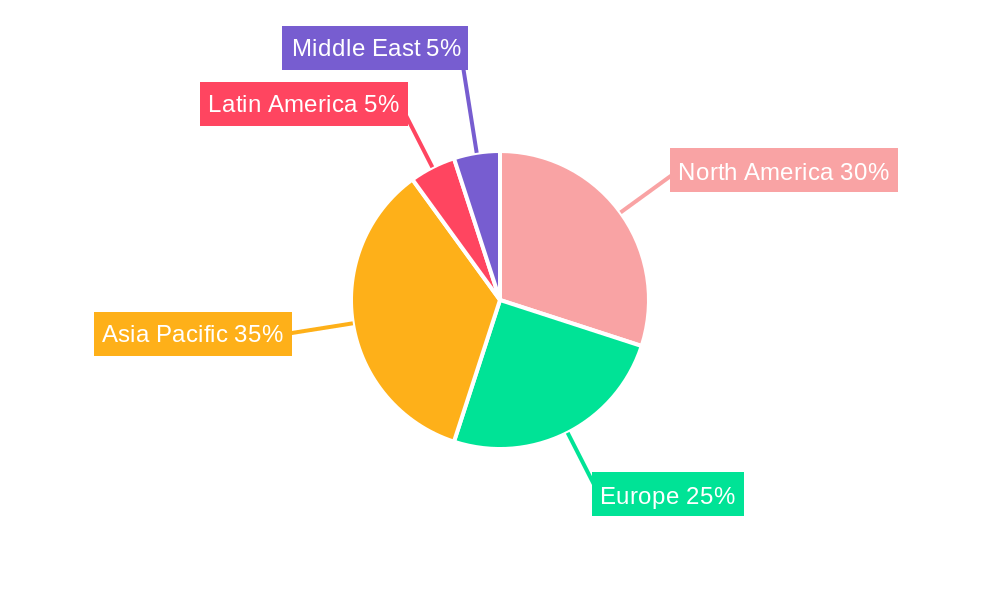
The geographical distribution of the ESL market is expected to reflect global retail trends, with Asia Pacific anticipated to lead in market share due to its large and rapidly evolving retail sector. North America and Europe are also expected to contribute significantly to market growth, driven by increasing technological adoption and a focus on optimizing retail operations. The market segmentation by product type shows a significant preference for LCD ESLs currently, owing to their established technology and wider availability. However, the growing popularity of E-paper ESLs, due to their superior energy efficiency and readability, suggests a shift in market share towards this segment in the coming years. This competitive landscape and technological evolution indicate that the ESL market will continue its trajectory of strong growth throughout the forecast period, offering lucrative opportunities for both established players and new market entrants.
Electronic Shelf Label Market: A Comprehensive Market Report (2019-2033)
This in-depth report provides a comprehensive analysis of the Electronic Shelf Label (ESL) market, offering invaluable insights for stakeholders across the retail technology landscape. Covering the period from 2019 to 2033, with a focus on 2025, this report meticulously examines market dynamics, competitive landscapes, technological advancements, and future growth prospects. The study period (2019-2024) and forecast period (2025-2033) provide a holistic view of the market's historical performance and future trajectory.
Electronic Shelf Label Market Market Structure & Competitive Dynamics
The Electronic Shelf Label market is characterized by a moderately concentrated structure with several key players vying for market share. The market exhibits a dynamic innovation ecosystem, driven by ongoing advancements in display technologies (LCD and E-paper ESLs) and connectivity solutions. Regulatory frameworks, particularly those related to data privacy and security in retail environments, significantly impact market dynamics. Product substitutes, such as traditional paper labels, pose a competitive threat, although their limitations in terms of real-time updates and dynamic pricing are gradually diminishing their appeal. End-user trends, such as the growing adoption of omnichannel strategies and the demand for enhanced customer experiences, are key growth drivers. M&A activities are infrequent but significant, reflecting consolidation efforts within the industry. For example, the xx Million deal value of a recent acquisition indicates the significant capital investment in this sector. The market share held by top 5 players in 2024 is estimated to be xx%.
- Market Concentration: Moderately concentrated, with key players holding significant market share.
- Innovation Ecosystem: Dynamic, fueled by advancements in display technology and connectivity.
- Regulatory Frameworks: Influence data privacy and security compliance.
- Product Substitutes: Traditional paper labels pose a decreasingly significant competitive threat.
- End-User Trends: Omnichannel strategies and enhanced customer experience drive growth.
- M&A Activities: Infrequent but impactful, reflecting industry consolidation.
Electronic Shelf Label Market Industry Trends & Insights
The global Electronic Shelf Label market is experiencing robust growth, projected to achieve a Compound Annual Growth Rate (CAGR) of xx% during the forecast period (2025-2033). This growth is primarily driven by several key factors: the increasing adoption of digital signage and automation within retail environments, the growing preference for dynamic pricing strategies that enable retailers to react rapidly to market fluctuations and optimize profitability, and the enhanced shopping experience that ESLs provide for consumers via improved product information accessibility. The market penetration of ESLs in the retail sector is gradually increasing, with significant adoption in hypermarkets and supermarkets. The rise of IoT and cloud-based solutions is further accelerating ESL market expansion, enabling real-time data analytics and enhanced supply chain management. Technological disruptions, such as the development of more energy-efficient and durable display technologies, are constantly shaping the competitive landscape. Consumer preferences towards seamless in-store experiences are boosting the demand for advanced ESL features, further fueling market growth.
Dominant Markets & Segments in Electronic Shelf Label Market
The Electronic Shelf Label market shows strong dominance in North America and Europe, driven by high retail technology adoption and robust economic conditions. Within product segments, E-paper ESLs hold a larger market share compared to LCD ESLs, owing to their lower power consumption and longer lifespan. In terms of store types, hypermarkets and supermarkets constitute the largest segment, given their significant scale and need for efficient inventory management.
- Leading Region: North America & Europe
- Dominant Product Segment: E-paper ESLs (due to longer lifespan and lower power consumption)
- Largest Store Type Segment: Hypermarkets and Supermarkets (due to scale and inventory management needs)
Key Drivers for Dominant Segments:
- North America & Europe: High retail technology adoption, strong economic conditions, and early adoption of innovative technologies.
- E-paper ESLs: Lower power consumption, longer lifespan, and suitability for diverse retail environments.
- Hypermarkets & Supermarkets: Large-scale operations, need for efficient inventory management, and enhanced customer experience.
Electronic Shelf Label Market Product Innovations
Recent innovations in the ESL market focus on enhanced connectivity, improved display technologies, and integration with retail analytics platforms. The introduction of low-power, long-range wireless communication protocols and cloud-based software solutions allows for real-time data synchronization and remote management capabilities. New display technologies, such as flexible and transparent ESLs, are expanding design options and enhancing the aesthetics of retail environments. These innovations offer competitive advantages through improved operational efficiency, dynamic pricing capabilities, and enhanced customer engagement.
Report Segmentation & Scope
This report segments the Electronic Shelf Label market based on product type (LCD ESLs and E-paper ESLs) and store type (Hypermarkets, Supermarkets, Specialty Stores, and Non-food Retail Stores). Each segment is analyzed in detail, providing insights into market size, growth projections, and competitive dynamics. For example, the E-paper ESL segment is projected to register substantial growth over the forecast period due to the inherent advantages of this technology. Similarly, the Hypermarkets and Supermarkets segment is expected to dominate the market given the scale of these retailers.
Key Drivers of Electronic Shelf Label Market Growth
Several factors are driving the growth of the Electronic Shelf Label market. These include the increasing demand for real-time pricing updates and inventory management, the need for improved in-store customer experiences through enhanced product information, and the growing adoption of digital transformation strategies within the retail sector. Technological advancements in display technologies and wireless communication are further contributing to market expansion. Government regulations promoting digitalization in the retail sector also play a vital role.
Challenges in the Electronic Shelf Label Market Sector
The ESL market faces challenges such as high initial investment costs, concerns regarding data security and privacy, and the need for robust infrastructure to support large-scale deployments. Furthermore, competition from traditional labeling methods and the potential for technological obsolescence pose ongoing threats. Supply chain disruptions and the impact of macroeconomic fluctuations also influence market growth. These factors collectively pose barriers to wider ESL adoption, despite strong growth potential.
Leading Players in the Electronic Shelf Label Market Market
- Altierre Corporation
- Pricer AB (Pricer AB)
- Samsung Electro-Mechanics Co Ltd (Samsung)
- Displaydata Ltd (Displaydata)
- AdvanTech Inc (Advantech)
- M2 Communication Inc
- SES-imagotag (SES-imagotag)
- E ink Holdings Inc (E Ink)
- Wincor Nixdorf AG
- Diebold Nixdorf (Diebold Nixdorf)
- Panasonic Corporation (Panasonic)
- LG Corporation (LG)
Key Developments in Electronic Shelf Label Market Sector
- September 2022: SES-imagotag launched VUSION OS (V:OS), a Retail IoT operating system, enabling real-time data insights for retailers.
- May 2022: SOLUM launched Newton TOUCH, a complete LCD signage solution, enhancing marketing and customer engagement.
Strategic Electronic Shelf Label Market Market Outlook
The Electronic Shelf Label market exhibits significant growth potential, driven by ongoing technological advancements, the rising adoption of digital transformation strategies in retail, and the increasing demand for enhanced customer experiences. Strategic opportunities lie in developing innovative ESL solutions with improved connectivity, energy efficiency, and integration with advanced retail analytics platforms. Focusing on customized solutions to meet the specific needs of different retail segments and expanding into emerging markets will be crucial for capturing future growth opportunities.
Electronic Shelf Label Market Segmentation
-
1. Product
- 1.1. LCD ESLs
- 1.2. E-paper ESLs
-
2. Store Type
- 2.1. Hyper Markets
- 2.2. Super Markets
- 2.3. Specialty Stores and Non-food Retail Stores
Electronic Shelf Label Market Segmentation By Geography
- 1. North America
- 2. Europe
- 3. Asia Pacific
- 4. Latin America
- 5. Middle East and Africa
Electronic Shelf Label Market REPORT HIGHLIGHTS
| Aspects | Details |
|---|---|
| Study Period | 2019-2033 |
| Base Year | 2024 |
| Estimated Year | 2025 |
| Forecast Period | 2025-2033 |
| Historical Period | 2019-2024 |
| Growth Rate | CAGR of 13.90% from 2019-2033 |
| Segmentation |
|
Table of Contents
- 1. Introduction
- 1.1. Research Scope
- 1.2. Market Segmentation
- 1.3. Research Methodology
- 1.4. Definitions and Assumptions
- 2. Executive Summary
- 2.1. Introduction
- 3. Market Dynamics
- 3.1. Introduction
- 3.2. Market Drivers
- 3.2.1. NFC penetration in POS and Smartphones
- 3.3. Market Restrains
- 3.3.1. High Initial Investments
- 3.4. Market Trends
- 3.4.1. NFC Mobile Payment is expected to boost market growth
- 4. Market Factor Analysis
- 4.1. Porters Five Forces
- 4.2. Supply/Value Chain
- 4.3. PESTEL analysis
- 4.4. Market Entropy
- 4.5. Patent/Trademark Analysis
- 5. Global Electronic Shelf Label Market Analysis, Insights and Forecast, 2019-2031
- 5.1. Market Analysis, Insights and Forecast - by Product
- 5.1.1. LCD ESLs
- 5.1.2. E-paper ESLs
- 5.2. Market Analysis, Insights and Forecast - by Store Type
- 5.2.1. Hyper Markets
- 5.2.2. Super Markets
- 5.2.3. Specialty Stores and Non-food Retail Stores
- 5.3. Market Analysis, Insights and Forecast - by Region
- 5.3.1. North America
- 5.3.2. Europe
- 5.3.3. Asia Pacific
- 5.3.4. Latin America
- 5.3.5. Middle East and Africa
- 5.1. Market Analysis, Insights and Forecast - by Product
- 6. North America Electronic Shelf Label Market Analysis, Insights and Forecast, 2019-2031
- 6.1. Market Analysis, Insights and Forecast - by Product
- 6.1.1. LCD ESLs
- 6.1.2. E-paper ESLs
- 6.2. Market Analysis, Insights and Forecast - by Store Type
- 6.2.1. Hyper Markets
- 6.2.2. Super Markets
- 6.2.3. Specialty Stores and Non-food Retail Stores
- 6.1. Market Analysis, Insights and Forecast - by Product
- 7. Europe Electronic Shelf Label Market Analysis, Insights and Forecast, 2019-2031
- 7.1. Market Analysis, Insights and Forecast - by Product
- 7.1.1. LCD ESLs
- 7.1.2. E-paper ESLs
- 7.2. Market Analysis, Insights and Forecast - by Store Type
- 7.2.1. Hyper Markets
- 7.2.2. Super Markets
- 7.2.3. Specialty Stores and Non-food Retail Stores
- 7.1. Market Analysis, Insights and Forecast - by Product
- 8. Asia Pacific Electronic Shelf Label Market Analysis, Insights and Forecast, 2019-2031
- 8.1. Market Analysis, Insights and Forecast - by Product
- 8.1.1. LCD ESLs
- 8.1.2. E-paper ESLs
- 8.2. Market Analysis, Insights and Forecast - by Store Type
- 8.2.1. Hyper Markets
- 8.2.2. Super Markets
- 8.2.3. Specialty Stores and Non-food Retail Stores
- 8.1. Market Analysis, Insights and Forecast - by Product
- 9. Latin America Electronic Shelf Label Market Analysis, Insights and Forecast, 2019-2031
- 9.1. Market Analysis, Insights and Forecast - by Product
- 9.1.1. LCD ESLs
- 9.1.2. E-paper ESLs
- 9.2. Market Analysis, Insights and Forecast - by Store Type
- 9.2.1. Hyper Markets
- 9.2.2. Super Markets
- 9.2.3. Specialty Stores and Non-food Retail Stores
- 9.1. Market Analysis, Insights and Forecast - by Product
- 10. Middle East and Africa Electronic Shelf Label Market Analysis, Insights and Forecast, 2019-2031
- 10.1. Market Analysis, Insights and Forecast - by Product
- 10.1.1. LCD ESLs
- 10.1.2. E-paper ESLs
- 10.2. Market Analysis, Insights and Forecast - by Store Type
- 10.2.1. Hyper Markets
- 10.2.2. Super Markets
- 10.2.3. Specialty Stores and Non-food Retail Stores
- 10.1. Market Analysis, Insights and Forecast - by Product
- 11. North America Electronic Shelf Label Market Analysis, Insights and Forecast, 2019-2031
- 11.1. Market Analysis, Insights and Forecast - By Country/Sub-region
- 11.1.1.
- 12. Europe Electronic Shelf Label Market Analysis, Insights and Forecast, 2019-2031
- 12.1. Market Analysis, Insights and Forecast - By Country/Sub-region
- 12.1.1.
- 13. Asia Pacific Electronic Shelf Label Market Analysis, Insights and Forecast, 2019-2031
- 13.1. Market Analysis, Insights and Forecast - By Country/Sub-region
- 13.1.1.
- 14. Latin America Electronic Shelf Label Market Analysis, Insights and Forecast, 2019-2031
- 14.1. Market Analysis, Insights and Forecast - By Country/Sub-region
- 14.1.1.
- 15. Middle East Electronic Shelf Label Market Analysis, Insights and Forecast, 2019-2031
- 15.1. Market Analysis, Insights and Forecast - By Country/Sub-region
- 15.1.1.
- 16. Competitive Analysis
- 16.1. Global Market Share Analysis 2024
- 16.2. Company Profiles
- 16.2.1 Altierre Corporation
- 16.2.1.1. Overview
- 16.2.1.2. Products
- 16.2.1.3. SWOT Analysis
- 16.2.1.4. Recent Developments
- 16.2.1.5. Financials (Based on Availability)
- 16.2.2 Pricer AB
- 16.2.2.1. Overview
- 16.2.2.2. Products
- 16.2.2.3. SWOT Analysis
- 16.2.2.4. Recent Developments
- 16.2.2.5. Financials (Based on Availability)
- 16.2.3 Samsung Electro-Mechanics Co Ltd
- 16.2.3.1. Overview
- 16.2.3.2. Products
- 16.2.3.3. SWOT Analysis
- 16.2.3.4. Recent Developments
- 16.2.3.5. Financials (Based on Availability)
- 16.2.4 Displaydata Ltd
- 16.2.4.1. Overview
- 16.2.4.2. Products
- 16.2.4.3. SWOT Analysis
- 16.2.4.4. Recent Developments
- 16.2.4.5. Financials (Based on Availability)
- 16.2.5 AdvanTech Inc
- 16.2.5.1. Overview
- 16.2.5.2. Products
- 16.2.5.3. SWOT Analysis
- 16.2.5.4. Recent Developments
- 16.2.5.5. Financials (Based on Availability)
- 16.2.6 M2 Communication Inc
- 16.2.6.1. Overview
- 16.2.6.2. Products
- 16.2.6.3. SWOT Analysis
- 16.2.6.4. Recent Developments
- 16.2.6.5. Financials (Based on Availability)
- 16.2.7 SES-imagotag
- 16.2.7.1. Overview
- 16.2.7.2. Products
- 16.2.7.3. SWOT Analysis
- 16.2.7.4. Recent Developments
- 16.2.7.5. Financials (Based on Availability)
- 16.2.8 E ink Holdings Inc
- 16.2.8.1. Overview
- 16.2.8.2. Products
- 16.2.8.3. SWOT Analysis
- 16.2.8.4. Recent Developments
- 16.2.8.5. Financials (Based on Availability)
- 16.2.9 Wincor Nixdorf AG
- 16.2.9.1. Overview
- 16.2.9.2. Products
- 16.2.9.3. SWOT Analysis
- 16.2.9.4. Recent Developments
- 16.2.9.5. Financials (Based on Availability)
- 16.2.10 Diebold Nixdorf
- 16.2.10.1. Overview
- 16.2.10.2. Products
- 16.2.10.3. SWOT Analysis
- 16.2.10.4. Recent Developments
- 16.2.10.5. Financials (Based on Availability)
- 16.2.11 Panasonic Corporation
- 16.2.11.1. Overview
- 16.2.11.2. Products
- 16.2.11.3. SWOT Analysis
- 16.2.11.4. Recent Developments
- 16.2.11.5. Financials (Based on Availability)
- 16.2.12 LG Corporation
- 16.2.12.1. Overview
- 16.2.12.2. Products
- 16.2.12.3. SWOT Analysis
- 16.2.12.4. Recent Developments
- 16.2.12.5. Financials (Based on Availability)
- 16.2.1 Altierre Corporation
List of Figures
- Figure 1: Global Electronic Shelf Label Market Revenue Breakdown (Million, %) by Region 2024 & 2032
- Figure 2: North America Electronic Shelf Label Market Revenue (Million), by Country 2024 & 2032
- Figure 3: North America Electronic Shelf Label Market Revenue Share (%), by Country 2024 & 2032
- Figure 4: Europe Electronic Shelf Label Market Revenue (Million), by Country 2024 & 2032
- Figure 5: Europe Electronic Shelf Label Market Revenue Share (%), by Country 2024 & 2032
- Figure 6: Asia Pacific Electronic Shelf Label Market Revenue (Million), by Country 2024 & 2032
- Figure 7: Asia Pacific Electronic Shelf Label Market Revenue Share (%), by Country 2024 & 2032
- Figure 8: Latin America Electronic Shelf Label Market Revenue (Million), by Country 2024 & 2032
- Figure 9: Latin America Electronic Shelf Label Market Revenue Share (%), by Country 2024 & 2032
- Figure 10: Middle East Electronic Shelf Label Market Revenue (Million), by Country 2024 & 2032
- Figure 11: Middle East Electronic Shelf Label Market Revenue Share (%), by Country 2024 & 2032
- Figure 12: North America Electronic Shelf Label Market Revenue (Million), by Product 2024 & 2032
- Figure 13: North America Electronic Shelf Label Market Revenue Share (%), by Product 2024 & 2032
- Figure 14: North America Electronic Shelf Label Market Revenue (Million), by Store Type 2024 & 2032
- Figure 15: North America Electronic Shelf Label Market Revenue Share (%), by Store Type 2024 & 2032
- Figure 16: North America Electronic Shelf Label Market Revenue (Million), by Country 2024 & 2032
- Figure 17: North America Electronic Shelf Label Market Revenue Share (%), by Country 2024 & 2032
- Figure 18: Europe Electronic Shelf Label Market Revenue (Million), by Product 2024 & 2032
- Figure 19: Europe Electronic Shelf Label Market Revenue Share (%), by Product 2024 & 2032
- Figure 20: Europe Electronic Shelf Label Market Revenue (Million), by Store Type 2024 & 2032
- Figure 21: Europe Electronic Shelf Label Market Revenue Share (%), by Store Type 2024 & 2032
- Figure 22: Europe Electronic Shelf Label Market Revenue (Million), by Country 2024 & 2032
- Figure 23: Europe Electronic Shelf Label Market Revenue Share (%), by Country 2024 & 2032
- Figure 24: Asia Pacific Electronic Shelf Label Market Revenue (Million), by Product 2024 & 2032
- Figure 25: Asia Pacific Electronic Shelf Label Market Revenue Share (%), by Product 2024 & 2032
- Figure 26: Asia Pacific Electronic Shelf Label Market Revenue (Million), by Store Type 2024 & 2032
- Figure 27: Asia Pacific Electronic Shelf Label Market Revenue Share (%), by Store Type 2024 & 2032
- Figure 28: Asia Pacific Electronic Shelf Label Market Revenue (Million), by Country 2024 & 2032
- Figure 29: Asia Pacific Electronic Shelf Label Market Revenue Share (%), by Country 2024 & 2032
- Figure 30: Latin America Electronic Shelf Label Market Revenue (Million), by Product 2024 & 2032
- Figure 31: Latin America Electronic Shelf Label Market Revenue Share (%), by Product 2024 & 2032
- Figure 32: Latin America Electronic Shelf Label Market Revenue (Million), by Store Type 2024 & 2032
- Figure 33: Latin America Electronic Shelf Label Market Revenue Share (%), by Store Type 2024 & 2032
- Figure 34: Latin America Electronic Shelf Label Market Revenue (Million), by Country 2024 & 2032
- Figure 35: Latin America Electronic Shelf Label Market Revenue Share (%), by Country 2024 & 2032
- Figure 36: Middle East and Africa Electronic Shelf Label Market Revenue (Million), by Product 2024 & 2032
- Figure 37: Middle East and Africa Electronic Shelf Label Market Revenue Share (%), by Product 2024 & 2032
- Figure 38: Middle East and Africa Electronic Shelf Label Market Revenue (Million), by Store Type 2024 & 2032
- Figure 39: Middle East and Africa Electronic Shelf Label Market Revenue Share (%), by Store Type 2024 & 2032
- Figure 40: Middle East and Africa Electronic Shelf Label Market Revenue (Million), by Country 2024 & 2032
- Figure 41: Middle East and Africa Electronic Shelf Label Market Revenue Share (%), by Country 2024 & 2032
List of Tables
- Table 1: Global Electronic Shelf Label Market Revenue Million Forecast, by Region 2019 & 2032
- Table 2: Global Electronic Shelf Label Market Revenue Million Forecast, by Product 2019 & 2032
- Table 3: Global Electronic Shelf Label Market Revenue Million Forecast, by Store Type 2019 & 2032
- Table 4: Global Electronic Shelf Label Market Revenue Million Forecast, by Region 2019 & 2032
- Table 5: Global Electronic Shelf Label Market Revenue Million Forecast, by Country 2019 & 2032
- Table 6: Electronic Shelf Label Market Revenue (Million) Forecast, by Application 2019 & 2032
- Table 7: Global Electronic Shelf Label Market Revenue Million Forecast, by Country 2019 & 2032
- Table 8: Electronic Shelf Label Market Revenue (Million) Forecast, by Application 2019 & 2032
- Table 9: Global Electronic Shelf Label Market Revenue Million Forecast, by Country 2019 & 2032
- Table 10: Electronic Shelf Label Market Revenue (Million) Forecast, by Application 2019 & 2032
- Table 11: Global Electronic Shelf Label Market Revenue Million Forecast, by Country 2019 & 2032
- Table 12: Electronic Shelf Label Market Revenue (Million) Forecast, by Application 2019 & 2032
- Table 13: Global Electronic Shelf Label Market Revenue Million Forecast, by Country 2019 & 2032
- Table 14: Electronic Shelf Label Market Revenue (Million) Forecast, by Application 2019 & 2032
- Table 15: Global Electronic Shelf Label Market Revenue Million Forecast, by Product 2019 & 2032
- Table 16: Global Electronic Shelf Label Market Revenue Million Forecast, by Store Type 2019 & 2032
- Table 17: Global Electronic Shelf Label Market Revenue Million Forecast, by Country 2019 & 2032
- Table 18: Global Electronic Shelf Label Market Revenue Million Forecast, by Product 2019 & 2032
- Table 19: Global Electronic Shelf Label Market Revenue Million Forecast, by Store Type 2019 & 2032
- Table 20: Global Electronic Shelf Label Market Revenue Million Forecast, by Country 2019 & 2032
- Table 21: Global Electronic Shelf Label Market Revenue Million Forecast, by Product 2019 & 2032
- Table 22: Global Electronic Shelf Label Market Revenue Million Forecast, by Store Type 2019 & 2032
- Table 23: Global Electronic Shelf Label Market Revenue Million Forecast, by Country 2019 & 2032
- Table 24: Global Electronic Shelf Label Market Revenue Million Forecast, by Product 2019 & 2032
- Table 25: Global Electronic Shelf Label Market Revenue Million Forecast, by Store Type 2019 & 2032
- Table 26: Global Electronic Shelf Label Market Revenue Million Forecast, by Country 2019 & 2032
- Table 27: Global Electronic Shelf Label Market Revenue Million Forecast, by Product 2019 & 2032
- Table 28: Global Electronic Shelf Label Market Revenue Million Forecast, by Store Type 2019 & 2032
- Table 29: Global Electronic Shelf Label Market Revenue Million Forecast, by Country 2019 & 2032
Frequently Asked Questions
1. What is the projected Compound Annual Growth Rate (CAGR) of the Electronic Shelf Label Market?
The projected CAGR is approximately 13.90%.
2. Which companies are prominent players in the Electronic Shelf Label Market?
Key companies in the market include Altierre Corporation, Pricer AB, Samsung Electro-Mechanics Co Ltd, Displaydata Ltd, AdvanTech Inc, M2 Communication Inc, SES-imagotag, E ink Holdings Inc, Wincor Nixdorf AG, Diebold Nixdorf, Panasonic Corporation, LG Corporation.
3. What are the main segments of the Electronic Shelf Label Market?
The market segments include Product, Store Type.
4. Can you provide details about the market size?
The market size is estimated to be USD 1.73 Million as of 2022.
5. What are some drivers contributing to market growth?
NFC penetration in POS and Smartphones.
6. What are the notable trends driving market growth?
NFC Mobile Payment is expected to boost market growth.
7. Are there any restraints impacting market growth?
High Initial Investments.
8. Can you provide examples of recent developments in the market?
September 2022 - SES-imagotag, a leader in digital technologies for physical trade and electronic shelf labels, introduced VUSION OS (V:OS), a Retail IoT operating system. This allows retailers to take advantage of insights and information in real time.
9. What pricing options are available for accessing the report?
Pricing options include single-user, multi-user, and enterprise licenses priced at USD 4750, USD 5250, and USD 8750 respectively.
10. Is the market size provided in terms of value or volume?
The market size is provided in terms of value, measured in Million.
11. Are there any specific market keywords associated with the report?
Yes, the market keyword associated with the report is "Electronic Shelf Label Market," which aids in identifying and referencing the specific market segment covered.
12. How do I determine which pricing option suits my needs best?
The pricing options vary based on user requirements and access needs. Individual users may opt for single-user licenses, while businesses requiring broader access may choose multi-user or enterprise licenses for cost-effective access to the report.
13. Are there any additional resources or data provided in the Electronic Shelf Label Market report?
While the report offers comprehensive insights, it's advisable to review the specific contents or supplementary materials provided to ascertain if additional resources or data are available.
14. How can I stay updated on further developments or reports in the Electronic Shelf Label Market?
To stay informed about further developments, trends, and reports in the Electronic Shelf Label Market, consider subscribing to industry newsletters, following relevant companies and organizations, or regularly checking reputable industry news sources and publications.
Methodology
Step 1 - Identification of Relevant Samples Size from Population Database


Step 2 - Approaches for Defining Global Market Size (Value, Volume* & Price*)

Note*: In applicable scenarios
Step 3 - Data Sources
Primary Research
- Web Analytics
- Survey Reports
- Research Institute
- Latest Research Reports
- Opinion Leaders
Secondary Research
- Annual Reports
- White Paper
- Latest Press Release
- Industry Association
- Paid Database
- Investor Presentations

Step 4 - Data Triangulation
Involves using different sources of information in order to increase the validity of a study
These sources are likely to be stakeholders in a program - participants, other researchers, program staff, other community members, and so on.
Then we put all data in single framework & apply various statistical tools to find out the dynamic on the market.
During the analysis stage, feedback from the stakeholder groups would be compared to determine areas of agreement as well as areas of divergence


