
Key Insights
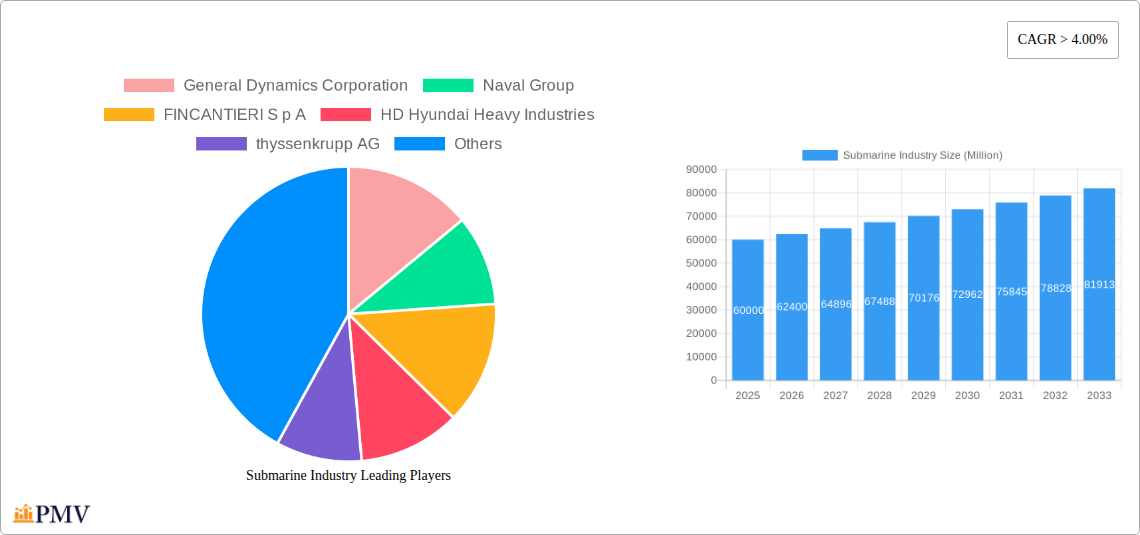
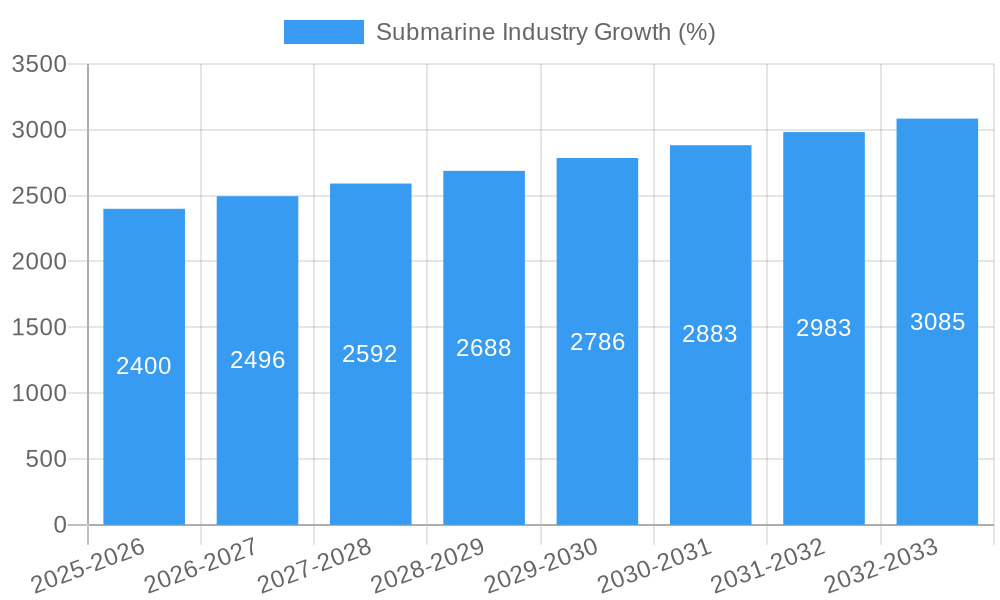
The global submarine market is experiencing robust growth, driven by increasing geopolitical tensions, the need for enhanced naval capabilities, and technological advancements in submarine design and weaponry. The market, valued at approximately $60 billion in 2025, is projected to maintain a Compound Annual Growth Rate (CAGR) exceeding 4% through 2033. This expansion is fueled by significant investments in modernization and expansion of submarine fleets by major global powers. Nuclear-powered submarines (SSNs, SSBNs, and SSGNs) constitute a significant portion of the market, commanding higher prices due to their advanced technology and longer operational ranges. However, the demand for diesel-electric submarines (SSKs) remains strong, particularly among smaller navies and for cost-effective coastal defense operations. Technological advancements, including improved sensor systems, quieter propulsion systems, and autonomous capabilities, are key drivers shaping market trends. The increasing sophistication of anti-submarine warfare (ASW) technology poses a challenge, compelling manufacturers to continuously innovate and develop countermeasures.
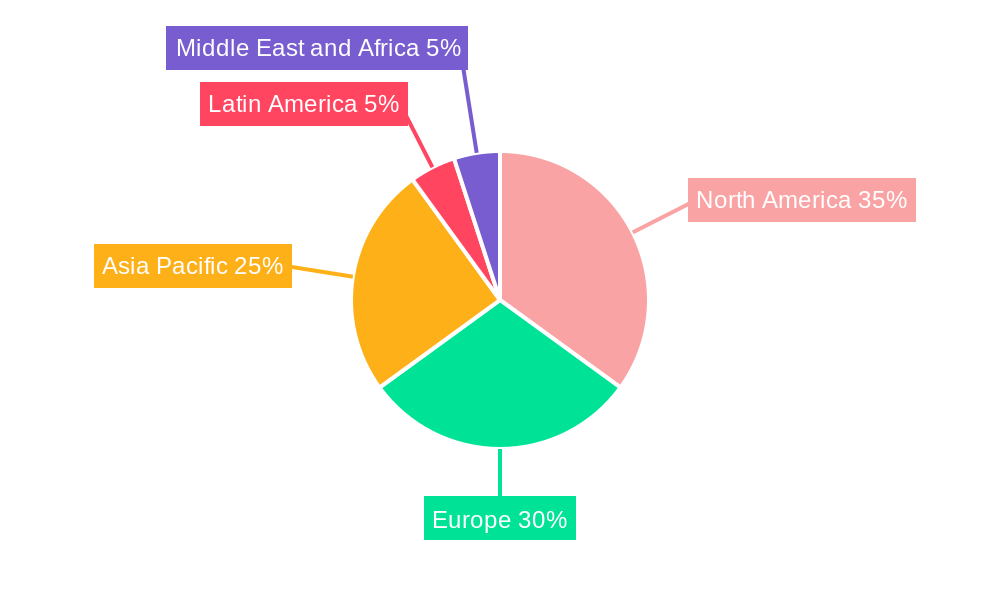
Regional market dynamics are diverse. North America and Europe currently dominate the market, driven by substantial defense budgets and established submarine manufacturing capabilities. However, the Asia-Pacific region is expected to witness significant growth in the coming years, fueled by increasing military expenditure and naval modernization initiatives from countries like China and India. Competition within the submarine industry is intense, with key players like General Dynamics, Naval Group, Fincantieri, and Huntington Ingalls Industries vying for market share. The industry's growth trajectory will be influenced by government procurement policies, technological breakthroughs, and the evolving geopolitical landscape. Continued investment in research and development, coupled with strategic partnerships and collaborations, will be critical for companies to secure their position in this highly competitive market.
Submarine Industry Market Report: 2019-2033
This comprehensive report provides a detailed analysis of the global submarine industry, covering market size, segmentation, competitive landscape, key trends, and future outlook. The study period spans from 2019 to 2033, with 2025 serving as the base and estimated year. The report projects the market's trajectory from 2025 to 2033, leveraging data from the historical period (2019-2024). The global submarine market is valued at xx Million in 2025 and is projected to reach xx Million by 2033, exhibiting a CAGR of xx% during the forecast period.
Submarine Industry Market Structure & Competitive Dynamics
The global submarine industry is characterized by a moderately concentrated market structure, with a few major players holding significant market share. These key players, including General Dynamics Corporation, Naval Group, FINCANTIERI S p A, HD Hyundai Heavy Industries, and others, compete fiercely based on technological advancements, cost-effectiveness, and delivery timelines. The industry's innovation ecosystem is robust, driven by continuous R&D efforts focusing on autonomous systems, advanced propulsion technologies, and improved stealth capabilities. Stringent regulatory frameworks govern the design, construction, and operation of submarines, especially those with nuclear capabilities, influencing market dynamics. Substitute products are limited, with the primary alternative being surface vessels, but their capabilities are significantly different. End-user trends are primarily driven by geopolitical tensions and the need to enhance naval capabilities among various nations. M&A activity has been relatively moderate in recent years, with deal values ranging from xx Million to xx Million, primarily focused on technology acquisition and expansion into new markets.
- Market Concentration: Moderately concentrated, with top 5 players holding approximately xx% of market share (2025).
- Innovation Ecosystem: Strong, driven by advancements in AI, autonomous systems, and propulsion technology.
- Regulatory Framework: Stringent, particularly for nuclear submarines, impacting manufacturing and operational costs.
- M&A Activity: Moderate, with deal values averaging xx Million (2019-2024), driven by technological acquisitions and market expansion.
Submarine Industry Industry Trends & Insights
The global submarine industry is witnessing robust growth propelled by rising geopolitical instability, the increasing need for naval modernization among various nations, and technological advancements. The market exhibits a positive growth trajectory, fueled by the demand for advanced submarines with enhanced capabilities like improved stealth technology, autonomous operations, and increased weapon payload capacity. Technological disruptions are significantly impacting the sector, leading to the development of advanced sensor systems, AI-powered navigation, and unmanned underwater vehicles (UUVs). The preference for multi-role submarines capable of performing a range of missions is driving market growth. Competitive dynamics are characterized by fierce competition among major players, with a focus on innovation, technological superiority, and cost-effectiveness. The market penetration of advanced technologies is increasing steadily, with an expected market penetration rate of xx% for AI-powered systems by 2033.
Dominant Markets & Segments in Submarine Industry
The Asia-Pacific region, particularly countries like India and China, dominates the global submarine market due to increased defense budgets and modernization programs. The nuclear-powered submarine (SSN) segment exhibits the highest growth potential, driven by the strategic advantages offered by these vessels.
Key Drivers:
- Asia-Pacific Region: High defense spending, geopolitical tensions, and naval modernization programs.
- SSN Segment: Superior range, endurance, and operational capabilities compared to diesel-electric submarines.
Dominance Analysis:
The Asia-Pacific region's strong economic growth, coupled with rising geopolitical tensions, has resulted in significant investments in naval capabilities. This has led to a surge in demand for submarines, particularly SSNs, making this region the most dominant market segment. While other regions are also experiencing growth, Asia-Pacific’s strategic location and considerable defense budgets ensure its continued dominance.
- Nuclear-Powered Submarines (SSNs): xx Million market value in 2025, projected growth of xx% CAGR.
- Ballistic Missile Submarines (SSBNs): xx Million market value in 2025, projected growth of xx% CAGR.
- Guided-Missile Nuclear Submarines (SSGNs): xx Million market value in 2025, projected growth of xx% CAGR.
- Diesel-Electric Submarines (SSKs): xx Million market value in 2025, projected growth of xx% CAGR.
Submarine Industry Product Innovations
Recent advancements focus on enhancing stealth capabilities, improving sensor technology, integrating autonomous systems, and developing quieter propulsion systems. These innovations aim to improve the operational effectiveness and survivability of submarines, providing a significant competitive advantage. The increasing adoption of AI and machine learning is enhancing situational awareness and decision-making capabilities for submarine crews. The market fit of these innovations is high, driven by the increasing demand for advanced submarine technology among various nations.
Report Segmentation & Scope
This report segments the submarine market by type: Nuclear-Powered Submarines (SSNs), Ballistic Missile Submarines (SSBNs), Guided-Missile Nuclear Submarines (SSGNs), and Diesel-Electric Submarines (SSKs). Each segment's growth projections, market sizes, and competitive dynamics are analyzed, considering regional variations and technological advancements.
- SSNs: Expected to dominate the market due to superior capabilities and strategic importance.
- SSBNs: Smaller market but crucial for national security.
- SSGNs: Growing demand driven by requirements for precision strike capabilities.
- SSKs: Cost-effective option for smaller navies and coastal defense.
Key Drivers of Submarine Industry Growth
The submarine industry's growth is fueled by several factors: increasing geopolitical tensions, leading to greater investment in defense; technological advancements, enhancing submarine capabilities and operational effectiveness; and the need for enhanced maritime security, particularly in regions with significant maritime trade routes. Government policies supporting naval modernization and the development of indigenous submarine capabilities also play a crucial role.
Challenges in the Submarine Industry Sector
The submarine industry faces several challenges: high development and manufacturing costs, complex regulatory frameworks, and long lead times for construction. Supply chain disruptions, especially those affecting critical components, can also impact project timelines and costs. Intense competition among major players puts pressure on margins. These factors can collectively impact profitability and project delivery schedules.
Leading Players in the Submarine Industry Market
- General Dynamics Corporation
- Naval Group
- FINCANTIERI S p A
- HD Hyundai Heavy Industries
- thyssenkrupp AG
- Daewoo Shipbuilding & Marine Engineering Co Ltd
- Huntington Ingalls Industries Inc
- Navantia S A SM E
- BAE Systems plc
- United Shipbuilding Corporation
- Saab AB
- Mitsubishi Heavy Industries Ltd
Key Developments in Submarine Industry Sector
- December 2022: Indian shipbuilder Mazagon Dock Limited (MDL) delivered the "Vagir," a Scorpene-type submarine, to the Indian Navy, strengthening India's naval capabilities.
- December 2022: Russia commissioned the Generalissimus Suvorov, a new ballistic missile submarine, demonstrating its commitment to naval modernization.
- December 2022: The UK Royal Navy ordered its first crewless submarine, the Cetus, highlighting the growing interest in autonomous underwater vehicles for surveillance and defense.
Strategic Submarine Industry Market Outlook
The future of the submarine industry is promising, with strong growth anticipated, driven by continuous technological advancements and escalating geopolitical tensions. Strategic opportunities lie in developing advanced autonomous systems, integrating AI-powered capabilities, and exploring new propulsion technologies. The market presents substantial potential for players who can innovate, manage costs effectively, and meet the evolving needs of their customers in an increasingly complex geopolitical landscape.
Submarine Industry Segmentation
- 1. Production Analysis
- 2. Consumption Analysis
- 3. Import Market Analysis (Value & Volume)
- 4. Export Market Analysis (Value & Volume)
- 5. Price Trend Analysis
Submarine Industry Segmentation By Geography
-
1. North America
- 1.1. United States
- 1.2. Canada
- 1.3. Mexico
-
2. South America
- 2.1. Brazil
- 2.2. Argentina
- 2.3. Rest of South America
-
3. Europe
- 3.1. United Kingdom
- 3.2. Germany
- 3.3. France
- 3.4. Italy
- 3.5. Spain
- 3.6. Russia
- 3.7. Benelux
- 3.8. Nordics
- 3.9. Rest of Europe
-
4. Middle East & Africa
- 4.1. Turkey
- 4.2. Israel
- 4.3. GCC
- 4.4. North Africa
- 4.5. South Africa
- 4.6. Rest of Middle East & Africa
-
5. Asia Pacific
- 5.1. China
- 5.2. India
- 5.3. Japan
- 5.4. South Korea
- 5.5. ASEAN
- 5.6. Oceania
- 5.7. Rest of Asia Pacific
Submarine Industry REPORT HIGHLIGHTS
| Aspects | Details |
|---|---|
| Study Period | 2019-2033 |
| Base Year | 2024 |
| Estimated Year | 2025 |
| Forecast Period | 2025-2033 |
| Historical Period | 2019-2024 |
| Growth Rate | CAGR of > 4.00% from 2019-2033 |
| Segmentation |
|
Table of Contents
- 1. Introduction
- 1.1. Research Scope
- 1.2. Market Segmentation
- 1.3. Research Methodology
- 1.4. Definitions and Assumptions
- 2. Executive Summary
- 2.1. Introduction
- 3. Market Dynamics
- 3.1. Introduction
- 3.2. Market Drivers
- 3.2.1. Increase in Internet of Things (IoT) and Autonomous Systems; Rise in Demand for Military and Defense Satellite Communication Solutions
- 3.3. Market Restrains
- 3.3.1. Cybersecurity Threats to Satellite Communication; Interference in Transmission of Data
- 3.4. Market Trends
- 3.4.1. Nuclear-Powered Submarines (SSN) Segment Is Anticipated to Grow with the Highest CAGR During the Forecast Period
- 4. Market Factor Analysis
- 4.1. Porters Five Forces
- 4.2. Supply/Value Chain
- 4.3. PESTEL analysis
- 4.4. Market Entropy
- 4.5. Patent/Trademark Analysis
- 5. Global Submarine Industry Analysis, Insights and Forecast, 2019-2031
- 5.1. Market Analysis, Insights and Forecast - by Production Analysis
- 5.2. Market Analysis, Insights and Forecast - by Consumption Analysis
- 5.3. Market Analysis, Insights and Forecast - by Import Market Analysis (Value & Volume)
- 5.4. Market Analysis, Insights and Forecast - by Export Market Analysis (Value & Volume)
- 5.5. Market Analysis, Insights and Forecast - by Price Trend Analysis
- 5.6. Market Analysis, Insights and Forecast - by Region
- 5.6.1. North America
- 5.6.2. South America
- 5.6.3. Europe
- 5.6.4. Middle East & Africa
- 5.6.5. Asia Pacific
- 5.1. Market Analysis, Insights and Forecast - by Production Analysis
- 6. North America Submarine Industry Analysis, Insights and Forecast, 2019-2031
- 6.1. Market Analysis, Insights and Forecast - by Production Analysis
- 6.2. Market Analysis, Insights and Forecast - by Consumption Analysis
- 6.3. Market Analysis, Insights and Forecast - by Import Market Analysis (Value & Volume)
- 6.4. Market Analysis, Insights and Forecast - by Export Market Analysis (Value & Volume)
- 6.5. Market Analysis, Insights and Forecast - by Price Trend Analysis
- 6.1. Market Analysis, Insights and Forecast - by Production Analysis
- 7. South America Submarine Industry Analysis, Insights and Forecast, 2019-2031
- 7.1. Market Analysis, Insights and Forecast - by Production Analysis
- 7.2. Market Analysis, Insights and Forecast - by Consumption Analysis
- 7.3. Market Analysis, Insights and Forecast - by Import Market Analysis (Value & Volume)
- 7.4. Market Analysis, Insights and Forecast - by Export Market Analysis (Value & Volume)
- 7.5. Market Analysis, Insights and Forecast - by Price Trend Analysis
- 7.1. Market Analysis, Insights and Forecast - by Production Analysis
- 8. Europe Submarine Industry Analysis, Insights and Forecast, 2019-2031
- 8.1. Market Analysis, Insights and Forecast - by Production Analysis
- 8.2. Market Analysis, Insights and Forecast - by Consumption Analysis
- 8.3. Market Analysis, Insights and Forecast - by Import Market Analysis (Value & Volume)
- 8.4. Market Analysis, Insights and Forecast - by Export Market Analysis (Value & Volume)
- 8.5. Market Analysis, Insights and Forecast - by Price Trend Analysis
- 8.1. Market Analysis, Insights and Forecast - by Production Analysis
- 9. Middle East & Africa Submarine Industry Analysis, Insights and Forecast, 2019-2031
- 9.1. Market Analysis, Insights and Forecast - by Production Analysis
- 9.2. Market Analysis, Insights and Forecast - by Consumption Analysis
- 9.3. Market Analysis, Insights and Forecast - by Import Market Analysis (Value & Volume)
- 9.4. Market Analysis, Insights and Forecast - by Export Market Analysis (Value & Volume)
- 9.5. Market Analysis, Insights and Forecast - by Price Trend Analysis
- 9.1. Market Analysis, Insights and Forecast - by Production Analysis
- 10. Asia Pacific Submarine Industry Analysis, Insights and Forecast, 2019-2031
- 10.1. Market Analysis, Insights and Forecast - by Production Analysis
- 10.2. Market Analysis, Insights and Forecast - by Consumption Analysis
- 10.3. Market Analysis, Insights and Forecast - by Import Market Analysis (Value & Volume)
- 10.4. Market Analysis, Insights and Forecast - by Export Market Analysis (Value & Volume)
- 10.5. Market Analysis, Insights and Forecast - by Price Trend Analysis
- 10.1. Market Analysis, Insights and Forecast - by Production Analysis
- 11. North America Submarine Industry Analysis, Insights and Forecast, 2019-2031
- 11.1. Market Analysis, Insights and Forecast - By Country/Sub-region
- 11.1.1 United States
- 11.1.2 Canada
- 12. Europe Submarine Industry Analysis, Insights and Forecast, 2019-2031
- 12.1. Market Analysis, Insights and Forecast - By Country/Sub-region
- 12.1.1 Germany
- 12.1.2 United Kingdom
- 12.1.3 France
- 12.1.4 Rest of Europe
- 13. Asia Pacific Submarine Industry Analysis, Insights and Forecast, 2019-2031
- 13.1. Market Analysis, Insights and Forecast - By Country/Sub-region
- 13.1.1 China
- 13.1.2 India
- 13.1.3 Japan
- 13.1.4 Australia
- 13.1.5 Rest of Asia Pacific
- 14. Latin America Submarine Industry Analysis, Insights and Forecast, 2019-2031
- 14.1. Market Analysis, Insights and Forecast - By Country/Sub-region
- 14.1.1 Brazil
- 14.1.2 Rest of Latin America
- 15. Middle East and Africa Submarine Industry Analysis, Insights and Forecast, 2019-2031
- 15.1. Market Analysis, Insights and Forecast - By Country/Sub-region
- 15.1.1 South Africa
- 15.1.2 Rest of Middle East and Africa
- 16. Competitive Analysis
- 16.1. Global Market Share Analysis 2024
- 16.2. Company Profiles
- 16.2.1 General Dynamics Corporation
- 16.2.1.1. Overview
- 16.2.1.2. Products
- 16.2.1.3. SWOT Analysis
- 16.2.1.4. Recent Developments
- 16.2.1.5. Financials (Based on Availability)
- 16.2.2 Naval Group
- 16.2.2.1. Overview
- 16.2.2.2. Products
- 16.2.2.3. SWOT Analysis
- 16.2.2.4. Recent Developments
- 16.2.2.5. Financials (Based on Availability)
- 16.2.3 FINCANTIERI S p A
- 16.2.3.1. Overview
- 16.2.3.2. Products
- 16.2.3.3. SWOT Analysis
- 16.2.3.4. Recent Developments
- 16.2.3.5. Financials (Based on Availability)
- 16.2.4 HD Hyundai Heavy Industries
- 16.2.4.1. Overview
- 16.2.4.2. Products
- 16.2.4.3. SWOT Analysis
- 16.2.4.4. Recent Developments
- 16.2.4.5. Financials (Based on Availability)
- 16.2.5 thyssenkrupp AG
- 16.2.5.1. Overview
- 16.2.5.2. Products
- 16.2.5.3. SWOT Analysis
- 16.2.5.4. Recent Developments
- 16.2.5.5. Financials (Based on Availability)
- 16.2.6 Daewoo Shipbuilding & Marine Engineering Co Ltd
- 16.2.6.1. Overview
- 16.2.6.2. Products
- 16.2.6.3. SWOT Analysis
- 16.2.6.4. Recent Developments
- 16.2.6.5. Financials (Based on Availability)
- 16.2.7 Huntington Ingalls Industries Inc
- 16.2.7.1. Overview
- 16.2.7.2. Products
- 16.2.7.3. SWOT Analysis
- 16.2.7.4. Recent Developments
- 16.2.7.5. Financials (Based on Availability)
- 16.2.8 Navantia S A SM E
- 16.2.8.1. Overview
- 16.2.8.2. Products
- 16.2.8.3. SWOT Analysis
- 16.2.8.4. Recent Developments
- 16.2.8.5. Financials (Based on Availability)
- 16.2.9 BAE Systems plc
- 16.2.9.1. Overview
- 16.2.9.2. Products
- 16.2.9.3. SWOT Analysis
- 16.2.9.4. Recent Developments
- 16.2.9.5. Financials (Based on Availability)
- 16.2.10 United Shipbuilding Corporation
- 16.2.10.1. Overview
- 16.2.10.2. Products
- 16.2.10.3. SWOT Analysis
- 16.2.10.4. Recent Developments
- 16.2.10.5. Financials (Based on Availability)
- 16.2.11 Saab AB
- 16.2.11.1. Overview
- 16.2.11.2. Products
- 16.2.11.3. SWOT Analysis
- 16.2.11.4. Recent Developments
- 16.2.11.5. Financials (Based on Availability)
- 16.2.12 Mitsubishi Heavy Industries Ltd
- 16.2.12.1. Overview
- 16.2.12.2. Products
- 16.2.12.3. SWOT Analysis
- 16.2.12.4. Recent Developments
- 16.2.12.5. Financials (Based on Availability)
- 16.2.1 General Dynamics Corporation
List of Figures
- Figure 1: Global Submarine Industry Revenue Breakdown (Million, %) by Region 2024 & 2032
- Figure 2: North America Submarine Industry Revenue (Million), by Country 2024 & 2032
- Figure 3: North America Submarine Industry Revenue Share (%), by Country 2024 & 2032
- Figure 4: Europe Submarine Industry Revenue (Million), by Country 2024 & 2032
- Figure 5: Europe Submarine Industry Revenue Share (%), by Country 2024 & 2032
- Figure 6: Asia Pacific Submarine Industry Revenue (Million), by Country 2024 & 2032
- Figure 7: Asia Pacific Submarine Industry Revenue Share (%), by Country 2024 & 2032
- Figure 8: Latin America Submarine Industry Revenue (Million), by Country 2024 & 2032
- Figure 9: Latin America Submarine Industry Revenue Share (%), by Country 2024 & 2032
- Figure 10: Middle East and Africa Submarine Industry Revenue (Million), by Country 2024 & 2032
- Figure 11: Middle East and Africa Submarine Industry Revenue Share (%), by Country 2024 & 2032
- Figure 12: North America Submarine Industry Revenue (Million), by Production Analysis 2024 & 2032
- Figure 13: North America Submarine Industry Revenue Share (%), by Production Analysis 2024 & 2032
- Figure 14: North America Submarine Industry Revenue (Million), by Consumption Analysis 2024 & 2032
- Figure 15: North America Submarine Industry Revenue Share (%), by Consumption Analysis 2024 & 2032
- Figure 16: North America Submarine Industry Revenue (Million), by Import Market Analysis (Value & Volume) 2024 & 2032
- Figure 17: North America Submarine Industry Revenue Share (%), by Import Market Analysis (Value & Volume) 2024 & 2032
- Figure 18: North America Submarine Industry Revenue (Million), by Export Market Analysis (Value & Volume) 2024 & 2032
- Figure 19: North America Submarine Industry Revenue Share (%), by Export Market Analysis (Value & Volume) 2024 & 2032
- Figure 20: North America Submarine Industry Revenue (Million), by Price Trend Analysis 2024 & 2032
- Figure 21: North America Submarine Industry Revenue Share (%), by Price Trend Analysis 2024 & 2032
- Figure 22: North America Submarine Industry Revenue (Million), by Country 2024 & 2032
- Figure 23: North America Submarine Industry Revenue Share (%), by Country 2024 & 2032
- Figure 24: South America Submarine Industry Revenue (Million), by Production Analysis 2024 & 2032
- Figure 25: South America Submarine Industry Revenue Share (%), by Production Analysis 2024 & 2032
- Figure 26: South America Submarine Industry Revenue (Million), by Consumption Analysis 2024 & 2032
- Figure 27: South America Submarine Industry Revenue Share (%), by Consumption Analysis 2024 & 2032
- Figure 28: South America Submarine Industry Revenue (Million), by Import Market Analysis (Value & Volume) 2024 & 2032
- Figure 29: South America Submarine Industry Revenue Share (%), by Import Market Analysis (Value & Volume) 2024 & 2032
- Figure 30: South America Submarine Industry Revenue (Million), by Export Market Analysis (Value & Volume) 2024 & 2032
- Figure 31: South America Submarine Industry Revenue Share (%), by Export Market Analysis (Value & Volume) 2024 & 2032
- Figure 32: South America Submarine Industry Revenue (Million), by Price Trend Analysis 2024 & 2032
- Figure 33: South America Submarine Industry Revenue Share (%), by Price Trend Analysis 2024 & 2032
- Figure 34: South America Submarine Industry Revenue (Million), by Country 2024 & 2032
- Figure 35: South America Submarine Industry Revenue Share (%), by Country 2024 & 2032
- Figure 36: Europe Submarine Industry Revenue (Million), by Production Analysis 2024 & 2032
- Figure 37: Europe Submarine Industry Revenue Share (%), by Production Analysis 2024 & 2032
- Figure 38: Europe Submarine Industry Revenue (Million), by Consumption Analysis 2024 & 2032
- Figure 39: Europe Submarine Industry Revenue Share (%), by Consumption Analysis 2024 & 2032
- Figure 40: Europe Submarine Industry Revenue (Million), by Import Market Analysis (Value & Volume) 2024 & 2032
- Figure 41: Europe Submarine Industry Revenue Share (%), by Import Market Analysis (Value & Volume) 2024 & 2032
- Figure 42: Europe Submarine Industry Revenue (Million), by Export Market Analysis (Value & Volume) 2024 & 2032
- Figure 43: Europe Submarine Industry Revenue Share (%), by Export Market Analysis (Value & Volume) 2024 & 2032
- Figure 44: Europe Submarine Industry Revenue (Million), by Price Trend Analysis 2024 & 2032
- Figure 45: Europe Submarine Industry Revenue Share (%), by Price Trend Analysis 2024 & 2032
- Figure 46: Europe Submarine Industry Revenue (Million), by Country 2024 & 2032
- Figure 47: Europe Submarine Industry Revenue Share (%), by Country 2024 & 2032
- Figure 48: Middle East & Africa Submarine Industry Revenue (Million), by Production Analysis 2024 & 2032
- Figure 49: Middle East & Africa Submarine Industry Revenue Share (%), by Production Analysis 2024 & 2032
- Figure 50: Middle East & Africa Submarine Industry Revenue (Million), by Consumption Analysis 2024 & 2032
- Figure 51: Middle East & Africa Submarine Industry Revenue Share (%), by Consumption Analysis 2024 & 2032
- Figure 52: Middle East & Africa Submarine Industry Revenue (Million), by Import Market Analysis (Value & Volume) 2024 & 2032
- Figure 53: Middle East & Africa Submarine Industry Revenue Share (%), by Import Market Analysis (Value & Volume) 2024 & 2032
- Figure 54: Middle East & Africa Submarine Industry Revenue (Million), by Export Market Analysis (Value & Volume) 2024 & 2032
- Figure 55: Middle East & Africa Submarine Industry Revenue Share (%), by Export Market Analysis (Value & Volume) 2024 & 2032
- Figure 56: Middle East & Africa Submarine Industry Revenue (Million), by Price Trend Analysis 2024 & 2032
- Figure 57: Middle East & Africa Submarine Industry Revenue Share (%), by Price Trend Analysis 2024 & 2032
- Figure 58: Middle East & Africa Submarine Industry Revenue (Million), by Country 2024 & 2032
- Figure 59: Middle East & Africa Submarine Industry Revenue Share (%), by Country 2024 & 2032
- Figure 60: Asia Pacific Submarine Industry Revenue (Million), by Production Analysis 2024 & 2032
- Figure 61: Asia Pacific Submarine Industry Revenue Share (%), by Production Analysis 2024 & 2032
- Figure 62: Asia Pacific Submarine Industry Revenue (Million), by Consumption Analysis 2024 & 2032
- Figure 63: Asia Pacific Submarine Industry Revenue Share (%), by Consumption Analysis 2024 & 2032
- Figure 64: Asia Pacific Submarine Industry Revenue (Million), by Import Market Analysis (Value & Volume) 2024 & 2032
- Figure 65: Asia Pacific Submarine Industry Revenue Share (%), by Import Market Analysis (Value & Volume) 2024 & 2032
- Figure 66: Asia Pacific Submarine Industry Revenue (Million), by Export Market Analysis (Value & Volume) 2024 & 2032
- Figure 67: Asia Pacific Submarine Industry Revenue Share (%), by Export Market Analysis (Value & Volume) 2024 & 2032
- Figure 68: Asia Pacific Submarine Industry Revenue (Million), by Price Trend Analysis 2024 & 2032
- Figure 69: Asia Pacific Submarine Industry Revenue Share (%), by Price Trend Analysis 2024 & 2032
- Figure 70: Asia Pacific Submarine Industry Revenue (Million), by Country 2024 & 2032
- Figure 71: Asia Pacific Submarine Industry Revenue Share (%), by Country 2024 & 2032
List of Tables
- Table 1: Global Submarine Industry Revenue Million Forecast, by Region 2019 & 2032
- Table 2: Global Submarine Industry Revenue Million Forecast, by Production Analysis 2019 & 2032
- Table 3: Global Submarine Industry Revenue Million Forecast, by Consumption Analysis 2019 & 2032
- Table 4: Global Submarine Industry Revenue Million Forecast, by Import Market Analysis (Value & Volume) 2019 & 2032
- Table 5: Global Submarine Industry Revenue Million Forecast, by Export Market Analysis (Value & Volume) 2019 & 2032
- Table 6: Global Submarine Industry Revenue Million Forecast, by Price Trend Analysis 2019 & 2032
- Table 7: Global Submarine Industry Revenue Million Forecast, by Region 2019 & 2032
- Table 8: Global Submarine Industry Revenue Million Forecast, by Country 2019 & 2032
- Table 9: United States Submarine Industry Revenue (Million) Forecast, by Application 2019 & 2032
- Table 10: Canada Submarine Industry Revenue (Million) Forecast, by Application 2019 & 2032
- Table 11: Global Submarine Industry Revenue Million Forecast, by Country 2019 & 2032
- Table 12: Germany Submarine Industry Revenue (Million) Forecast, by Application 2019 & 2032
- Table 13: United Kingdom Submarine Industry Revenue (Million) Forecast, by Application 2019 & 2032
- Table 14: France Submarine Industry Revenue (Million) Forecast, by Application 2019 & 2032
- Table 15: Rest of Europe Submarine Industry Revenue (Million) Forecast, by Application 2019 & 2032
- Table 16: Global Submarine Industry Revenue Million Forecast, by Country 2019 & 2032
- Table 17: China Submarine Industry Revenue (Million) Forecast, by Application 2019 & 2032
- Table 18: India Submarine Industry Revenue (Million) Forecast, by Application 2019 & 2032
- Table 19: Japan Submarine Industry Revenue (Million) Forecast, by Application 2019 & 2032
- Table 20: Australia Submarine Industry Revenue (Million) Forecast, by Application 2019 & 2032
- Table 21: Rest of Asia Pacific Submarine Industry Revenue (Million) Forecast, by Application 2019 & 2032
- Table 22: Global Submarine Industry Revenue Million Forecast, by Country 2019 & 2032
- Table 23: Brazil Submarine Industry Revenue (Million) Forecast, by Application 2019 & 2032
- Table 24: Rest of Latin America Submarine Industry Revenue (Million) Forecast, by Application 2019 & 2032
- Table 25: Global Submarine Industry Revenue Million Forecast, by Country 2019 & 2032
- Table 26: South Africa Submarine Industry Revenue (Million) Forecast, by Application 2019 & 2032
- Table 27: Rest of Middle East and Africa Submarine Industry Revenue (Million) Forecast, by Application 2019 & 2032
- Table 28: Global Submarine Industry Revenue Million Forecast, by Production Analysis 2019 & 2032
- Table 29: Global Submarine Industry Revenue Million Forecast, by Consumption Analysis 2019 & 2032
- Table 30: Global Submarine Industry Revenue Million Forecast, by Import Market Analysis (Value & Volume) 2019 & 2032
- Table 31: Global Submarine Industry Revenue Million Forecast, by Export Market Analysis (Value & Volume) 2019 & 2032
- Table 32: Global Submarine Industry Revenue Million Forecast, by Price Trend Analysis 2019 & 2032
- Table 33: Global Submarine Industry Revenue Million Forecast, by Country 2019 & 2032
- Table 34: United States Submarine Industry Revenue (Million) Forecast, by Application 2019 & 2032
- Table 35: Canada Submarine Industry Revenue (Million) Forecast, by Application 2019 & 2032
- Table 36: Mexico Submarine Industry Revenue (Million) Forecast, by Application 2019 & 2032
- Table 37: Global Submarine Industry Revenue Million Forecast, by Production Analysis 2019 & 2032
- Table 38: Global Submarine Industry Revenue Million Forecast, by Consumption Analysis 2019 & 2032
- Table 39: Global Submarine Industry Revenue Million Forecast, by Import Market Analysis (Value & Volume) 2019 & 2032
- Table 40: Global Submarine Industry Revenue Million Forecast, by Export Market Analysis (Value & Volume) 2019 & 2032
- Table 41: Global Submarine Industry Revenue Million Forecast, by Price Trend Analysis 2019 & 2032
- Table 42: Global Submarine Industry Revenue Million Forecast, by Country 2019 & 2032
- Table 43: Brazil Submarine Industry Revenue (Million) Forecast, by Application 2019 & 2032
- Table 44: Argentina Submarine Industry Revenue (Million) Forecast, by Application 2019 & 2032
- Table 45: Rest of South America Submarine Industry Revenue (Million) Forecast, by Application 2019 & 2032
- Table 46: Global Submarine Industry Revenue Million Forecast, by Production Analysis 2019 & 2032
- Table 47: Global Submarine Industry Revenue Million Forecast, by Consumption Analysis 2019 & 2032
- Table 48: Global Submarine Industry Revenue Million Forecast, by Import Market Analysis (Value & Volume) 2019 & 2032
- Table 49: Global Submarine Industry Revenue Million Forecast, by Export Market Analysis (Value & Volume) 2019 & 2032
- Table 50: Global Submarine Industry Revenue Million Forecast, by Price Trend Analysis 2019 & 2032
- Table 51: Global Submarine Industry Revenue Million Forecast, by Country 2019 & 2032
- Table 52: United Kingdom Submarine Industry Revenue (Million) Forecast, by Application 2019 & 2032
- Table 53: Germany Submarine Industry Revenue (Million) Forecast, by Application 2019 & 2032
- Table 54: France Submarine Industry Revenue (Million) Forecast, by Application 2019 & 2032
- Table 55: Italy Submarine Industry Revenue (Million) Forecast, by Application 2019 & 2032
- Table 56: Spain Submarine Industry Revenue (Million) Forecast, by Application 2019 & 2032
- Table 57: Russia Submarine Industry Revenue (Million) Forecast, by Application 2019 & 2032
- Table 58: Benelux Submarine Industry Revenue (Million) Forecast, by Application 2019 & 2032
- Table 59: Nordics Submarine Industry Revenue (Million) Forecast, by Application 2019 & 2032
- Table 60: Rest of Europe Submarine Industry Revenue (Million) Forecast, by Application 2019 & 2032
- Table 61: Global Submarine Industry Revenue Million Forecast, by Production Analysis 2019 & 2032
- Table 62: Global Submarine Industry Revenue Million Forecast, by Consumption Analysis 2019 & 2032
- Table 63: Global Submarine Industry Revenue Million Forecast, by Import Market Analysis (Value & Volume) 2019 & 2032
- Table 64: Global Submarine Industry Revenue Million Forecast, by Export Market Analysis (Value & Volume) 2019 & 2032
- Table 65: Global Submarine Industry Revenue Million Forecast, by Price Trend Analysis 2019 & 2032
- Table 66: Global Submarine Industry Revenue Million Forecast, by Country 2019 & 2032
- Table 67: Turkey Submarine Industry Revenue (Million) Forecast, by Application 2019 & 2032
- Table 68: Israel Submarine Industry Revenue (Million) Forecast, by Application 2019 & 2032
- Table 69: GCC Submarine Industry Revenue (Million) Forecast, by Application 2019 & 2032
- Table 70: North Africa Submarine Industry Revenue (Million) Forecast, by Application 2019 & 2032
- Table 71: South Africa Submarine Industry Revenue (Million) Forecast, by Application 2019 & 2032
- Table 72: Rest of Middle East & Africa Submarine Industry Revenue (Million) Forecast, by Application 2019 & 2032
- Table 73: Global Submarine Industry Revenue Million Forecast, by Production Analysis 2019 & 2032
- Table 74: Global Submarine Industry Revenue Million Forecast, by Consumption Analysis 2019 & 2032
- Table 75: Global Submarine Industry Revenue Million Forecast, by Import Market Analysis (Value & Volume) 2019 & 2032
- Table 76: Global Submarine Industry Revenue Million Forecast, by Export Market Analysis (Value & Volume) 2019 & 2032
- Table 77: Global Submarine Industry Revenue Million Forecast, by Price Trend Analysis 2019 & 2032
- Table 78: Global Submarine Industry Revenue Million Forecast, by Country 2019 & 2032
- Table 79: China Submarine Industry Revenue (Million) Forecast, by Application 2019 & 2032
- Table 80: India Submarine Industry Revenue (Million) Forecast, by Application 2019 & 2032
- Table 81: Japan Submarine Industry Revenue (Million) Forecast, by Application 2019 & 2032
- Table 82: South Korea Submarine Industry Revenue (Million) Forecast, by Application 2019 & 2032
- Table 83: ASEAN Submarine Industry Revenue (Million) Forecast, by Application 2019 & 2032
- Table 84: Oceania Submarine Industry Revenue (Million) Forecast, by Application 2019 & 2032
- Table 85: Rest of Asia Pacific Submarine Industry Revenue (Million) Forecast, by Application 2019 & 2032
Frequently Asked Questions
1. What is the projected Compound Annual Growth Rate (CAGR) of the Submarine Industry?
The projected CAGR is approximately > 4.00%.
2. Which companies are prominent players in the Submarine Industry?
Key companies in the market include General Dynamics Corporation, Naval Group, FINCANTIERI S p A, HD Hyundai Heavy Industries, thyssenkrupp AG, Daewoo Shipbuilding & Marine Engineering Co Ltd, Huntington Ingalls Industries Inc, Navantia S A SM E, BAE Systems plc, United Shipbuilding Corporation, Saab AB, Mitsubishi Heavy Industries Ltd.
3. What are the main segments of the Submarine Industry?
The market segments include Production Analysis, Consumption Analysis, Import Market Analysis (Value & Volume), Export Market Analysis (Value & Volume), Price Trend Analysis.
4. Can you provide details about the market size?
The market size is estimated to be USD XX Million as of 2022.
5. What are some drivers contributing to market growth?
Increase in Internet of Things (IoT) and Autonomous Systems; Rise in Demand for Military and Defense Satellite Communication Solutions.
6. What are the notable trends driving market growth?
Nuclear-Powered Submarines (SSN) Segment Is Anticipated to Grow with the Highest CAGR During the Forecast Period.
7. Are there any restraints impacting market growth?
Cybersecurity Threats to Satellite Communication; Interference in Transmission of Data.
8. Can you provide examples of recent developments in the market?
December 2022: Indian shipbuilder Mazagon Dock Limited (MDL) announced that they delivered "Vagir," the fifth Scorpene-type submarine (Kalvari-class), to the Indian Navy.
9. What pricing options are available for accessing the report?
Pricing options include single-user, multi-user, and enterprise licenses priced at USD 4750, USD 5250, and USD 8750 respectively.
10. Is the market size provided in terms of value or volume?
The market size is provided in terms of value, measured in Million.
11. Are there any specific market keywords associated with the report?
Yes, the market keyword associated with the report is "Submarine Industry," which aids in identifying and referencing the specific market segment covered.
12. How do I determine which pricing option suits my needs best?
The pricing options vary based on user requirements and access needs. Individual users may opt for single-user licenses, while businesses requiring broader access may choose multi-user or enterprise licenses for cost-effective access to the report.
13. Are there any additional resources or data provided in the Submarine Industry report?
While the report offers comprehensive insights, it's advisable to review the specific contents or supplementary materials provided to ascertain if additional resources or data are available.
14. How can I stay updated on further developments or reports in the Submarine Industry?
To stay informed about further developments, trends, and reports in the Submarine Industry, consider subscribing to industry newsletters, following relevant companies and organizations, or regularly checking reputable industry news sources and publications.
Methodology
Step 1 - Identification of Relevant Samples Size from Population Database


Step 2 - Approaches for Defining Global Market Size (Value, Volume* & Price*)

Note*: In applicable scenarios
Step 3 - Data Sources
Primary Research
- Web Analytics
- Survey Reports
- Research Institute
- Latest Research Reports
- Opinion Leaders
Secondary Research
- Annual Reports
- White Paper
- Latest Press Release
- Industry Association
- Paid Database
- Investor Presentations

Step 4 - Data Triangulation
Involves using different sources of information in order to increase the validity of a study
These sources are likely to be stakeholders in a program - participants, other researchers, program staff, other community members, and so on.
Then we put all data in single framework & apply various statistical tools to find out the dynamic on the market.
During the analysis stage, feedback from the stakeholder groups would be compared to determine areas of agreement as well as areas of divergence


