

Key Insights
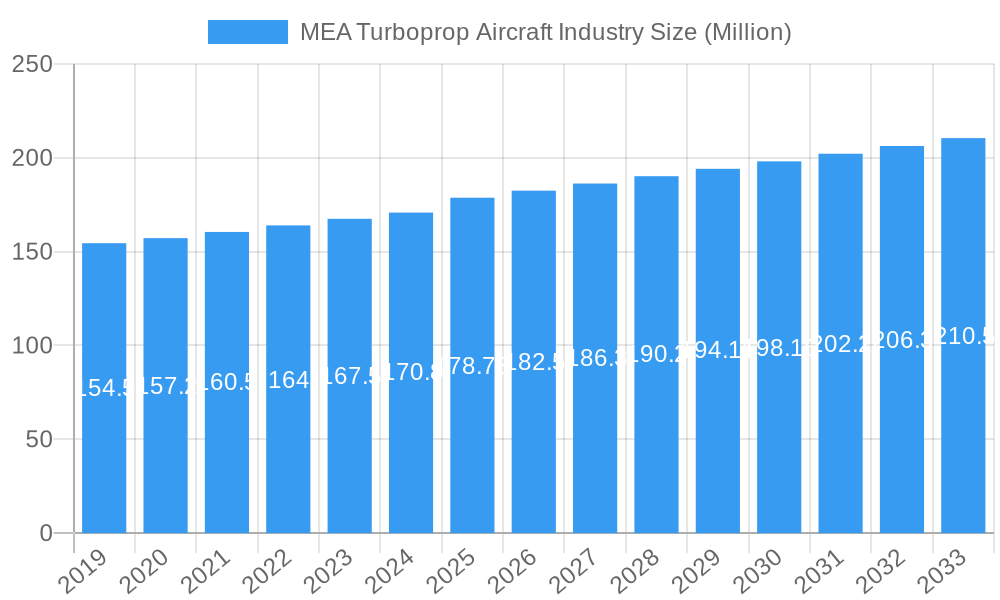
The Middle East & Africa (MEA) turboprop aircraft market is poised for steady growth, projected to reach an estimated USD 178.73 million by 2025, with a Compound Annual Growth Rate (CAGR) of 2.25% anticipated through 2033. This expansion is primarily fueled by the increasing demand for regional connectivity, efficient cargo transport, and a growing emphasis on sustainable aviation solutions across the MEA region. The inherent fuel efficiency and versatility of turboprop aircraft make them ideal for operating in diverse terrains and serving less accessible routes, which are prevalent throughout Africa and parts of the Middle East. Furthermore, advancements in engine technology and cabin comfort are enhancing the appeal of turboprop aircraft for both commercial and specialized operations.
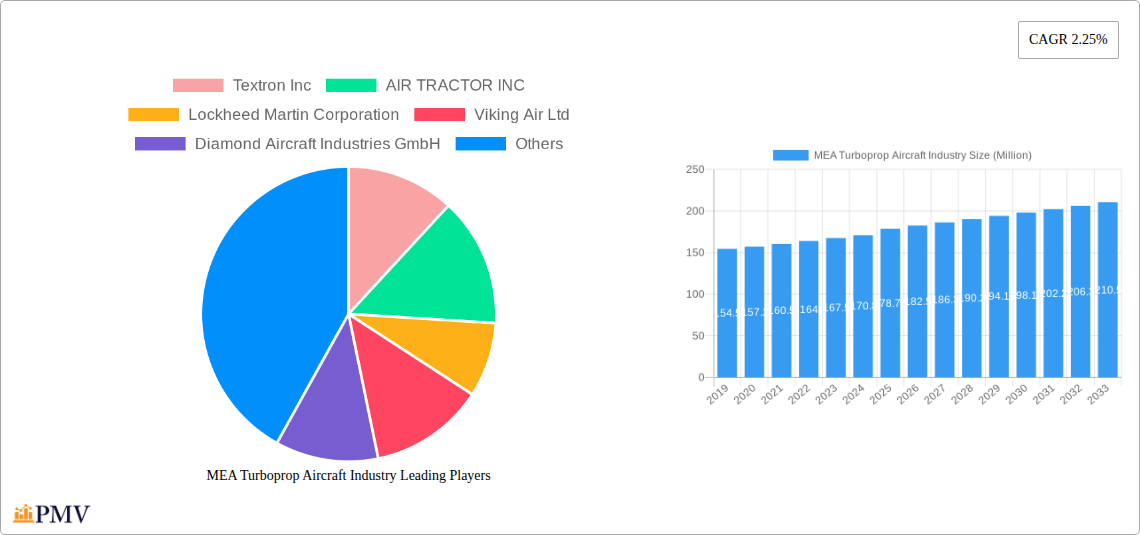
MEA Turboprop Aircraft Industry Market Size (In Million)
Key drivers contributing to this market trajectory include the ongoing development of regional aviation infrastructure, particularly in emerging economies, and the rising need for specialized turboprop applications such as aerial surveillance, agricultural spraying, and emergency medical services. The region’s growing tourism sector also necessitates reliable air transport to remote or underserved destinations. While the market benefits from these upward trends, it also faces certain restraints, including fluctuating fuel prices, stringent aviation regulations, and the high initial investment costs associated with acquiring new aircraft. However, the persistent demand for cost-effective and adaptable aviation solutions, coupled with ongoing fleet modernization efforts by regional carriers, is expected to largely offset these challenges and maintain a positive growth outlook for the MEA turboprop aircraft market.
MEA Turboprop Aircraft Industry Company Market Share
This comprehensive report delves into the Middle East & Africa (MEA) Turboprop Aircraft Industry, providing an in-depth analysis of production, consumption, import, export, and price trends from 2019 to 2033. Utilizing a base year of 2025 and a forecast period of 2025-2033, this study offers critical insights for stakeholders seeking to understand market dynamics, competitive landscapes, and future growth opportunities within the MEA turboprop aircraft sector. The report covers major players like Textron Inc., AIR TRACTOR INC., Lockheed Martin Corporation, Viking Air Ltd, Diamond Aircraft Industries GmbH, Pilatus Aircraft Ltd, DAHER, ATR, Piper Aircraft Inc, and PiaggioAero Industries S p a.
MEA Turboprop Aircraft Industry Market Structure & Competitive Dynamics
The MEA Turboprop Aircraft Industry exhibits a moderately concentrated market structure, characterized by the presence of established global manufacturers and a growing number of regional players focusing on specialized niches. Innovation ecosystems are evolving, driven by advancements in engine technology, avionics, and airframe design, leading to enhanced fuel efficiency and operational capabilities. Regulatory frameworks across the MEA region are becoming more standardized, fostering easier market access and increased demand for turboprop aircraft for various applications, including regional connectivity, cargo transport, and specialized missions. Product substitutes, primarily light jets and advanced helicopters, pose a moderate threat, but the cost-effectiveness and versatility of turboprops maintain their competitive edge. End-user trends indicate a surge in demand for aircraft supporting regional development, humanitarian aid, and business aviation. Mergers and acquisitions (M&A) activities are anticipated to increase as larger players seek to consolidate market share and acquire technological capabilities. For instance, a hypothetical M&A deal value of $1.5 Billion could be observed in the next three years. Market share for the top five players is estimated to be around 65%, highlighting a degree of dominance.
MEA Turboprop Aircraft Industry Industry Trends & Insights
The MEA Turboprop Aircraft Industry is poised for robust growth, driven by a confluence of economic, technological, and operational factors. The projected Compound Annual Growth Rate (CAGR) for the forecast period (2025-2033) is an impressive 8.5%. This expansion is fueled by the increasing need for efficient and cost-effective air transportation solutions in a region characterized by vast geographical distances and developing infrastructure. Technological disruptions, including the integration of advanced composite materials for lighter and more durable airframes, and the development of more fuel-efficient turboprop engines, are enhancing the performance and appeal of these aircraft. Consumer preferences are shifting towards aircraft that offer lower operating costs, greater range, and versatility for diverse missions, from passenger transport in underserved regions to specialized agricultural and surveillance operations. Competitive dynamics are intensifying, with manufacturers focusing on product differentiation through enhanced passenger comfort, improved payload capacity, and advanced safety features. Market penetration is expected to rise significantly, particularly in emerging economies within Africa, where turboprop aircraft serve as vital links for commerce and connectivity. The demand for new aircraft is projected to reach 350 units annually by 2025, with an estimated market value of $5 Billion.
Dominant Markets & Segments in MEA Turboprop Aircraft Industry
Production Analysis: The leading region for turboprop aircraft production within the MEA context is not directly established in the region itself; rather, it's dominated by global manufacturers with significant export capabilities to the MEA. However, localized assembly and maintenance operations are growing. Key drivers include the presence of skilled labor and government incentives for aerospace manufacturing.
Consumption Analysis: Africa, particularly East and West Africa, is emerging as a dominant consumption market for turboprop aircraft. This dominance is driven by:
- Economic Policies: Governments are investing in regional connectivity and infrastructure development to boost trade and tourism.
- Infrastructure: The need for reliable air transport in areas with underdeveloped road and rail networks.
- Demand for Regional Airliners: Turboprops are ideal for short-haul, high-frequency routes connecting secondary cities.
- Agricultural and Resource Sector Needs: Aircraft are crucial for spraying, surveying, and transporting personnel in these industries.
Import Market Analysis (Value & Volume): The import market is significantly led by countries in North Africa (e.g., Egypt, Algeria) and Sub-Saharan Africa, driven by the demand outlined in the consumption analysis.
- Value: Projected import value for 2025 is estimated at $3.2 Billion.
- Volume: Approximately 280 units are expected to be imported in 2025.
- Key Drivers: Growing fleet expansion plans by regional airlines and an increase in private and corporate aviation.
Export Market Analysis (Value & Volume): While the MEA region is primarily a net importer, there is a nascent export market for specialized turboprop components and maintenance services, particularly from established aerospace hubs within the region.
- Value: Estimated export value in 2025 is $300 Million.
- Volume: Around 30 units of specialized or refurbished aircraft are exported annually.
- Key Drivers: Growing MRO (Maintenance, Repair, and Overhaul) capabilities and niche manufacturing.
Price Trend Analysis: Price trends for new turboprop aircraft are influenced by raw material costs, technological advancements, and demand-supply dynamics.
- Average New Aircraft Price: Expected to range from $15 Million to $30 Million for regional commuter models.
- Used Aircraft Market: The secondary market is robust, offering attractive price points, with prices ranging from $5 Million to $15 Million depending on age and condition.
- Key Drivers: Inflationary pressures, increasing demand for fuel-efficient models, and the cost of advanced avionics and safety systems.
MEA Turboprop Aircraft Industry Product Innovations
Product innovations in the MEA Turboprop Aircraft Industry are increasingly focusing on enhancing fuel efficiency, reducing emissions, and improving cabin comfort. Advances in turboprop engine technology, such as the development of geared turbofans and hybrid-electric propulsion systems, are at the forefront. The integration of advanced composite materials leads to lighter, more durable airframes, improving payload capacity and range. Furthermore, sophisticated avionics suites, including enhanced synthetic vision systems and predictive maintenance capabilities, are being introduced to improve operational safety and reduce downtime. These innovations offer a competitive advantage by catering to the growing demand for sustainable, cost-effective, and versatile aircraft solutions in the region.
Report Segmentation & Scope
This report meticulously segments the MEA Turboprop Aircraft Industry across key market dimensions. The Production Analysis segment focuses on manufacturing capabilities and output from key manufacturers supplying the region, with projected growth of 7.0% CAGR. Consumption Analysis examines the demand for turboprops across various end-use applications, including regional aviation, cargo, and specialized missions, projecting a market size of $8 Billion by 2025. The Import Market Analysis (Value & Volume) details inbound aircraft trade, anticipating a 6.5% CAGR and a market value of $4 Billion by 2025. Conversely, the Export Market Analysis (Value & Volume) explores outbound trade, with a smaller but growing segment. Finally, the Price Trend Analysis provides insights into pricing dynamics for new and used aircraft, with new aircraft prices expected to grow by 4.0% annually.
Key Drivers of MEA Turboprop Aircraft Industry Growth
The MEA Turboprop Aircraft Industry's growth is propelled by several key factors. Economically, increasing investments in regional connectivity and infrastructure development across Africa are creating a surge in demand for turboprops to serve underserved routes. Technologically, advancements in engine efficiency and airframe materials are making turboprops more cost-effective and environmentally friendly. Regulatory frameworks are gradually becoming more conducive to air travel, supporting fleet expansion and new route development. The growing demand for specialized aerial services in agriculture, resource exploration, and humanitarian aid further bolsters the market.
Challenges in the MEA Turboprop Aircraft Industry Sector
Despite strong growth prospects, the MEA Turboprop Aircraft Industry faces several challenges. Regulatory hurdles and varying certification standards across different MEA countries can impede market entry and expansion. Supply chain disruptions, exacerbated by global economic uncertainties, can lead to increased lead times and costs for aircraft components. Intense competitive pressures from manufacturers offering a wide range of aircraft types, including used jets, also present a significant barrier. Furthermore, the need for substantial upfront investment in aircraft acquisition and the operational costs associated with maintenance and pilot training can be a restraint for smaller operators. The estimated impact of these challenges could slow market growth by up to 1.5%.
Leading Players in the MEA Turboprop Aircraft Industry Market
- Textron Inc.
- AIR TRACTOR INC.
- Lockheed Martin Corporation
- Viking Air Ltd
- Diamond Aircraft Industries GmbH
- Pilatus Aircraft Ltd
- DAHER
- ATR
- Piper Aircraft Inc
- PiaggioAero Industries S p a
Key Developments in MEA Turboprop Aircraft Industry Sector
- 2023/08: ATR announces delivery of its 100th aircraft to an African operator, highlighting growing regional demand.
- 2024/01: Pilatus Aircraft Ltd receives new EASA certification for an upgraded engine on its PC-12 NGX, enhancing performance and efficiency.
- 2024/05: DAHER invests in expanding its MRO capabilities in the UAE to support its turboprop aircraft fleet in the region.
- 2024/11: Textron Aviation introduces enhanced cabin configurations for its Cessna Caravan models, catering to business and regional travel needs.
- 2025/03: Diamond Aircraft Industries GmbH showcases its latest turboprop technology at an aviation expo in South Africa, emphasizing sustainability.
Strategic MEA Turboprop Aircraft Industry Market Outlook
The strategic outlook for the MEA Turboprop Aircraft Industry remains exceptionally positive, driven by unmet demand for regional connectivity and specialized aerial services. Growth accelerators include ongoing investments in aviation infrastructure, government initiatives to boost intra-regional trade, and the increasing adoption of advanced technologies. Opportunities lie in developing tailored solutions for emerging markets, expanding MRO services, and exploring niche applications like aerial surveying and emergency medical services. The industry is expected to witness further consolidation and strategic partnerships to leverage economies of scale and technological expertise, ensuring sustained growth and market penetration. The estimated market potential is projected to reach $15 Billion by 2033.
MEA Turboprop Aircraft Industry Segmentation
- 1. Production Analysis
- 2. Consumption Analysis
- 3. Import Market Analysis (Value & Volume)
- 4. Export Market Analysis (Value & Volume)
- 5. Price Trend Analysis
MEA Turboprop Aircraft Industry Segmentation By Geography
-
1. North America
- 1.1. United States
- 1.2. Canada
- 1.3. Mexico
-
2. South America
- 2.1. Brazil
- 2.2. Argentina
- 2.3. Rest of South America
-
3. Europe
- 3.1. United Kingdom
- 3.2. Germany
- 3.3. France
- 3.4. Italy
- 3.5. Spain
- 3.6. Russia
- 3.7. Benelux
- 3.8. Nordics
- 3.9. Rest of Europe
-
4. Middle East & Africa
- 4.1. Turkey
- 4.2. Israel
- 4.3. GCC
- 4.4. North Africa
- 4.5. South Africa
- 4.6. Rest of Middle East & Africa
-
5. Asia Pacific
- 5.1. China
- 5.2. India
- 5.3. Japan
- 5.4. South Korea
- 5.5. ASEAN
- 5.6. Oceania
- 5.7. Rest of Asia Pacific
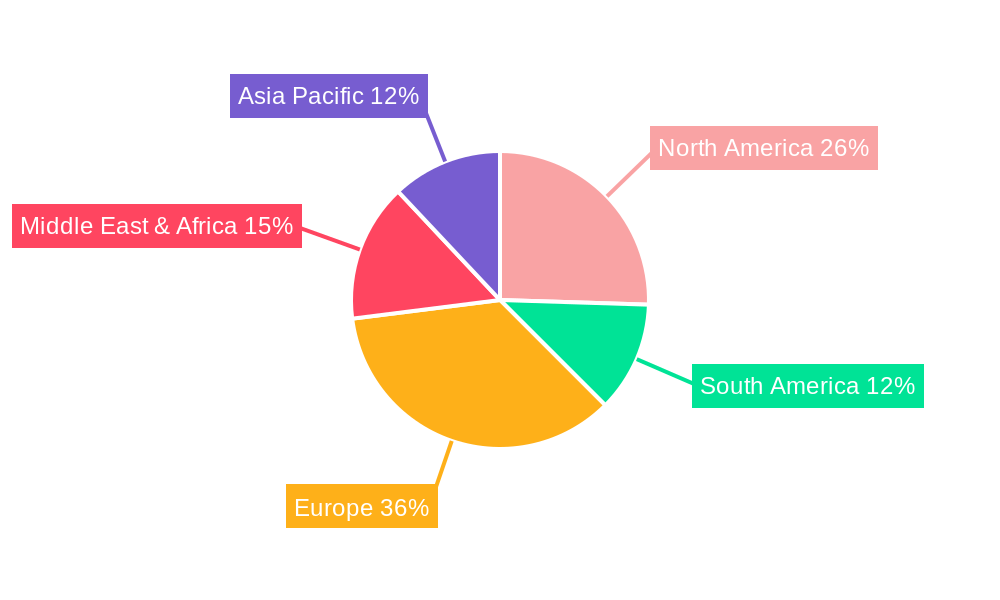
MEA Turboprop Aircraft Industry Regional Market Share
Geographic Coverage of MEA Turboprop Aircraft Industry
MEA Turboprop Aircraft Industry REPORT HIGHLIGHTS
| Aspects | Details |
|---|---|
| Study Period | 2020-2034 |
| Base Year | 2025 |
| Estimated Year | 2026 |
| Forecast Period | 2026-2034 |
| Historical Period | 2020-2025 |
| Growth Rate | CAGR of 2.25% from 2020-2034 |
| Segmentation |
|
Table of Contents
- 1. Introduction
- 1.1. Research Scope
- 1.2. Market Segmentation
- 1.3. Research Objective
- 1.4. Definitions and Assumptions
- 2. Executive Summary
- 2.1. Market Snapshot
- 3. Market Dynamics
- 3.1. Market Drivers
- 3.2. Market Restrains
- 3.3. Market Trends
- 3.4. Market Opportunities
- 4. Market Factor Analysis
- 4.1. Porters Five Forces
- 4.1.1. Bargaining Power of Suppliers
- 4.1.2. Bargaining Power of Buyers
- 4.1.3. Threat of New Entrants
- 4.1.4. Threat of Substitutes
- 4.1.5. Competitive Rivalry
- 4.2. PESTEL analysis
- 4.3. BCG Analysis
- 4.3.1. Stars (High Growth, High Market Share)
- 4.3.2. Cash Cows (Low Growth, High Market Share)
- 4.3.3. Question Mark (High Growth, Low Market Share)
- 4.3.4. Dogs (Low Growth, Low Market Share)
- 4.4. Ansoff Matrix Analysis
- 4.5. Supply Chain Analysis
- 4.6. Regulatory Landscape
- 4.7. Current Market Potential and Opportunity Assessment (TAM–SAM–SOM Framework)
- 4.8. PMV Analyst Note
- 4.1. Porters Five Forces
- 5. Market Analysis, Insights and Forecast 2021-2033
- 5.1. Market Analysis, Insights and Forecast - by Production Analysis
- 5.2. Market Analysis, Insights and Forecast - by Consumption Analysis
- 5.3. Market Analysis, Insights and Forecast - by Import Market Analysis (Value & Volume)
- 5.4. Market Analysis, Insights and Forecast - by Export Market Analysis (Value & Volume)
- 5.5. Market Analysis, Insights and Forecast - by Price Trend Analysis
- 5.6. Market Analysis, Insights and Forecast - by Region
- 5.6.1. North America
- 5.6.2. South America
- 5.6.3. Europe
- 5.6.4. Middle East & Africa
- 5.6.5. Asia Pacific
- 6. Global MEA Turboprop Aircraft Industry Analysis, Insights and Forecast, 2021-2033
- 6.1. Market Analysis, Insights and Forecast - by Production Analysis
- 6.2. Market Analysis, Insights and Forecast - by Consumption Analysis
- 6.3. Market Analysis, Insights and Forecast - by Import Market Analysis (Value & Volume)
- 6.4. Market Analysis, Insights and Forecast - by Export Market Analysis (Value & Volume)
- 6.5. Market Analysis, Insights and Forecast - by Price Trend Analysis
- 7. North America MEA Turboprop Aircraft Industry Analysis, Insights and Forecast, 2020-2032
- 7.1. Market Analysis, Insights and Forecast - by Production Analysis
- 7.2. Market Analysis, Insights and Forecast - by Consumption Analysis
- 7.3. Market Analysis, Insights and Forecast - by Import Market Analysis (Value & Volume)
- 7.4. Market Analysis, Insights and Forecast - by Export Market Analysis (Value & Volume)
- 7.5. Market Analysis, Insights and Forecast - by Price Trend Analysis
- 8. South America MEA Turboprop Aircraft Industry Analysis, Insights and Forecast, 2020-2032
- 8.1. Market Analysis, Insights and Forecast - by Production Analysis
- 8.2. Market Analysis, Insights and Forecast - by Consumption Analysis
- 8.3. Market Analysis, Insights and Forecast - by Import Market Analysis (Value & Volume)
- 8.4. Market Analysis, Insights and Forecast - by Export Market Analysis (Value & Volume)
- 8.5. Market Analysis, Insights and Forecast - by Price Trend Analysis
- 9. Europe MEA Turboprop Aircraft Industry Analysis, Insights and Forecast, 2020-2032
- 9.1. Market Analysis, Insights and Forecast - by Production Analysis
- 9.2. Market Analysis, Insights and Forecast - by Consumption Analysis
- 9.3. Market Analysis, Insights and Forecast - by Import Market Analysis (Value & Volume)
- 9.4. Market Analysis, Insights and Forecast - by Export Market Analysis (Value & Volume)
- 9.5. Market Analysis, Insights and Forecast - by Price Trend Analysis
- 10. Middle East & Africa MEA Turboprop Aircraft Industry Analysis, Insights and Forecast, 2020-2032
- 10.1. Market Analysis, Insights and Forecast - by Production Analysis
- 10.2. Market Analysis, Insights and Forecast - by Consumption Analysis
- 10.3. Market Analysis, Insights and Forecast - by Import Market Analysis (Value & Volume)
- 10.4. Market Analysis, Insights and Forecast - by Export Market Analysis (Value & Volume)
- 10.5. Market Analysis, Insights and Forecast - by Price Trend Analysis
- 11. Asia Pacific MEA Turboprop Aircraft Industry Analysis, Insights and Forecast, 2020-2032
- 11.1. Market Analysis, Insights and Forecast - by Production Analysis
- 11.2. Market Analysis, Insights and Forecast - by Consumption Analysis
- 11.3. Market Analysis, Insights and Forecast - by Import Market Analysis (Value & Volume)
- 11.4. Market Analysis, Insights and Forecast - by Export Market Analysis (Value & Volume)
- 11.5. Market Analysis, Insights and Forecast - by Price Trend Analysis
- 12. Competitive Analysis
- 12.1. Company Profiles
- 12.1.1 Textron Inc
- 12.1.1.1. Company Overview
- 12.1.1.2. Products
- 12.1.1.3. Company Financials
- 12.1.1.4. SWOT Analysis
- 12.1.2 AIR TRACTOR INC
- 12.1.2.1. Company Overview
- 12.1.2.2. Products
- 12.1.2.3. Company Financials
- 12.1.2.4. SWOT Analysis
- 12.1.3 Lockheed Martin Corporation
- 12.1.3.1. Company Overview
- 12.1.3.2. Products
- 12.1.3.3. Company Financials
- 12.1.3.4. SWOT Analysis
- 12.1.4 Viking Air Ltd
- 12.1.4.1. Company Overview
- 12.1.4.2. Products
- 12.1.4.3. Company Financials
- 12.1.4.4. SWOT Analysis
- 12.1.5 Diamond Aircraft Industries GmbH
- 12.1.5.1. Company Overview
- 12.1.5.2. Products
- 12.1.5.3. Company Financials
- 12.1.5.4. SWOT Analysis
- 12.1.6 Pilatus Aircraft Ltd
- 12.1.6.1. Company Overview
- 12.1.6.2. Products
- 12.1.6.3. Company Financials
- 12.1.6.4. SWOT Analysis
- 12.1.7 DAHER
- 12.1.7.1. Company Overview
- 12.1.7.2. Products
- 12.1.7.3. Company Financials
- 12.1.7.4. SWOT Analysis
- 12.1.8 ATR
- 12.1.8.1. Company Overview
- 12.1.8.2. Products
- 12.1.8.3. Company Financials
- 12.1.8.4. SWOT Analysis
- 12.1.9 Piper Aircraft Inc
- 12.1.9.1. Company Overview
- 12.1.9.2. Products
- 12.1.9.3. Company Financials
- 12.1.9.4. SWOT Analysis
- 12.1.10 PiaggioAero Industries S p a
- 12.1.10.1. Company Overview
- 12.1.10.2. Products
- 12.1.10.3. Company Financials
- 12.1.10.4. SWOT Analysis
- 12.1.1 Textron Inc
- 12.2. Market Entropy
- 12.2.1 Company's Key Areas Served
- 12.2.2 Recent Developments
- 12.3. Company Market Share Analysis 2025
- 12.3.1 Top 5 Companies Market Share Analysis
- 12.3.2 Top 3 Companies Market Share Analysis
- 12.4. List of Potential Customers
- 13. Research Methodology
List of Figures
- Figure 1: Global MEA Turboprop Aircraft Industry Revenue Breakdown (Million, %) by Region 2025 & 2033
- Figure 2: North America MEA Turboprop Aircraft Industry Revenue (Million), by Production Analysis 2025 & 2033
- Figure 3: North America MEA Turboprop Aircraft Industry Revenue Share (%), by Production Analysis 2025 & 2033
- Figure 4: North America MEA Turboprop Aircraft Industry Revenue (Million), by Consumption Analysis 2025 & 2033
- Figure 5: North America MEA Turboprop Aircraft Industry Revenue Share (%), by Consumption Analysis 2025 & 2033
- Figure 6: North America MEA Turboprop Aircraft Industry Revenue (Million), by Import Market Analysis (Value & Volume) 2025 & 2033
- Figure 7: North America MEA Turboprop Aircraft Industry Revenue Share (%), by Import Market Analysis (Value & Volume) 2025 & 2033
- Figure 8: North America MEA Turboprop Aircraft Industry Revenue (Million), by Export Market Analysis (Value & Volume) 2025 & 2033
- Figure 9: North America MEA Turboprop Aircraft Industry Revenue Share (%), by Export Market Analysis (Value & Volume) 2025 & 2033
- Figure 10: North America MEA Turboprop Aircraft Industry Revenue (Million), by Price Trend Analysis 2025 & 2033
- Figure 11: North America MEA Turboprop Aircraft Industry Revenue Share (%), by Price Trend Analysis 2025 & 2033
- Figure 12: North America MEA Turboprop Aircraft Industry Revenue (Million), by Country 2025 & 2033
- Figure 13: North America MEA Turboprop Aircraft Industry Revenue Share (%), by Country 2025 & 2033
- Figure 14: South America MEA Turboprop Aircraft Industry Revenue (Million), by Production Analysis 2025 & 2033
- Figure 15: South America MEA Turboprop Aircraft Industry Revenue Share (%), by Production Analysis 2025 & 2033
- Figure 16: South America MEA Turboprop Aircraft Industry Revenue (Million), by Consumption Analysis 2025 & 2033
- Figure 17: South America MEA Turboprop Aircraft Industry Revenue Share (%), by Consumption Analysis 2025 & 2033
- Figure 18: South America MEA Turboprop Aircraft Industry Revenue (Million), by Import Market Analysis (Value & Volume) 2025 & 2033
- Figure 19: South America MEA Turboprop Aircraft Industry Revenue Share (%), by Import Market Analysis (Value & Volume) 2025 & 2033
- Figure 20: South America MEA Turboprop Aircraft Industry Revenue (Million), by Export Market Analysis (Value & Volume) 2025 & 2033
- Figure 21: South America MEA Turboprop Aircraft Industry Revenue Share (%), by Export Market Analysis (Value & Volume) 2025 & 2033
- Figure 22: South America MEA Turboprop Aircraft Industry Revenue (Million), by Price Trend Analysis 2025 & 2033
- Figure 23: South America MEA Turboprop Aircraft Industry Revenue Share (%), by Price Trend Analysis 2025 & 2033
- Figure 24: South America MEA Turboprop Aircraft Industry Revenue (Million), by Country 2025 & 2033
- Figure 25: South America MEA Turboprop Aircraft Industry Revenue Share (%), by Country 2025 & 2033
- Figure 26: Europe MEA Turboprop Aircraft Industry Revenue (Million), by Production Analysis 2025 & 2033
- Figure 27: Europe MEA Turboprop Aircraft Industry Revenue Share (%), by Production Analysis 2025 & 2033
- Figure 28: Europe MEA Turboprop Aircraft Industry Revenue (Million), by Consumption Analysis 2025 & 2033
- Figure 29: Europe MEA Turboprop Aircraft Industry Revenue Share (%), by Consumption Analysis 2025 & 2033
- Figure 30: Europe MEA Turboprop Aircraft Industry Revenue (Million), by Import Market Analysis (Value & Volume) 2025 & 2033
- Figure 31: Europe MEA Turboprop Aircraft Industry Revenue Share (%), by Import Market Analysis (Value & Volume) 2025 & 2033
- Figure 32: Europe MEA Turboprop Aircraft Industry Revenue (Million), by Export Market Analysis (Value & Volume) 2025 & 2033
- Figure 33: Europe MEA Turboprop Aircraft Industry Revenue Share (%), by Export Market Analysis (Value & Volume) 2025 & 2033
- Figure 34: Europe MEA Turboprop Aircraft Industry Revenue (Million), by Price Trend Analysis 2025 & 2033
- Figure 35: Europe MEA Turboprop Aircraft Industry Revenue Share (%), by Price Trend Analysis 2025 & 2033
- Figure 36: Europe MEA Turboprop Aircraft Industry Revenue (Million), by Country 2025 & 2033
- Figure 37: Europe MEA Turboprop Aircraft Industry Revenue Share (%), by Country 2025 & 2033
- Figure 38: Middle East & Africa MEA Turboprop Aircraft Industry Revenue (Million), by Production Analysis 2025 & 2033
- Figure 39: Middle East & Africa MEA Turboprop Aircraft Industry Revenue Share (%), by Production Analysis 2025 & 2033
- Figure 40: Middle East & Africa MEA Turboprop Aircraft Industry Revenue (Million), by Consumption Analysis 2025 & 2033
- Figure 41: Middle East & Africa MEA Turboprop Aircraft Industry Revenue Share (%), by Consumption Analysis 2025 & 2033
- Figure 42: Middle East & Africa MEA Turboprop Aircraft Industry Revenue (Million), by Import Market Analysis (Value & Volume) 2025 & 2033
- Figure 43: Middle East & Africa MEA Turboprop Aircraft Industry Revenue Share (%), by Import Market Analysis (Value & Volume) 2025 & 2033
- Figure 44: Middle East & Africa MEA Turboprop Aircraft Industry Revenue (Million), by Export Market Analysis (Value & Volume) 2025 & 2033
- Figure 45: Middle East & Africa MEA Turboprop Aircraft Industry Revenue Share (%), by Export Market Analysis (Value & Volume) 2025 & 2033
- Figure 46: Middle East & Africa MEA Turboprop Aircraft Industry Revenue (Million), by Price Trend Analysis 2025 & 2033
- Figure 47: Middle East & Africa MEA Turboprop Aircraft Industry Revenue Share (%), by Price Trend Analysis 2025 & 2033
- Figure 48: Middle East & Africa MEA Turboprop Aircraft Industry Revenue (Million), by Country 2025 & 2033
- Figure 49: Middle East & Africa MEA Turboprop Aircraft Industry Revenue Share (%), by Country 2025 & 2033
- Figure 50: Asia Pacific MEA Turboprop Aircraft Industry Revenue (Million), by Production Analysis 2025 & 2033
- Figure 51: Asia Pacific MEA Turboprop Aircraft Industry Revenue Share (%), by Production Analysis 2025 & 2033
- Figure 52: Asia Pacific MEA Turboprop Aircraft Industry Revenue (Million), by Consumption Analysis 2025 & 2033
- Figure 53: Asia Pacific MEA Turboprop Aircraft Industry Revenue Share (%), by Consumption Analysis 2025 & 2033
- Figure 54: Asia Pacific MEA Turboprop Aircraft Industry Revenue (Million), by Import Market Analysis (Value & Volume) 2025 & 2033
- Figure 55: Asia Pacific MEA Turboprop Aircraft Industry Revenue Share (%), by Import Market Analysis (Value & Volume) 2025 & 2033
- Figure 56: Asia Pacific MEA Turboprop Aircraft Industry Revenue (Million), by Export Market Analysis (Value & Volume) 2025 & 2033
- Figure 57: Asia Pacific MEA Turboprop Aircraft Industry Revenue Share (%), by Export Market Analysis (Value & Volume) 2025 & 2033
- Figure 58: Asia Pacific MEA Turboprop Aircraft Industry Revenue (Million), by Price Trend Analysis 2025 & 2033
- Figure 59: Asia Pacific MEA Turboprop Aircraft Industry Revenue Share (%), by Price Trend Analysis 2025 & 2033
- Figure 60: Asia Pacific MEA Turboprop Aircraft Industry Revenue (Million), by Country 2025 & 2033
- Figure 61: Asia Pacific MEA Turboprop Aircraft Industry Revenue Share (%), by Country 2025 & 2033
List of Tables
- Table 1: Global MEA Turboprop Aircraft Industry Revenue Million Forecast, by Production Analysis 2020 & 2033
- Table 2: Global MEA Turboprop Aircraft Industry Revenue Million Forecast, by Consumption Analysis 2020 & 2033
- Table 3: Global MEA Turboprop Aircraft Industry Revenue Million Forecast, by Import Market Analysis (Value & Volume) 2020 & 2033
- Table 4: Global MEA Turboprop Aircraft Industry Revenue Million Forecast, by Export Market Analysis (Value & Volume) 2020 & 2033
- Table 5: Global MEA Turboprop Aircraft Industry Revenue Million Forecast, by Price Trend Analysis 2020 & 2033
- Table 6: Global MEA Turboprop Aircraft Industry Revenue Million Forecast, by Region 2020 & 2033
- Table 7: Global MEA Turboprop Aircraft Industry Revenue Million Forecast, by Production Analysis 2020 & 2033
- Table 8: Global MEA Turboprop Aircraft Industry Revenue Million Forecast, by Consumption Analysis 2020 & 2033
- Table 9: Global MEA Turboprop Aircraft Industry Revenue Million Forecast, by Import Market Analysis (Value & Volume) 2020 & 2033
- Table 10: Global MEA Turboprop Aircraft Industry Revenue Million Forecast, by Export Market Analysis (Value & Volume) 2020 & 2033
- Table 11: Global MEA Turboprop Aircraft Industry Revenue Million Forecast, by Price Trend Analysis 2020 & 2033
- Table 12: Global MEA Turboprop Aircraft Industry Revenue Million Forecast, by Country 2020 & 2033
- Table 13: United States MEA Turboprop Aircraft Industry Revenue (Million) Forecast, by Application 2020 & 2033
- Table 14: Canada MEA Turboprop Aircraft Industry Revenue (Million) Forecast, by Application 2020 & 2033
- Table 15: Mexico MEA Turboprop Aircraft Industry Revenue (Million) Forecast, by Application 2020 & 2033
- Table 16: Global MEA Turboprop Aircraft Industry Revenue Million Forecast, by Production Analysis 2020 & 2033
- Table 17: Global MEA Turboprop Aircraft Industry Revenue Million Forecast, by Consumption Analysis 2020 & 2033
- Table 18: Global MEA Turboprop Aircraft Industry Revenue Million Forecast, by Import Market Analysis (Value & Volume) 2020 & 2033
- Table 19: Global MEA Turboprop Aircraft Industry Revenue Million Forecast, by Export Market Analysis (Value & Volume) 2020 & 2033
- Table 20: Global MEA Turboprop Aircraft Industry Revenue Million Forecast, by Price Trend Analysis 2020 & 2033
- Table 21: Global MEA Turboprop Aircraft Industry Revenue Million Forecast, by Country 2020 & 2033
- Table 22: Brazil MEA Turboprop Aircraft Industry Revenue (Million) Forecast, by Application 2020 & 2033
- Table 23: Argentina MEA Turboprop Aircraft Industry Revenue (Million) Forecast, by Application 2020 & 2033
- Table 24: Rest of South America MEA Turboprop Aircraft Industry Revenue (Million) Forecast, by Application 2020 & 2033
- Table 25: Global MEA Turboprop Aircraft Industry Revenue Million Forecast, by Production Analysis 2020 & 2033
- Table 26: Global MEA Turboprop Aircraft Industry Revenue Million Forecast, by Consumption Analysis 2020 & 2033
- Table 27: Global MEA Turboprop Aircraft Industry Revenue Million Forecast, by Import Market Analysis (Value & Volume) 2020 & 2033
- Table 28: Global MEA Turboprop Aircraft Industry Revenue Million Forecast, by Export Market Analysis (Value & Volume) 2020 & 2033
- Table 29: Global MEA Turboprop Aircraft Industry Revenue Million Forecast, by Price Trend Analysis 2020 & 2033
- Table 30: Global MEA Turboprop Aircraft Industry Revenue Million Forecast, by Country 2020 & 2033
- Table 31: United Kingdom MEA Turboprop Aircraft Industry Revenue (Million) Forecast, by Application 2020 & 2033
- Table 32: Germany MEA Turboprop Aircraft Industry Revenue (Million) Forecast, by Application 2020 & 2033
- Table 33: France MEA Turboprop Aircraft Industry Revenue (Million) Forecast, by Application 2020 & 2033
- Table 34: Italy MEA Turboprop Aircraft Industry Revenue (Million) Forecast, by Application 2020 & 2033
- Table 35: Spain MEA Turboprop Aircraft Industry Revenue (Million) Forecast, by Application 2020 & 2033
- Table 36: Russia MEA Turboprop Aircraft Industry Revenue (Million) Forecast, by Application 2020 & 2033
- Table 37: Benelux MEA Turboprop Aircraft Industry Revenue (Million) Forecast, by Application 2020 & 2033
- Table 38: Nordics MEA Turboprop Aircraft Industry Revenue (Million) Forecast, by Application 2020 & 2033
- Table 39: Rest of Europe MEA Turboprop Aircraft Industry Revenue (Million) Forecast, by Application 2020 & 2033
- Table 40: Global MEA Turboprop Aircraft Industry Revenue Million Forecast, by Production Analysis 2020 & 2033
- Table 41: Global MEA Turboprop Aircraft Industry Revenue Million Forecast, by Consumption Analysis 2020 & 2033
- Table 42: Global MEA Turboprop Aircraft Industry Revenue Million Forecast, by Import Market Analysis (Value & Volume) 2020 & 2033
- Table 43: Global MEA Turboprop Aircraft Industry Revenue Million Forecast, by Export Market Analysis (Value & Volume) 2020 & 2033
- Table 44: Global MEA Turboprop Aircraft Industry Revenue Million Forecast, by Price Trend Analysis 2020 & 2033
- Table 45: Global MEA Turboprop Aircraft Industry Revenue Million Forecast, by Country 2020 & 2033
- Table 46: Turkey MEA Turboprop Aircraft Industry Revenue (Million) Forecast, by Application 2020 & 2033
- Table 47: Israel MEA Turboprop Aircraft Industry Revenue (Million) Forecast, by Application 2020 & 2033
- Table 48: GCC MEA Turboprop Aircraft Industry Revenue (Million) Forecast, by Application 2020 & 2033
- Table 49: North Africa MEA Turboprop Aircraft Industry Revenue (Million) Forecast, by Application 2020 & 2033
- Table 50: South Africa MEA Turboprop Aircraft Industry Revenue (Million) Forecast, by Application 2020 & 2033
- Table 51: Rest of Middle East & Africa MEA Turboprop Aircraft Industry Revenue (Million) Forecast, by Application 2020 & 2033
- Table 52: Global MEA Turboprop Aircraft Industry Revenue Million Forecast, by Production Analysis 2020 & 2033
- Table 53: Global MEA Turboprop Aircraft Industry Revenue Million Forecast, by Consumption Analysis 2020 & 2033
- Table 54: Global MEA Turboprop Aircraft Industry Revenue Million Forecast, by Import Market Analysis (Value & Volume) 2020 & 2033
- Table 55: Global MEA Turboprop Aircraft Industry Revenue Million Forecast, by Export Market Analysis (Value & Volume) 2020 & 2033
- Table 56: Global MEA Turboprop Aircraft Industry Revenue Million Forecast, by Price Trend Analysis 2020 & 2033
- Table 57: Global MEA Turboprop Aircraft Industry Revenue Million Forecast, by Country 2020 & 2033
- Table 58: China MEA Turboprop Aircraft Industry Revenue (Million) Forecast, by Application 2020 & 2033
- Table 59: India MEA Turboprop Aircraft Industry Revenue (Million) Forecast, by Application 2020 & 2033
- Table 60: Japan MEA Turboprop Aircraft Industry Revenue (Million) Forecast, by Application 2020 & 2033
- Table 61: South Korea MEA Turboprop Aircraft Industry Revenue (Million) Forecast, by Application 2020 & 2033
- Table 62: ASEAN MEA Turboprop Aircraft Industry Revenue (Million) Forecast, by Application 2020 & 2033
- Table 63: Oceania MEA Turboprop Aircraft Industry Revenue (Million) Forecast, by Application 2020 & 2033
- Table 64: Rest of Asia Pacific MEA Turboprop Aircraft Industry Revenue (Million) Forecast, by Application 2020 & 2033
Frequently Asked Questions
1. What is the projected Compound Annual Growth Rate (CAGR) of the MEA Turboprop Aircraft Industry?
The projected CAGR is approximately 2.25%.
2. Which companies are prominent players in the MEA Turboprop Aircraft Industry?
Key companies in the market include Textron Inc, AIR TRACTOR INC, Lockheed Martin Corporation, Viking Air Ltd, Diamond Aircraft Industries GmbH, Pilatus Aircraft Ltd, DAHER, ATR, Piper Aircraft Inc, PiaggioAero Industries S p a.
3. What are the main segments of the MEA Turboprop Aircraft Industry?
The market segments include Production Analysis, Consumption Analysis, Import Market Analysis (Value & Volume), Export Market Analysis (Value & Volume), Price Trend Analysis.
4. Can you provide details about the market size?
The market size is estimated to be USD 178.73 Million as of 2022.
5. What are some drivers contributing to market growth?
N/A
6. What are the notable trends driving market growth?
Commercial Aviation Segment to Exhibit the Highest Growth Rate During the Forecast Period.
7. Are there any restraints impacting market growth?
N/A
8. Can you provide examples of recent developments in the market?
N/A
9. What pricing options are available for accessing the report?
Pricing options include single-user, multi-user, and enterprise licenses priced at USD 4750, USD 4950, and USD 6800 respectively.
10. Is the market size provided in terms of value or volume?
The market size is provided in terms of value, measured in Million.
11. Are there any specific market keywords associated with the report?
Yes, the market keyword associated with the report is "MEA Turboprop Aircraft Industry," which aids in identifying and referencing the specific market segment covered.
12. How do I determine which pricing option suits my needs best?
The pricing options vary based on user requirements and access needs. Individual users may opt for single-user licenses, while businesses requiring broader access may choose multi-user or enterprise licenses for cost-effective access to the report.
13. Are there any additional resources or data provided in the MEA Turboprop Aircraft Industry report?
While the report offers comprehensive insights, it's advisable to review the specific contents or supplementary materials provided to ascertain if additional resources or data are available.
14. How can I stay updated on further developments or reports in the MEA Turboprop Aircraft Industry?
To stay informed about further developments, trends, and reports in the MEA Turboprop Aircraft Industry, consider subscribing to industry newsletters, following relevant companies and organizations, or regularly checking reputable industry news sources and publications.
Methodology
Step 1 - Identification of Relevant Samples Size from Population Database


Step 2 - Approaches for Defining Global Market Size (Value, Volume* & Price*)

Note*: In applicable scenarios
Step 3 - Data Sources
Primary Research
- Web Analytics
- Survey Reports
- Research Institute
- Latest Research Reports
- Opinion Leaders
Secondary Research
- Annual Reports
- White Paper
- Latest Press Release
- Industry Association
- Paid Database
- Investor Presentations

Step 4 - Data Triangulation
Involves using different sources of information in order to increase the validity of a study
These sources are likely to be stakeholders in a program - participants, other researchers, program staff, other community members, and so on.
Then we put all data in single framework & apply various statistical tools to find out the dynamic on the market.
During the analysis stage, feedback from the stakeholder groups would be compared to determine areas of agreement as well as areas of divergence