
Key Insights
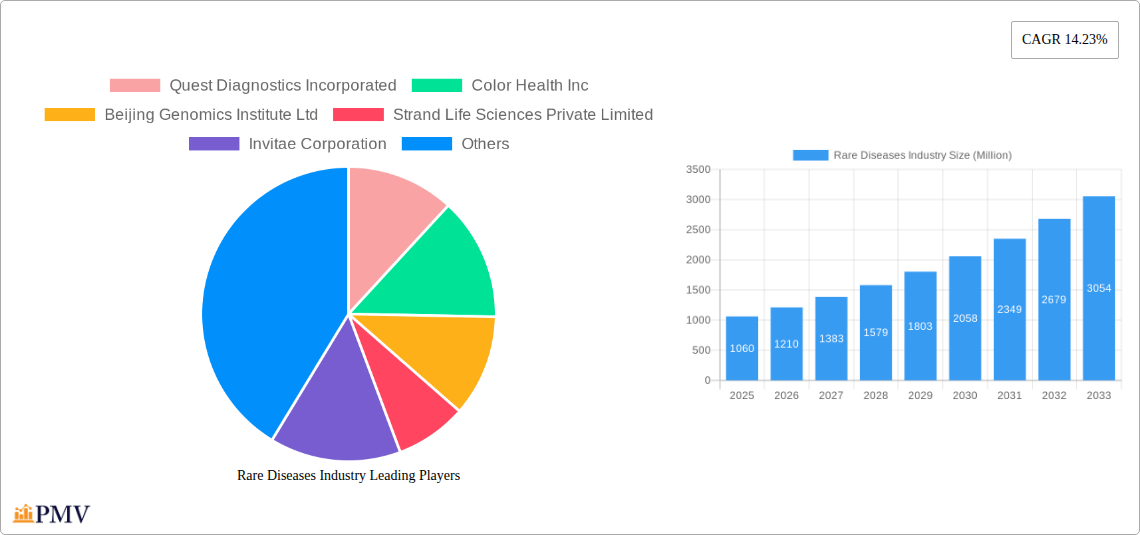
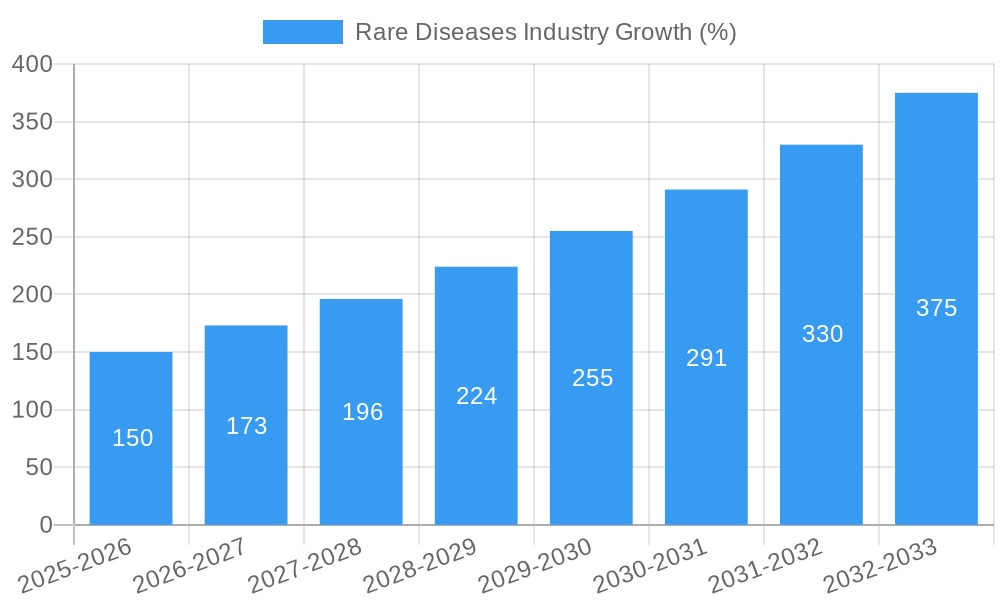
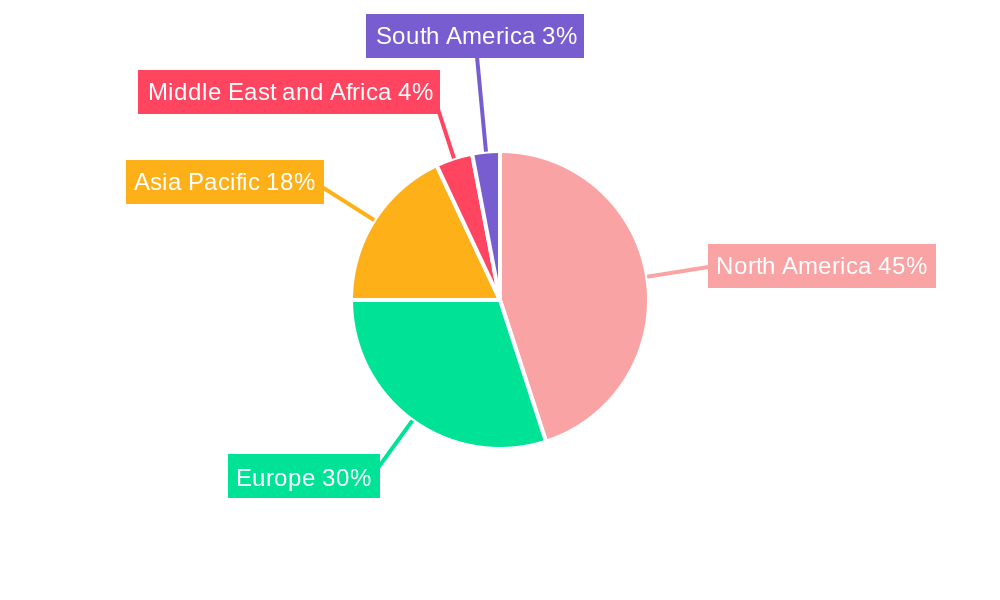
The rare diseases diagnostic market, valued at $1.06 billion in 2025, is experiencing robust growth, projected to expand at a compound annual growth rate (CAGR) of 14.23% from 2025 to 2033. This significant expansion is driven by several key factors. Increased awareness of rare diseases, coupled with advancements in genetic testing technologies like next-generation sequencing (NGS), whole genome sequencing (WGS), and PCR-based testing, are enabling earlier and more accurate diagnoses. The rising prevalence of neurological, immunological, hematological, endocrine, metabolic, cancer, and musculoskeletal disorders contributes to the market's growth. Furthermore, the development of more sophisticated diagnostic tools such as FISH (Fluorescence In Situ Hybridization) and array-based technologies continues to improve diagnostic capabilities, reducing diagnostic odyssey times for patients. Pharmaceutical companies' increased investment in research and development of targeted therapies for rare diseases further fuels market expansion by creating demand for accurate and timely diagnostics. The market is segmented by technology (NGS, WGS, PCR, FISH, other) and disease type, with significant regional variations in market share due to differences in healthcare infrastructure, regulatory frameworks, and disease prevalence. North America currently holds a substantial share, fueled by strong research investments and advanced healthcare infrastructure, followed by Europe and Asia Pacific, demonstrating substantial growth potential.
The market's growth is, however, tempered by several challenges. High diagnostic costs and limited access to specialized testing facilities in certain regions pose significant barriers. The complexity of rare diseases and the need for highly specialized expertise to interpret diagnostic results add further complexity. Regulatory hurdles in approving new diagnostic tests and the variability in reimbursement policies across different healthcare systems also act as restraints. Despite these challenges, the industry is poised for significant growth due to the increasing focus on personalized medicine, ongoing technological innovation, and the growing understanding of the genetic basis of rare diseases. The continued development of comprehensive and accessible diagnostic solutions will be key to unlocking the market's full potential and improving patient outcomes.
Rare Diseases Industry Market Report: 2019-2033
This comprehensive report provides a detailed analysis of the Rare Diseases Industry, offering valuable insights into market dynamics, competitive landscape, and future growth prospects. Covering the period from 2019 to 2033, with 2025 as the base year and a forecast period of 2025-2033, this report is an essential resource for industry stakeholders, investors, and researchers. The global market size is estimated to reach xx Million by 2025. The report segments the market by technology (Next-generation Sequencing, Whole Genome Sequencing (WGS), Array Technology, PCR-based Testing, FISH, Other Technologies), disease type (Neurological Disorders, Immunological Disorders, Hematology Diseases, Endocrine and Metabolism Diseases, Cancer, Musculoskeletal Disorders, Other Diseases), and key geographic regions.
Rare Diseases Industry Market Structure & Competitive Dynamics
The rare diseases market exhibits a moderately concentrated structure, with several multinational corporations and specialized diagnostic companies holding significant market share. Key players such as Quest Diagnostics Incorporated, Invitae Corporation, and Eurofins Scientific Inc. compete fiercely, driving innovation and market expansion. The industry's innovation ecosystem is robust, fueled by advancements in next-generation sequencing (NGS) technologies and bioinformatics. Stringent regulatory frameworks, particularly those governing diagnostic testing and drug approvals, influence market access and product development timelines. Product substitutes, such as traditional diagnostic methods, pose some competitive pressure, but the increasing demand for precise and efficient diagnostics fuels growth. End-user trends reflect a growing preference for non-invasive testing and personalized medicine approaches. Mergers and acquisitions (M&A) play a significant role, with deal values reaching hundreds of Millions annually. For example, in 2024, the M&A activity within the sector reached approximately xx Million across xx deals, consolidating market presence and expertise.
- Market Concentration: Moderately concentrated, with top players holding xx% market share in 2024.
- Innovation Ecosystems: Robust, driven by advancements in NGS and bioinformatics.
- Regulatory Frameworks: Stringent, influencing market access and development timelines.
- M&A Activity: Significant, with deal values reaching xx Million annually in 2024.
Rare Diseases Industry Industry Trends & Insights
The rare diseases industry is experiencing robust growth, driven by technological advancements, increasing prevalence of rare diseases, and a growing focus on personalized medicine. The compound annual growth rate (CAGR) for the period 2025-2033 is projected to be xx%, propelled by factors such as rising healthcare expenditure, increasing awareness of rare diseases among healthcare professionals and patients, and expanding access to diagnostic testing. The market penetration of NGS technologies is increasing rapidly, driving innovation in diagnostic tools and therapeutic development. Consumer preferences are shifting towards non-invasive and rapid testing methods, leading to a higher demand for advanced diagnostics. The competitive landscape is dynamic, with companies constantly striving to improve diagnostic accuracy and efficiency.
Dominant Markets & Segments in Rare Diseases Industry
North America currently dominates the rare diseases market, driven by factors such as high healthcare expenditure, advanced research infrastructure, and early adoption of new technologies. Within the segments:
- By Technology: Next-generation sequencing (NGS) is the dominant technology, witnessing significant growth due to its high throughput and accuracy.
- By Disease: Neurological disorders represent a major segment due to their high prevalence and severity.
- Key Drivers in North America:
- Robust healthcare infrastructure and high R&D investment.
- Favorable regulatory environment encouraging innovation.
- High awareness and acceptance of advanced diagnostic techniques.
- Significant government funding for rare disease research.
Within Europe, the market is driven by increasing government funding initiatives supporting research and development, along with a strong emphasis on personalized medicine. The Asia-Pacific region shows high growth potential, owing to the expanding healthcare sector and increasing disease awareness.
Rare Diseases Industry Product Innovations
Recent product innovations center around improved NGS technologies offering faster turnaround times, increased sensitivity, and reduced costs. New assays and platforms are being developed for early diagnosis and disease monitoring. These innovations are improving the accuracy and efficiency of diagnostic testing, leading to better patient outcomes and enhancing the market's overall competitiveness. Several companies are focusing on developing companion diagnostics to guide targeted therapy selection, enhancing personalized medicine.
Report Segmentation & Scope
This report segments the rare diseases market comprehensively:
- By Technology: Next-generation sequencing (NGS), Whole Genome Sequencing (WGS), Array Technology, PCR-based Testing, FISH, Other Technologies (with market size projections and competitive landscape analysis for each).
- By Disease: Neurological Disorders, Immunological Disorders, Hematology Diseases, Endocrine and Metabolism Diseases, Cancer, Musculoskeletal Disorders, Other Diseases (with market size and growth projections for each disease area).
Each segment includes detailed analysis of market size, growth projections, and competitive dynamics.
Key Drivers of Rare Diseases Industry Growth
Several factors fuel the growth of the rare diseases industry:
- Technological advancements: NGS, bioinformatics, and AI-driven diagnostics are improving diagnostic capabilities and accelerating research.
- Increasing disease prevalence: Higher awareness and improved diagnostic tools lead to identification of more cases.
- Government initiatives: Increased funding and policy support for research and development.
Challenges in the Rare Diseases Industry Sector
The industry faces challenges such as:
- High diagnostic costs: Limiting access for patients and healthcare providers.
- Regulatory hurdles: Complex approval processes and stringent guidelines for new diagnostic tests and therapies.
- Limited treatment options: Many rare diseases lack effective treatments, hindering market expansion.
Leading Players in the Rare Diseases Industry Market
- Quest Diagnostics Incorporated
- Color Health Inc
- Beijing Genomics Institute Ltd
- Strand Life Sciences Private Limited
- Invitae Corporation
- Macrogen Inc
- Ambry Genetics Corporations
- Baylor Miraca Genetics Laboratories LLC
- Centogene NV
- ARUP Laboratories
- Eurofins Scientific Inc
- PerkinElmer Genetics Inc
- 3billion Inc
Key Developments in Rare Diseases Industry Sector
- September 2022: Predicine Inc. received USFDA approval for PredicineCARE cfDNA Assay, an NGS assay for tumor mutation profiling. This expands diagnostic options for cancer patients.
- May 2022: The Qatar Genome Program (QGP) and Thermo Fisher Scientific partnered to advance genomic research and precision medicine in Qatar and globally. This collaboration expands access to advanced technologies in under-served regions.
Strategic Rare Diseases Industry Market Outlook
The rare diseases industry is poised for significant growth, driven by continuous technological innovations, increasing healthcare expenditure, and a growing focus on personalized medicine. Strategic opportunities lie in developing cost-effective diagnostic tools, expanding access to advanced therapies, and focusing on unmet medical needs. The market is expected to witness further consolidation through M&A activity, creating larger entities with broader reach and expertise.
Rare Diseases Industry Segmentation
-
1. Technology
- 1.1. Next-generation Sequencing
- 1.2. Array Technology
- 1.3. PCR-based Testing
- 1.4. FISH
- 1.5. Other Technologies
-
2. Disease
- 2.1. Neurological Disorders
- 2.2. Immunological Disorders
- 2.3. Hematology Diseases
- 2.4. Endocrine and Metabolism Diseases
- 2.5. Cancer
- 2.6. Musculoskeletal Disorders
- 2.7. Other Diseases
Rare Diseases Industry Segmentation By Geography
-
1. North America
- 1.1. United States
- 1.2. Canada
- 1.3. Mexico
-
2. Europe
- 2.1. Germany
- 2.2. United Kingdom
- 2.3. France
- 2.4. Italy
- 2.5. Spain
- 2.6. Rest of Europe
-
3. Asia Pacific
- 3.1. China
- 3.2. Japan
- 3.3. India
- 3.4. Australia
- 3.5. South Korea
- 3.6. Rest of Asia Pacific
-
4. Middle East and Africa
- 4.1. GCC
- 4.2. South Africa
- 4.3. Rest of Middle East and Africa
-
5. South America
- 5.1. Brazil
- 5.2. Argentina
- 5.3. Rest of South America
Rare Diseases Industry REPORT HIGHLIGHTS
| Aspects | Details |
|---|---|
| Study Period | 2019-2033 |
| Base Year | 2024 |
| Estimated Year | 2025 |
| Forecast Period | 2025-2033 |
| Historical Period | 2019-2024 |
| Growth Rate | CAGR of 14.23% from 2019-2033 |
| Segmentation |
|
Table of Contents
- 1. Introduction
- 1.1. Research Scope
- 1.2. Market Segmentation
- 1.3. Research Methodology
- 1.4. Definitions and Assumptions
- 2. Executive Summary
- 2.1. Introduction
- 3. Market Dynamics
- 3.1. Introduction
- 3.2. Market Drivers
- 3.2.1. Expanding Patient Registry for Rare Disease; Development in Genetic Testing Technologies; Increased Government Initiatives for Rare Diseases
- 3.3. Market Restrains
- 3.3.1. Lack of Awareness Regarding Rare Diseases; Technical Challenges Associated with Genetic Tests and Data Management
- 3.4. Market Trends
- 3.4.1. Whole Exome Sequencing (WES) is Expected to Witness a Significant Growth During the Forecast Period
- 4. Market Factor Analysis
- 4.1. Porters Five Forces
- 4.2. Supply/Value Chain
- 4.3. PESTEL analysis
- 4.4. Market Entropy
- 4.5. Patent/Trademark Analysis
- 5. Global Rare Diseases Industry Analysis, Insights and Forecast, 2019-2031
- 5.1. Market Analysis, Insights and Forecast - by Technology
- 5.1.1. Next-generation Sequencing
- 5.1.2. Array Technology
- 5.1.3. PCR-based Testing
- 5.1.4. FISH
- 5.1.5. Other Technologies
- 5.2. Market Analysis, Insights and Forecast - by Disease
- 5.2.1. Neurological Disorders
- 5.2.2. Immunological Disorders
- 5.2.3. Hematology Diseases
- 5.2.4. Endocrine and Metabolism Diseases
- 5.2.5. Cancer
- 5.2.6. Musculoskeletal Disorders
- 5.2.7. Other Diseases
- 5.3. Market Analysis, Insights and Forecast - by Region
- 5.3.1. North America
- 5.3.2. Europe
- 5.3.3. Asia Pacific
- 5.3.4. Middle East and Africa
- 5.3.5. South America
- 5.1. Market Analysis, Insights and Forecast - by Technology
- 6. North America Rare Diseases Industry Analysis, Insights and Forecast, 2019-2031
- 6.1. Market Analysis, Insights and Forecast - by Technology
- 6.1.1. Next-generation Sequencing
- 6.1.2. Array Technology
- 6.1.3. PCR-based Testing
- 6.1.4. FISH
- 6.1.5. Other Technologies
- 6.2. Market Analysis, Insights and Forecast - by Disease
- 6.2.1. Neurological Disorders
- 6.2.2. Immunological Disorders
- 6.2.3. Hematology Diseases
- 6.2.4. Endocrine and Metabolism Diseases
- 6.2.5. Cancer
- 6.2.6. Musculoskeletal Disorders
- 6.2.7. Other Diseases
- 6.1. Market Analysis, Insights and Forecast - by Technology
- 7. Europe Rare Diseases Industry Analysis, Insights and Forecast, 2019-2031
- 7.1. Market Analysis, Insights and Forecast - by Technology
- 7.1.1. Next-generation Sequencing
- 7.1.2. Array Technology
- 7.1.3. PCR-based Testing
- 7.1.4. FISH
- 7.1.5. Other Technologies
- 7.2. Market Analysis, Insights and Forecast - by Disease
- 7.2.1. Neurological Disorders
- 7.2.2. Immunological Disorders
- 7.2.3. Hematology Diseases
- 7.2.4. Endocrine and Metabolism Diseases
- 7.2.5. Cancer
- 7.2.6. Musculoskeletal Disorders
- 7.2.7. Other Diseases
- 7.1. Market Analysis, Insights and Forecast - by Technology
- 8. Asia Pacific Rare Diseases Industry Analysis, Insights and Forecast, 2019-2031
- 8.1. Market Analysis, Insights and Forecast - by Technology
- 8.1.1. Next-generation Sequencing
- 8.1.2. Array Technology
- 8.1.3. PCR-based Testing
- 8.1.4. FISH
- 8.1.5. Other Technologies
- 8.2. Market Analysis, Insights and Forecast - by Disease
- 8.2.1. Neurological Disorders
- 8.2.2. Immunological Disorders
- 8.2.3. Hematology Diseases
- 8.2.4. Endocrine and Metabolism Diseases
- 8.2.5. Cancer
- 8.2.6. Musculoskeletal Disorders
- 8.2.7. Other Diseases
- 8.1. Market Analysis, Insights and Forecast - by Technology
- 9. Middle East and Africa Rare Diseases Industry Analysis, Insights and Forecast, 2019-2031
- 9.1. Market Analysis, Insights and Forecast - by Technology
- 9.1.1. Next-generation Sequencing
- 9.1.2. Array Technology
- 9.1.3. PCR-based Testing
- 9.1.4. FISH
- 9.1.5. Other Technologies
- 9.2. Market Analysis, Insights and Forecast - by Disease
- 9.2.1. Neurological Disorders
- 9.2.2. Immunological Disorders
- 9.2.3. Hematology Diseases
- 9.2.4. Endocrine and Metabolism Diseases
- 9.2.5. Cancer
- 9.2.6. Musculoskeletal Disorders
- 9.2.7. Other Diseases
- 9.1. Market Analysis, Insights and Forecast - by Technology
- 10. South America Rare Diseases Industry Analysis, Insights and Forecast, 2019-2031
- 10.1. Market Analysis, Insights and Forecast - by Technology
- 10.1.1. Next-generation Sequencing
- 10.1.2. Array Technology
- 10.1.3. PCR-based Testing
- 10.1.4. FISH
- 10.1.5. Other Technologies
- 10.2. Market Analysis, Insights and Forecast - by Disease
- 10.2.1. Neurological Disorders
- 10.2.2. Immunological Disorders
- 10.2.3. Hematology Diseases
- 10.2.4. Endocrine and Metabolism Diseases
- 10.2.5. Cancer
- 10.2.6. Musculoskeletal Disorders
- 10.2.7. Other Diseases
- 10.1. Market Analysis, Insights and Forecast - by Technology
- 11. North America Rare Diseases Industry Analysis, Insights and Forecast, 2019-2031
- 11.1. Market Analysis, Insights and Forecast - By Country/Sub-region
- 11.1.1 United States
- 11.1.2 Canada
- 11.1.3 Mexico
- 12. Europe Rare Diseases Industry Analysis, Insights and Forecast, 2019-2031
- 12.1. Market Analysis, Insights and Forecast - By Country/Sub-region
- 12.1.1 Germany
- 12.1.2 United Kingdom
- 12.1.3 France
- 12.1.4 Italy
- 12.1.5 Spain
- 12.1.6 Rest of Europe
- 13. Asia Pacific Rare Diseases Industry Analysis, Insights and Forecast, 2019-2031
- 13.1. Market Analysis, Insights and Forecast - By Country/Sub-region
- 13.1.1 China
- 13.1.2 Japan
- 13.1.3 India
- 13.1.4 Australia
- 13.1.5 South Korea
- 13.1.6 Rest of Asia Pacific
- 14. Middle East and Africa Rare Diseases Industry Analysis, Insights and Forecast, 2019-2031
- 14.1. Market Analysis, Insights and Forecast - By Country/Sub-region
- 14.1.1 GCC
- 14.1.2 South Africa
- 14.1.3 Rest of Middle East and Africa
- 15. South America Rare Diseases Industry Analysis, Insights and Forecast, 2019-2031
- 15.1. Market Analysis, Insights and Forecast - By Country/Sub-region
- 15.1.1 Brazil
- 15.1.2 Argentina
- 15.1.3 Rest of South America
- 16. Competitive Analysis
- 16.1. Global Market Share Analysis 2024
- 16.2. Company Profiles
- 16.2.1 Quest Diagnostics Incorporated
- 16.2.1.1. Overview
- 16.2.1.2. Products
- 16.2.1.3. SWOT Analysis
- 16.2.1.4. Recent Developments
- 16.2.1.5. Financials (Based on Availability)
- 16.2.2 Color Health Inc
- 16.2.2.1. Overview
- 16.2.2.2. Products
- 16.2.2.3. SWOT Analysis
- 16.2.2.4. Recent Developments
- 16.2.2.5. Financials (Based on Availability)
- 16.2.3 Beijing Genomics Institute Ltd
- 16.2.3.1. Overview
- 16.2.3.2. Products
- 16.2.3.3. SWOT Analysis
- 16.2.3.4. Recent Developments
- 16.2.3.5. Financials (Based on Availability)
- 16.2.4 Strand Life Sciences Private Limited
- 16.2.4.1. Overview
- 16.2.4.2. Products
- 16.2.4.3. SWOT Analysis
- 16.2.4.4. Recent Developments
- 16.2.4.5. Financials (Based on Availability)
- 16.2.5 Invitae Corporation
- 16.2.5.1. Overview
- 16.2.5.2. Products
- 16.2.5.3. SWOT Analysis
- 16.2.5.4. Recent Developments
- 16.2.5.5. Financials (Based on Availability)
- 16.2.6 Macrogen Inc
- 16.2.6.1. Overview
- 16.2.6.2. Products
- 16.2.6.3. SWOT Analysis
- 16.2.6.4. Recent Developments
- 16.2.6.5. Financials (Based on Availability)
- 16.2.7 Ambry Genetics Corporations
- 16.2.7.1. Overview
- 16.2.7.2. Products
- 16.2.7.3. SWOT Analysis
- 16.2.7.4. Recent Developments
- 16.2.7.5. Financials (Based on Availability)
- 16.2.8 Baylor Miraca Genetics Laboratories LLC
- 16.2.8.1. Overview
- 16.2.8.2. Products
- 16.2.8.3. SWOT Analysis
- 16.2.8.4. Recent Developments
- 16.2.8.5. Financials (Based on Availability)
- 16.2.9 Centogene NV
- 16.2.9.1. Overview
- 16.2.9.2. Products
- 16.2.9.3. SWOT Analysis
- 16.2.9.4. Recent Developments
- 16.2.9.5. Financials (Based on Availability)
- 16.2.10 ARUP Laboratories
- 16.2.10.1. Overview
- 16.2.10.2. Products
- 16.2.10.3. SWOT Analysis
- 16.2.10.4. Recent Developments
- 16.2.10.5. Financials (Based on Availability)
- 16.2.11 Eurofins Scientific Inc
- 16.2.11.1. Overview
- 16.2.11.2. Products
- 16.2.11.3. SWOT Analysis
- 16.2.11.4. Recent Developments
- 16.2.11.5. Financials (Based on Availability)
- 16.2.12 PerkinElmer Genetics Inc
- 16.2.12.1. Overview
- 16.2.12.2. Products
- 16.2.12.3. SWOT Analysis
- 16.2.12.4. Recent Developments
- 16.2.12.5. Financials (Based on Availability)
- 16.2.13 3billion Inc
- 16.2.13.1. Overview
- 16.2.13.2. Products
- 16.2.13.3. SWOT Analysis
- 16.2.13.4. Recent Developments
- 16.2.13.5. Financials (Based on Availability)
- 16.2.1 Quest Diagnostics Incorporated
List of Figures
- Figure 1: Global Rare Diseases Industry Revenue Breakdown (Million, %) by Region 2024 & 2032
- Figure 2: Global Rare Diseases Industry Volume Breakdown (K Unit, %) by Region 2024 & 2032
- Figure 3: North America Rare Diseases Industry Revenue (Million), by Country 2024 & 2032
- Figure 4: North America Rare Diseases Industry Volume (K Unit), by Country 2024 & 2032
- Figure 5: North America Rare Diseases Industry Revenue Share (%), by Country 2024 & 2032
- Figure 6: North America Rare Diseases Industry Volume Share (%), by Country 2024 & 2032
- Figure 7: Europe Rare Diseases Industry Revenue (Million), by Country 2024 & 2032
- Figure 8: Europe Rare Diseases Industry Volume (K Unit), by Country 2024 & 2032
- Figure 9: Europe Rare Diseases Industry Revenue Share (%), by Country 2024 & 2032
- Figure 10: Europe Rare Diseases Industry Volume Share (%), by Country 2024 & 2032
- Figure 11: Asia Pacific Rare Diseases Industry Revenue (Million), by Country 2024 & 2032
- Figure 12: Asia Pacific Rare Diseases Industry Volume (K Unit), by Country 2024 & 2032
- Figure 13: Asia Pacific Rare Diseases Industry Revenue Share (%), by Country 2024 & 2032
- Figure 14: Asia Pacific Rare Diseases Industry Volume Share (%), by Country 2024 & 2032
- Figure 15: Middle East and Africa Rare Diseases Industry Revenue (Million), by Country 2024 & 2032
- Figure 16: Middle East and Africa Rare Diseases Industry Volume (K Unit), by Country 2024 & 2032
- Figure 17: Middle East and Africa Rare Diseases Industry Revenue Share (%), by Country 2024 & 2032
- Figure 18: Middle East and Africa Rare Diseases Industry Volume Share (%), by Country 2024 & 2032
- Figure 19: South America Rare Diseases Industry Revenue (Million), by Country 2024 & 2032
- Figure 20: South America Rare Diseases Industry Volume (K Unit), by Country 2024 & 2032
- Figure 21: South America Rare Diseases Industry Revenue Share (%), by Country 2024 & 2032
- Figure 22: South America Rare Diseases Industry Volume Share (%), by Country 2024 & 2032
- Figure 23: North America Rare Diseases Industry Revenue (Million), by Technology 2024 & 2032
- Figure 24: North America Rare Diseases Industry Volume (K Unit), by Technology 2024 & 2032
- Figure 25: North America Rare Diseases Industry Revenue Share (%), by Technology 2024 & 2032
- Figure 26: North America Rare Diseases Industry Volume Share (%), by Technology 2024 & 2032
- Figure 27: North America Rare Diseases Industry Revenue (Million), by Disease 2024 & 2032
- Figure 28: North America Rare Diseases Industry Volume (K Unit), by Disease 2024 & 2032
- Figure 29: North America Rare Diseases Industry Revenue Share (%), by Disease 2024 & 2032
- Figure 30: North America Rare Diseases Industry Volume Share (%), by Disease 2024 & 2032
- Figure 31: North America Rare Diseases Industry Revenue (Million), by Country 2024 & 2032
- Figure 32: North America Rare Diseases Industry Volume (K Unit), by Country 2024 & 2032
- Figure 33: North America Rare Diseases Industry Revenue Share (%), by Country 2024 & 2032
- Figure 34: North America Rare Diseases Industry Volume Share (%), by Country 2024 & 2032
- Figure 35: Europe Rare Diseases Industry Revenue (Million), by Technology 2024 & 2032
- Figure 36: Europe Rare Diseases Industry Volume (K Unit), by Technology 2024 & 2032
- Figure 37: Europe Rare Diseases Industry Revenue Share (%), by Technology 2024 & 2032
- Figure 38: Europe Rare Diseases Industry Volume Share (%), by Technology 2024 & 2032
- Figure 39: Europe Rare Diseases Industry Revenue (Million), by Disease 2024 & 2032
- Figure 40: Europe Rare Diseases Industry Volume (K Unit), by Disease 2024 & 2032
- Figure 41: Europe Rare Diseases Industry Revenue Share (%), by Disease 2024 & 2032
- Figure 42: Europe Rare Diseases Industry Volume Share (%), by Disease 2024 & 2032
- Figure 43: Europe Rare Diseases Industry Revenue (Million), by Country 2024 & 2032
- Figure 44: Europe Rare Diseases Industry Volume (K Unit), by Country 2024 & 2032
- Figure 45: Europe Rare Diseases Industry Revenue Share (%), by Country 2024 & 2032
- Figure 46: Europe Rare Diseases Industry Volume Share (%), by Country 2024 & 2032
- Figure 47: Asia Pacific Rare Diseases Industry Revenue (Million), by Technology 2024 & 2032
- Figure 48: Asia Pacific Rare Diseases Industry Volume (K Unit), by Technology 2024 & 2032
- Figure 49: Asia Pacific Rare Diseases Industry Revenue Share (%), by Technology 2024 & 2032
- Figure 50: Asia Pacific Rare Diseases Industry Volume Share (%), by Technology 2024 & 2032
- Figure 51: Asia Pacific Rare Diseases Industry Revenue (Million), by Disease 2024 & 2032
- Figure 52: Asia Pacific Rare Diseases Industry Volume (K Unit), by Disease 2024 & 2032
- Figure 53: Asia Pacific Rare Diseases Industry Revenue Share (%), by Disease 2024 & 2032
- Figure 54: Asia Pacific Rare Diseases Industry Volume Share (%), by Disease 2024 & 2032
- Figure 55: Asia Pacific Rare Diseases Industry Revenue (Million), by Country 2024 & 2032
- Figure 56: Asia Pacific Rare Diseases Industry Volume (K Unit), by Country 2024 & 2032
- Figure 57: Asia Pacific Rare Diseases Industry Revenue Share (%), by Country 2024 & 2032
- Figure 58: Asia Pacific Rare Diseases Industry Volume Share (%), by Country 2024 & 2032
- Figure 59: Middle East and Africa Rare Diseases Industry Revenue (Million), by Technology 2024 & 2032
- Figure 60: Middle East and Africa Rare Diseases Industry Volume (K Unit), by Technology 2024 & 2032
- Figure 61: Middle East and Africa Rare Diseases Industry Revenue Share (%), by Technology 2024 & 2032
- Figure 62: Middle East and Africa Rare Diseases Industry Volume Share (%), by Technology 2024 & 2032
- Figure 63: Middle East and Africa Rare Diseases Industry Revenue (Million), by Disease 2024 & 2032
- Figure 64: Middle East and Africa Rare Diseases Industry Volume (K Unit), by Disease 2024 & 2032
- Figure 65: Middle East and Africa Rare Diseases Industry Revenue Share (%), by Disease 2024 & 2032
- Figure 66: Middle East and Africa Rare Diseases Industry Volume Share (%), by Disease 2024 & 2032
- Figure 67: Middle East and Africa Rare Diseases Industry Revenue (Million), by Country 2024 & 2032
- Figure 68: Middle East and Africa Rare Diseases Industry Volume (K Unit), by Country 2024 & 2032
- Figure 69: Middle East and Africa Rare Diseases Industry Revenue Share (%), by Country 2024 & 2032
- Figure 70: Middle East and Africa Rare Diseases Industry Volume Share (%), by Country 2024 & 2032
- Figure 71: South America Rare Diseases Industry Revenue (Million), by Technology 2024 & 2032
- Figure 72: South America Rare Diseases Industry Volume (K Unit), by Technology 2024 & 2032
- Figure 73: South America Rare Diseases Industry Revenue Share (%), by Technology 2024 & 2032
- Figure 74: South America Rare Diseases Industry Volume Share (%), by Technology 2024 & 2032
- Figure 75: South America Rare Diseases Industry Revenue (Million), by Disease 2024 & 2032
- Figure 76: South America Rare Diseases Industry Volume (K Unit), by Disease 2024 & 2032
- Figure 77: South America Rare Diseases Industry Revenue Share (%), by Disease 2024 & 2032
- Figure 78: South America Rare Diseases Industry Volume Share (%), by Disease 2024 & 2032
- Figure 79: South America Rare Diseases Industry Revenue (Million), by Country 2024 & 2032
- Figure 80: South America Rare Diseases Industry Volume (K Unit), by Country 2024 & 2032
- Figure 81: South America Rare Diseases Industry Revenue Share (%), by Country 2024 & 2032
- Figure 82: South America Rare Diseases Industry Volume Share (%), by Country 2024 & 2032
List of Tables
- Table 1: Global Rare Diseases Industry Revenue Million Forecast, by Region 2019 & 2032
- Table 2: Global Rare Diseases Industry Volume K Unit Forecast, by Region 2019 & 2032
- Table 3: Global Rare Diseases Industry Revenue Million Forecast, by Technology 2019 & 2032
- Table 4: Global Rare Diseases Industry Volume K Unit Forecast, by Technology 2019 & 2032
- Table 5: Global Rare Diseases Industry Revenue Million Forecast, by Disease 2019 & 2032
- Table 6: Global Rare Diseases Industry Volume K Unit Forecast, by Disease 2019 & 2032
- Table 7: Global Rare Diseases Industry Revenue Million Forecast, by Region 2019 & 2032
- Table 8: Global Rare Diseases Industry Volume K Unit Forecast, by Region 2019 & 2032
- Table 9: Global Rare Diseases Industry Revenue Million Forecast, by Country 2019 & 2032
- Table 10: Global Rare Diseases Industry Volume K Unit Forecast, by Country 2019 & 2032
- Table 11: United States Rare Diseases Industry Revenue (Million) Forecast, by Application 2019 & 2032
- Table 12: United States Rare Diseases Industry Volume (K Unit) Forecast, by Application 2019 & 2032
- Table 13: Canada Rare Diseases Industry Revenue (Million) Forecast, by Application 2019 & 2032
- Table 14: Canada Rare Diseases Industry Volume (K Unit) Forecast, by Application 2019 & 2032
- Table 15: Mexico Rare Diseases Industry Revenue (Million) Forecast, by Application 2019 & 2032
- Table 16: Mexico Rare Diseases Industry Volume (K Unit) Forecast, by Application 2019 & 2032
- Table 17: Global Rare Diseases Industry Revenue Million Forecast, by Country 2019 & 2032
- Table 18: Global Rare Diseases Industry Volume K Unit Forecast, by Country 2019 & 2032
- Table 19: Germany Rare Diseases Industry Revenue (Million) Forecast, by Application 2019 & 2032
- Table 20: Germany Rare Diseases Industry Volume (K Unit) Forecast, by Application 2019 & 2032
- Table 21: United Kingdom Rare Diseases Industry Revenue (Million) Forecast, by Application 2019 & 2032
- Table 22: United Kingdom Rare Diseases Industry Volume (K Unit) Forecast, by Application 2019 & 2032
- Table 23: France Rare Diseases Industry Revenue (Million) Forecast, by Application 2019 & 2032
- Table 24: France Rare Diseases Industry Volume (K Unit) Forecast, by Application 2019 & 2032
- Table 25: Italy Rare Diseases Industry Revenue (Million) Forecast, by Application 2019 & 2032
- Table 26: Italy Rare Diseases Industry Volume (K Unit) Forecast, by Application 2019 & 2032
- Table 27: Spain Rare Diseases Industry Revenue (Million) Forecast, by Application 2019 & 2032
- Table 28: Spain Rare Diseases Industry Volume (K Unit) Forecast, by Application 2019 & 2032
- Table 29: Rest of Europe Rare Diseases Industry Revenue (Million) Forecast, by Application 2019 & 2032
- Table 30: Rest of Europe Rare Diseases Industry Volume (K Unit) Forecast, by Application 2019 & 2032
- Table 31: Global Rare Diseases Industry Revenue Million Forecast, by Country 2019 & 2032
- Table 32: Global Rare Diseases Industry Volume K Unit Forecast, by Country 2019 & 2032
- Table 33: China Rare Diseases Industry Revenue (Million) Forecast, by Application 2019 & 2032
- Table 34: China Rare Diseases Industry Volume (K Unit) Forecast, by Application 2019 & 2032
- Table 35: Japan Rare Diseases Industry Revenue (Million) Forecast, by Application 2019 & 2032
- Table 36: Japan Rare Diseases Industry Volume (K Unit) Forecast, by Application 2019 & 2032
- Table 37: India Rare Diseases Industry Revenue (Million) Forecast, by Application 2019 & 2032
- Table 38: India Rare Diseases Industry Volume (K Unit) Forecast, by Application 2019 & 2032
- Table 39: Australia Rare Diseases Industry Revenue (Million) Forecast, by Application 2019 & 2032
- Table 40: Australia Rare Diseases Industry Volume (K Unit) Forecast, by Application 2019 & 2032
- Table 41: South Korea Rare Diseases Industry Revenue (Million) Forecast, by Application 2019 & 2032
- Table 42: South Korea Rare Diseases Industry Volume (K Unit) Forecast, by Application 2019 & 2032
- Table 43: Rest of Asia Pacific Rare Diseases Industry Revenue (Million) Forecast, by Application 2019 & 2032
- Table 44: Rest of Asia Pacific Rare Diseases Industry Volume (K Unit) Forecast, by Application 2019 & 2032
- Table 45: Global Rare Diseases Industry Revenue Million Forecast, by Country 2019 & 2032
- Table 46: Global Rare Diseases Industry Volume K Unit Forecast, by Country 2019 & 2032
- Table 47: GCC Rare Diseases Industry Revenue (Million) Forecast, by Application 2019 & 2032
- Table 48: GCC Rare Diseases Industry Volume (K Unit) Forecast, by Application 2019 & 2032
- Table 49: South Africa Rare Diseases Industry Revenue (Million) Forecast, by Application 2019 & 2032
- Table 50: South Africa Rare Diseases Industry Volume (K Unit) Forecast, by Application 2019 & 2032
- Table 51: Rest of Middle East and Africa Rare Diseases Industry Revenue (Million) Forecast, by Application 2019 & 2032
- Table 52: Rest of Middle East and Africa Rare Diseases Industry Volume (K Unit) Forecast, by Application 2019 & 2032
- Table 53: Global Rare Diseases Industry Revenue Million Forecast, by Country 2019 & 2032
- Table 54: Global Rare Diseases Industry Volume K Unit Forecast, by Country 2019 & 2032
- Table 55: Brazil Rare Diseases Industry Revenue (Million) Forecast, by Application 2019 & 2032
- Table 56: Brazil Rare Diseases Industry Volume (K Unit) Forecast, by Application 2019 & 2032
- Table 57: Argentina Rare Diseases Industry Revenue (Million) Forecast, by Application 2019 & 2032
- Table 58: Argentina Rare Diseases Industry Volume (K Unit) Forecast, by Application 2019 & 2032
- Table 59: Rest of South America Rare Diseases Industry Revenue (Million) Forecast, by Application 2019 & 2032
- Table 60: Rest of South America Rare Diseases Industry Volume (K Unit) Forecast, by Application 2019 & 2032
- Table 61: Global Rare Diseases Industry Revenue Million Forecast, by Technology 2019 & 2032
- Table 62: Global Rare Diseases Industry Volume K Unit Forecast, by Technology 2019 & 2032
- Table 63: Global Rare Diseases Industry Revenue Million Forecast, by Disease 2019 & 2032
- Table 64: Global Rare Diseases Industry Volume K Unit Forecast, by Disease 2019 & 2032
- Table 65: Global Rare Diseases Industry Revenue Million Forecast, by Country 2019 & 2032
- Table 66: Global Rare Diseases Industry Volume K Unit Forecast, by Country 2019 & 2032
- Table 67: United States Rare Diseases Industry Revenue (Million) Forecast, by Application 2019 & 2032
- Table 68: United States Rare Diseases Industry Volume (K Unit) Forecast, by Application 2019 & 2032
- Table 69: Canada Rare Diseases Industry Revenue (Million) Forecast, by Application 2019 & 2032
- Table 70: Canada Rare Diseases Industry Volume (K Unit) Forecast, by Application 2019 & 2032
- Table 71: Mexico Rare Diseases Industry Revenue (Million) Forecast, by Application 2019 & 2032
- Table 72: Mexico Rare Diseases Industry Volume (K Unit) Forecast, by Application 2019 & 2032
- Table 73: Global Rare Diseases Industry Revenue Million Forecast, by Technology 2019 & 2032
- Table 74: Global Rare Diseases Industry Volume K Unit Forecast, by Technology 2019 & 2032
- Table 75: Global Rare Diseases Industry Revenue Million Forecast, by Disease 2019 & 2032
- Table 76: Global Rare Diseases Industry Volume K Unit Forecast, by Disease 2019 & 2032
- Table 77: Global Rare Diseases Industry Revenue Million Forecast, by Country 2019 & 2032
- Table 78: Global Rare Diseases Industry Volume K Unit Forecast, by Country 2019 & 2032
- Table 79: Germany Rare Diseases Industry Revenue (Million) Forecast, by Application 2019 & 2032
- Table 80: Germany Rare Diseases Industry Volume (K Unit) Forecast, by Application 2019 & 2032
- Table 81: United Kingdom Rare Diseases Industry Revenue (Million) Forecast, by Application 2019 & 2032
- Table 82: United Kingdom Rare Diseases Industry Volume (K Unit) Forecast, by Application 2019 & 2032
- Table 83: France Rare Diseases Industry Revenue (Million) Forecast, by Application 2019 & 2032
- Table 84: France Rare Diseases Industry Volume (K Unit) Forecast, by Application 2019 & 2032
- Table 85: Italy Rare Diseases Industry Revenue (Million) Forecast, by Application 2019 & 2032
- Table 86: Italy Rare Diseases Industry Volume (K Unit) Forecast, by Application 2019 & 2032
- Table 87: Spain Rare Diseases Industry Revenue (Million) Forecast, by Application 2019 & 2032
- Table 88: Spain Rare Diseases Industry Volume (K Unit) Forecast, by Application 2019 & 2032
- Table 89: Rest of Europe Rare Diseases Industry Revenue (Million) Forecast, by Application 2019 & 2032
- Table 90: Rest of Europe Rare Diseases Industry Volume (K Unit) Forecast, by Application 2019 & 2032
- Table 91: Global Rare Diseases Industry Revenue Million Forecast, by Technology 2019 & 2032
- Table 92: Global Rare Diseases Industry Volume K Unit Forecast, by Technology 2019 & 2032
- Table 93: Global Rare Diseases Industry Revenue Million Forecast, by Disease 2019 & 2032
- Table 94: Global Rare Diseases Industry Volume K Unit Forecast, by Disease 2019 & 2032
- Table 95: Global Rare Diseases Industry Revenue Million Forecast, by Country 2019 & 2032
- Table 96: Global Rare Diseases Industry Volume K Unit Forecast, by Country 2019 & 2032
- Table 97: China Rare Diseases Industry Revenue (Million) Forecast, by Application 2019 & 2032
- Table 98: China Rare Diseases Industry Volume (K Unit) Forecast, by Application 2019 & 2032
- Table 99: Japan Rare Diseases Industry Revenue (Million) Forecast, by Application 2019 & 2032
- Table 100: Japan Rare Diseases Industry Volume (K Unit) Forecast, by Application 2019 & 2032
- Table 101: India Rare Diseases Industry Revenue (Million) Forecast, by Application 2019 & 2032
- Table 102: India Rare Diseases Industry Volume (K Unit) Forecast, by Application 2019 & 2032
- Table 103: Australia Rare Diseases Industry Revenue (Million) Forecast, by Application 2019 & 2032
- Table 104: Australia Rare Diseases Industry Volume (K Unit) Forecast, by Application 2019 & 2032
- Table 105: South Korea Rare Diseases Industry Revenue (Million) Forecast, by Application 2019 & 2032
- Table 106: South Korea Rare Diseases Industry Volume (K Unit) Forecast, by Application 2019 & 2032
- Table 107: Rest of Asia Pacific Rare Diseases Industry Revenue (Million) Forecast, by Application 2019 & 2032
- Table 108: Rest of Asia Pacific Rare Diseases Industry Volume (K Unit) Forecast, by Application 2019 & 2032
- Table 109: Global Rare Diseases Industry Revenue Million Forecast, by Technology 2019 & 2032
- Table 110: Global Rare Diseases Industry Volume K Unit Forecast, by Technology 2019 & 2032
- Table 111: Global Rare Diseases Industry Revenue Million Forecast, by Disease 2019 & 2032
- Table 112: Global Rare Diseases Industry Volume K Unit Forecast, by Disease 2019 & 2032
- Table 113: Global Rare Diseases Industry Revenue Million Forecast, by Country 2019 & 2032
- Table 114: Global Rare Diseases Industry Volume K Unit Forecast, by Country 2019 & 2032
- Table 115: GCC Rare Diseases Industry Revenue (Million) Forecast, by Application 2019 & 2032
- Table 116: GCC Rare Diseases Industry Volume (K Unit) Forecast, by Application 2019 & 2032
- Table 117: South Africa Rare Diseases Industry Revenue (Million) Forecast, by Application 2019 & 2032
- Table 118: South Africa Rare Diseases Industry Volume (K Unit) Forecast, by Application 2019 & 2032
- Table 119: Rest of Middle East and Africa Rare Diseases Industry Revenue (Million) Forecast, by Application 2019 & 2032
- Table 120: Rest of Middle East and Africa Rare Diseases Industry Volume (K Unit) Forecast, by Application 2019 & 2032
- Table 121: Global Rare Diseases Industry Revenue Million Forecast, by Technology 2019 & 2032
- Table 122: Global Rare Diseases Industry Volume K Unit Forecast, by Technology 2019 & 2032
- Table 123: Global Rare Diseases Industry Revenue Million Forecast, by Disease 2019 & 2032
- Table 124: Global Rare Diseases Industry Volume K Unit Forecast, by Disease 2019 & 2032
- Table 125: Global Rare Diseases Industry Revenue Million Forecast, by Country 2019 & 2032
- Table 126: Global Rare Diseases Industry Volume K Unit Forecast, by Country 2019 & 2032
- Table 127: Brazil Rare Diseases Industry Revenue (Million) Forecast, by Application 2019 & 2032
- Table 128: Brazil Rare Diseases Industry Volume (K Unit) Forecast, by Application 2019 & 2032
- Table 129: Argentina Rare Diseases Industry Revenue (Million) Forecast, by Application 2019 & 2032
- Table 130: Argentina Rare Diseases Industry Volume (K Unit) Forecast, by Application 2019 & 2032
- Table 131: Rest of South America Rare Diseases Industry Revenue (Million) Forecast, by Application 2019 & 2032
- Table 132: Rest of South America Rare Diseases Industry Volume (K Unit) Forecast, by Application 2019 & 2032
Frequently Asked Questions
1. What is the projected Compound Annual Growth Rate (CAGR) of the Rare Diseases Industry?
The projected CAGR is approximately 14.23%.
2. Which companies are prominent players in the Rare Diseases Industry?
Key companies in the market include Quest Diagnostics Incorporated, Color Health Inc, Beijing Genomics Institute Ltd, Strand Life Sciences Private Limited, Invitae Corporation, Macrogen Inc, Ambry Genetics Corporations, Baylor Miraca Genetics Laboratories LLC, Centogene NV, ARUP Laboratories, Eurofins Scientific Inc, PerkinElmer Genetics Inc, 3billion Inc.
3. What are the main segments of the Rare Diseases Industry?
The market segments include Technology, Disease.
4. Can you provide details about the market size?
The market size is estimated to be USD 1.06 Million as of 2022.
5. What are some drivers contributing to market growth?
Expanding Patient Registry for Rare Disease; Development in Genetic Testing Technologies; Increased Government Initiatives for Rare Diseases.
6. What are the notable trends driving market growth?
Whole Exome Sequencing (WES) is Expected to Witness a Significant Growth During the Forecast Period.
7. Are there any restraints impacting market growth?
Lack of Awareness Regarding Rare Diseases; Technical Challenges Associated with Genetic Tests and Data Management.
8. Can you provide examples of recent developments in the market?
In September 2022, Predicine Inc. received the USFDA approval for PredicineCARE cfDNA Assay, an NGS assay device for tumor mutation profiling in cf-DNA.
9. What pricing options are available for accessing the report?
Pricing options include single-user, multi-user, and enterprise licenses priced at USD 4750, USD 5250, and USD 8750 respectively.
10. Is the market size provided in terms of value or volume?
The market size is provided in terms of value, measured in Million and volume, measured in K Unit.
11. Are there any specific market keywords associated with the report?
Yes, the market keyword associated with the report is "Rare Diseases Industry," which aids in identifying and referencing the specific market segment covered.
12. How do I determine which pricing option suits my needs best?
The pricing options vary based on user requirements and access needs. Individual users may opt for single-user licenses, while businesses requiring broader access may choose multi-user or enterprise licenses for cost-effective access to the report.
13. Are there any additional resources or data provided in the Rare Diseases Industry report?
While the report offers comprehensive insights, it's advisable to review the specific contents or supplementary materials provided to ascertain if additional resources or data are available.
14. How can I stay updated on further developments or reports in the Rare Diseases Industry?
To stay informed about further developments, trends, and reports in the Rare Diseases Industry, consider subscribing to industry newsletters, following relevant companies and organizations, or regularly checking reputable industry news sources and publications.
Methodology
Step 1 - Identification of Relevant Samples Size from Population Database


Step 2 - Approaches for Defining Global Market Size (Value, Volume* & Price*)

Note*: In applicable scenarios
Step 3 - Data Sources
Primary Research
- Web Analytics
- Survey Reports
- Research Institute
- Latest Research Reports
- Opinion Leaders
Secondary Research
- Annual Reports
- White Paper
- Latest Press Release
- Industry Association
- Paid Database
- Investor Presentations

Step 4 - Data Triangulation
Involves using different sources of information in order to increase the validity of a study
These sources are likely to be stakeholders in a program - participants, other researchers, program staff, other community members, and so on.
Then we put all data in single framework & apply various statistical tools to find out the dynamic on the market.
During the analysis stage, feedback from the stakeholder groups would be compared to determine areas of agreement as well as areas of divergence


