
Key Insights
The global immunoassay market is experiencing robust growth, driven by several key factors. The increasing prevalence of chronic diseases like diabetes and cardiovascular conditions necessitates frequent diagnostic testing, fueling demand for immunoassays. Technological advancements, particularly in automation and miniaturization, are enhancing the speed, accuracy, and efficiency of these assays, leading to wider adoption across various healthcare settings. Furthermore, the rising focus on personalized medicine and point-of-care diagnostics is creating new opportunities for innovative immunoassay platforms. The market is segmented by type (Radioimmunoassay, Enzyme Immunoassays, Fluoroimmunoassay, Chemiluminescence Immunoassay, and Others), application (Disease Diagnosis, Therapeutic Drug Monitoring, Drug Discovery, Clinical Chemistry, Hematology, and Others), and end-user (Hospitals, Pharma & Biotech Companies, Clinical Laboratories, and Others). The significant presence of established players like Abbott Laboratories, Roche, and Thermo Fisher Scientific, along with emerging companies offering innovative solutions, ensures a dynamic and competitive landscape. While regulatory hurdles and high initial investment costs pose some restraints, the overall market outlook remains positive, projecting substantial growth over the forecast period.
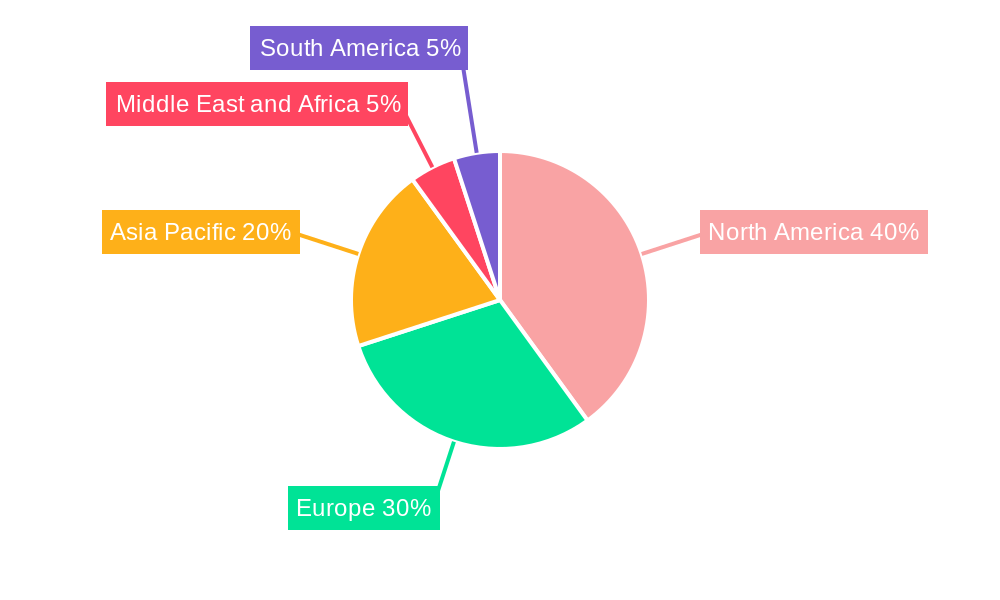
The North American region currently holds a significant market share, attributed to advanced healthcare infrastructure, high disposable incomes, and increased awareness about preventive healthcare. However, the Asia-Pacific region is anticipated to witness the fastest growth rate due to rising healthcare expenditure, expanding healthcare infrastructure, and a large, aging population. Europe maintains a substantial market presence due to robust healthcare systems and stringent regulatory frameworks. The continued development of multiplex immunoassays, offering simultaneous detection of multiple analytes, is a key trend shaping the market. Moreover, the integration of immunoassay technologies with advanced data analytics and artificial intelligence is paving the way for more accurate and personalized diagnostic solutions, thereby further propelling market expansion. The strategic partnerships and collaborations between diagnostic companies and pharmaceutical firms are expected to enhance the market's growth trajectory.
Immunoassay Industry Market Report: 2019-2033
This comprehensive report provides a detailed analysis of the Immunoassay industry, encompassing market size, growth projections, competitive landscape, and key trends from 2019 to 2033. The report covers various immunoassay types, applications, and end-users, offering actionable insights for businesses operating within this dynamic sector. The study period covers 2019-2033, with a base year of 2025 and a forecast period of 2025-2033. The historical period analyzed is 2019-2024. The global immunoassay market is expected to reach xx Million by 2033.
Immunoassay Industry Market Structure & Competitive Dynamics
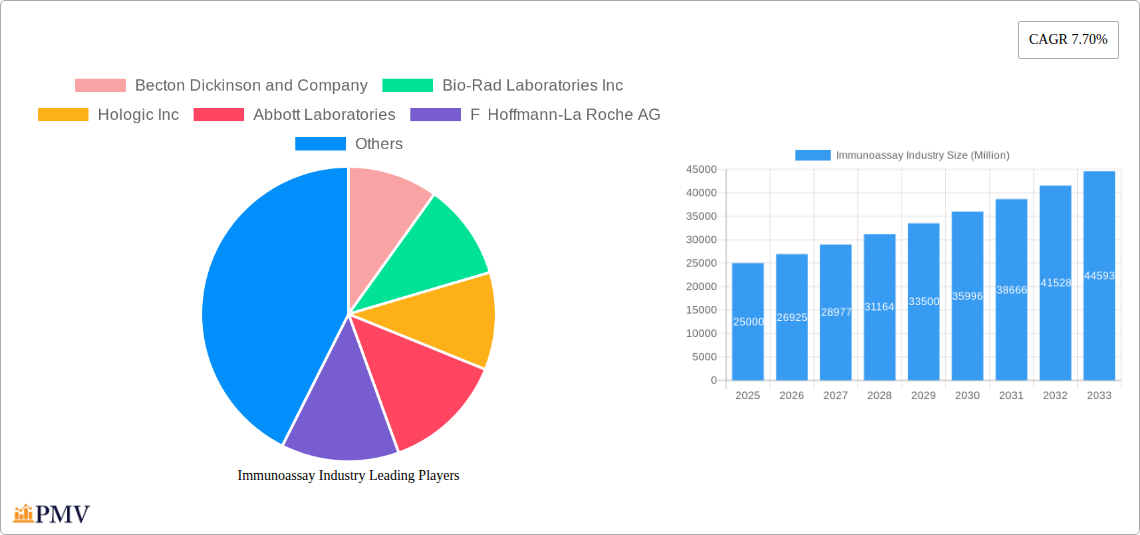
The immunoassay market is characterized by a moderately consolidated structure with several major players dominating the landscape. Key players such as Becton Dickinson and Company, Bio-Rad Laboratories Inc., Hologic Inc., Abbott Laboratories, F. Hoffmann-La Roche AG, and Thermo Fisher Scientific hold significant market share, driven by their extensive product portfolios, strong research & development capabilities, and global distribution networks. The market concentration ratio (CR5) is estimated at xx%, indicating a moderately competitive environment. However, the presence of numerous smaller players, particularly in niche segments, introduces a degree of fragmentation.
Innovation ecosystems are thriving, fueled by advancements in technologies like chemiluminescence and microfluidics. Regulatory frameworks, including those of the FDA and EMA, play a crucial role in shaping market dynamics by governing product approvals and clinical validation. Product substitutes, such as molecular diagnostics, present a competitive threat, particularly in specific applications. End-user trends, such as increasing adoption of point-of-care diagnostics and personalized medicine, are influencing market demand. M&A activities have been significant, with deal values totaling xx Million in the past five years, primarily driven by companies seeking to expand their product portfolios and geographic reach. Examples include [Specific examples of recent M&A activity with deal values if available, otherwise state “Examples unavailable due to data limitations”].
Immunoassay Industry Trends & Insights
The immunoassay market is experiencing robust growth, driven by several key factors. The rising prevalence of chronic diseases such as diabetes, cardiovascular diseases, and infectious diseases is a major driver of demand for diagnostic immunoassays. Technological advancements, particularly in automation, miniaturization, and multiplexing, are enhancing the efficiency, accuracy, and affordability of immunoassays. Furthermore, the increasing adoption of personalized medicine is fueling demand for tailored immunoassays that provide targeted information for individualized treatment strategies. The market is also witnessing the rise of point-of-care testing (POCT) devices, which allow for rapid diagnostics at the patient's bedside or in remote settings. This trend is driven by the need for faster diagnosis and improved patient outcomes.
The market is expected to register a compound annual growth rate (CAGR) of xx% during the forecast period (2025-2033). Market penetration for specific immunoassay types, such as CLIA and FIA, is expected to increase significantly, driven by their superior sensitivity and specificity. Competitive dynamics are intense, with companies focusing on product innovation, strategic partnerships, and geographic expansion to maintain market share. The growing demand for high-throughput automated systems in high-volume clinical laboratories is another factor contributing to market growth. Furthermore, the increasing adoption of digital technologies such as artificial intelligence (AI) and machine learning (ML) is expected to transform the immunoassay market in the coming years, enabling better diagnostics and improved patient care. Market penetration in developing economies is expected to increase significantly, driven by improvements in healthcare infrastructure and rising awareness of the importance of disease prevention.
Dominant Markets & Segments in Immunoassay Industry
The North American region currently dominates the global immunoassay market, driven by strong healthcare infrastructure, high disease prevalence, and high adoption of advanced diagnostic technologies. Within North America, the United States holds the largest market share. Europe follows as the second-largest market, with strong growth expected in emerging economies within the region. Asia-Pacific is projected to experience the fastest growth rate during the forecast period, fueled by increasing healthcare spending, rising prevalence of chronic diseases, and expanding healthcare infrastructure.
- Leading Segments:
- By Type: Chemiluminescence Immunoassay (CLIA) is the fastest-growing segment due to its high sensitivity and versatility. Enzyme Immunoassays (EIA) maintain a significant market share due to their established presence and cost-effectiveness.
- By Application: Disease diagnosis holds the largest market share due to the wide range of applications across various diseases. Therapeutic drug monitoring is also a significant segment, driven by increasing personalized medicine approaches.
- By End-User: Hospitals and clinical laboratories represent the largest end-user segment due to their high testing volumes. The pharma & biotech companies segment is growing rapidly, driven by increased demand for drug discovery and development.
The dominance of these segments is driven by several factors, including increased healthcare spending, rising prevalence of chronic diseases, and technological advancements leading to improved diagnostic accuracy and cost-effectiveness. Strong regulatory frameworks and robust healthcare infrastructure also play a crucial role. Economic policies promoting healthcare access and affordability further drive market growth in developed and developing economies.
Immunoassay Industry Product Innovations
Recent product innovations in the immunoassay industry have focused on improving assay sensitivity, speed, and automation. The development of multiplexed assays that can detect multiple analytes simultaneously has significantly enhanced diagnostic capabilities. Advancements in microfluidic technology have enabled the creation of miniaturized, portable immunoassay devices suitable for point-of-care testing. These innovations are improving diagnostic access in remote areas and reducing turnaround times for results. The integration of artificial intelligence (AI) and machine learning (ML) algorithms is enhancing data analysis and improving diagnostic accuracy. These innovations cater to growing market demand for faster, more accurate, and convenient diagnostic tools.
Report Segmentation & Scope
This report segments the immunoassay market based on type (Radioimmunoassay (RIA), Enzyme Immunoassays (EIA), Fluoroimmunoassay (FIA), Chemiluminescence Immunoassay (CLIA), Others), application (Disease Diagnosis, Therapeutic Drug Monitoring, Drug Discovery, Clinical Chemistry, Hematology, Others), and end-user (Hospitals, Pharma & Biotech Companies, Clinical Laboratories, Others). Each segment's growth projections, market size, and competitive dynamics are analyzed in detail. For example, the CLIA segment is projected to experience significant growth due to its high sensitivity and automation capabilities, while the disease diagnosis application segment holds the largest market share due to the wide range of diseases it covers. The hospital end-user segment is expected to maintain its dominance due to high testing volumes.
Key Drivers of Immunoassay Industry Growth
Several factors are driving the growth of the immunoassay industry. Technological advancements, such as the development of highly sensitive and specific assays and automated platforms, are enhancing diagnostic capabilities and efficiency. The increasing prevalence of chronic diseases worldwide is creating a greater demand for diagnostic testing. Furthermore, government initiatives promoting healthcare access and improved diagnostic infrastructure are stimulating market growth. Rising healthcare expenditure, particularly in emerging economies, is also boosting the market. Stringent regulatory requirements are promoting the development of high-quality, reliable immunoassay products.
Challenges in the Immunoassay Industry Sector
The immunoassay industry faces several challenges, including stringent regulatory requirements that can increase development costs and time-to-market. Supply chain disruptions and fluctuations in raw material prices can impact production costs and profitability. Intense competition among established players and emerging companies puts pressure on pricing and necessitates continuous innovation. The high cost of some advanced immunoassay technologies can limit their accessibility in certain regions, particularly in resource-limited settings.
Leading Players in the Immunoassay Industry Market
- Becton Dickinson and Company
- Bio-Rad Laboratories Inc
- Hologic Inc
- Abbott Laboratories
- F Hoffmann-La Roche AG
- Agilent Technologies Inc
- Danaher Corporation (Beckman Coulter Inc)
- Qiagen NV
- Sysmex Corporation
- Thermo Fisher Scientific
- Luminex Corporation
- PerkinElmer Inc
Key Developments in Immunoassay Industry Sector
- November 2022: Getein launched the MAGICL 6000 CLIA analyzer at MEDICA 2022. This launch expands the availability of compact, high-throughput CLIA analyzers, potentially impacting the mid-to-high workflow laboratory market segment.
- November 2022: LumiraDx launched a rapid microfluidic immunoassay HbA1c test in Europe, parts of the Middle East, Asia, Latin America, and Africa. This launch expands access to rapid HbA1c testing in diverse geographical regions, potentially impacting the point-of-care testing market.
Strategic Immunoassay Industry Market Outlook
The immunoassay market is poised for continued growth, driven by technological innovation, increasing disease prevalence, and expanding healthcare infrastructure. Strategic opportunities exist for companies focusing on point-of-care diagnostics, personalized medicine, and the development of novel immunoassay technologies. The integration of artificial intelligence and machine learning is expected to further enhance diagnostic accuracy and efficiency. Companies that invest in research and development, strategic partnerships, and global expansion are well-positioned to capture significant market share in the coming years. The growing demand for cost-effective and accessible diagnostic solutions presents considerable opportunities for players focusing on emerging markets.
Immunoassay Industry Segmentation
-
1. Type
- 1.1. Radioimmunoassay (RIA)
- 1.2. Enzyme Immunoassays (EIA)
- 1.3. Fluoroimmnoassay (FIA)
- 1.4. Chemiluminescence Immunoassay (CLIA)
- 1.5. Others
-
2. Application
- 2.1. Disease Diagnosis
- 2.2. Therapeutic Drug Monitoring
- 2.3. Drug Discovery
- 2.4. Clinical Chemistry
- 2.5. Hematology
- 2.6. Others
-
3. End User
- 3.1. Hospitals
- 3.2. Pharma & Biotech Companies
- 3.3. Clinical Laboratories
- 3.4. Others
Immunoassay Industry Segmentation By Geography
-
1. North America
- 1.1. United States
- 1.2. Canada
- 1.3. Mexico
-
2. Europe
- 2.1. Germany
- 2.2. United Kingdom
- 2.3. France
- 2.4. Italy
- 2.5. Spain
- 2.6. Rest of Europe
-
3. Asia Pacific
- 3.1. China
- 3.2. Japan
- 3.3. India
- 3.4. Australia
- 3.5. South Korea
- 3.6. Rest of Asia Pacific
-
4. Middle East and Africa
- 4.1. GCC
- 4.2. South Africa
- 4.3. Rest of Middle East and Africa
-
5. South America
- 5.1. Brazil
- 5.2. Argentina
- 5.3. Rest of South America
Immunoassay Industry REPORT HIGHLIGHTS
| Aspects | Details |
|---|---|
| Study Period | 2019-2033 |
| Base Year | 2024 |
| Estimated Year | 2025 |
| Forecast Period | 2025-2033 |
| Historical Period | 2019-2024 |
| Growth Rate | CAGR of 7.70% from 2019-2033 |
| Segmentation |
|
Table of Contents
- 1. Introduction
- 1.1. Research Scope
- 1.2. Market Segmentation
- 1.3. Research Methodology
- 1.4. Definitions and Assumptions
- 2. Executive Summary
- 2.1. Introduction
- 3. Market Dynamics
- 3.1. Introduction
- 3.2. Market Drivers
- 3.2.1. High Sensitivity and Specificity of Immunoassays; Technological Advancements in Immunoassay Instruments; Increasing Prevalence of Chronic and Infectious Diseases
- 3.3. Market Restrains
- 3.3.1. Stringent Regulatory Scenario for Approval of Immunoassays; Complexity of Procedures
- 3.4. Market Trends
- 3.4.1. Enzyme Immunoassays (EIA) Segment is Expected to Hold Significant Market Share in Immunoassay Market
- 4. Market Factor Analysis
- 4.1. Porters Five Forces
- 4.2. Supply/Value Chain
- 4.3. PESTEL analysis
- 4.4. Market Entropy
- 4.5. Patent/Trademark Analysis
- 5. Global Immunoassay Industry Analysis, Insights and Forecast, 2019-2031
- 5.1. Market Analysis, Insights and Forecast - by Type
- 5.1.1. Radioimmunoassay (RIA)
- 5.1.2. Enzyme Immunoassays (EIA)
- 5.1.3. Fluoroimmnoassay (FIA)
- 5.1.4. Chemiluminescence Immunoassay (CLIA)
- 5.1.5. Others
- 5.2. Market Analysis, Insights and Forecast - by Application
- 5.2.1. Disease Diagnosis
- 5.2.2. Therapeutic Drug Monitoring
- 5.2.3. Drug Discovery
- 5.2.4. Clinical Chemistry
- 5.2.5. Hematology
- 5.2.6. Others
- 5.3. Market Analysis, Insights and Forecast - by End User
- 5.3.1. Hospitals
- 5.3.2. Pharma & Biotech Companies
- 5.3.3. Clinical Laboratories
- 5.3.4. Others
- 5.4. Market Analysis, Insights and Forecast - by Region
- 5.4.1. North America
- 5.4.2. Europe
- 5.4.3. Asia Pacific
- 5.4.4. Middle East and Africa
- 5.4.5. South America
- 5.1. Market Analysis, Insights and Forecast - by Type
- 6. North America Immunoassay Industry Analysis, Insights and Forecast, 2019-2031
- 6.1. Market Analysis, Insights and Forecast - by Type
- 6.1.1. Radioimmunoassay (RIA)
- 6.1.2. Enzyme Immunoassays (EIA)
- 6.1.3. Fluoroimmnoassay (FIA)
- 6.1.4. Chemiluminescence Immunoassay (CLIA)
- 6.1.5. Others
- 6.2. Market Analysis, Insights and Forecast - by Application
- 6.2.1. Disease Diagnosis
- 6.2.2. Therapeutic Drug Monitoring
- 6.2.3. Drug Discovery
- 6.2.4. Clinical Chemistry
- 6.2.5. Hematology
- 6.2.6. Others
- 6.3. Market Analysis, Insights and Forecast - by End User
- 6.3.1. Hospitals
- 6.3.2. Pharma & Biotech Companies
- 6.3.3. Clinical Laboratories
- 6.3.4. Others
- 6.1. Market Analysis, Insights and Forecast - by Type
- 7. Europe Immunoassay Industry Analysis, Insights and Forecast, 2019-2031
- 7.1. Market Analysis, Insights and Forecast - by Type
- 7.1.1. Radioimmunoassay (RIA)
- 7.1.2. Enzyme Immunoassays (EIA)
- 7.1.3. Fluoroimmnoassay (FIA)
- 7.1.4. Chemiluminescence Immunoassay (CLIA)
- 7.1.5. Others
- 7.2. Market Analysis, Insights and Forecast - by Application
- 7.2.1. Disease Diagnosis
- 7.2.2. Therapeutic Drug Monitoring
- 7.2.3. Drug Discovery
- 7.2.4. Clinical Chemistry
- 7.2.5. Hematology
- 7.2.6. Others
- 7.3. Market Analysis, Insights and Forecast - by End User
- 7.3.1. Hospitals
- 7.3.2. Pharma & Biotech Companies
- 7.3.3. Clinical Laboratories
- 7.3.4. Others
- 7.1. Market Analysis, Insights and Forecast - by Type
- 8. Asia Pacific Immunoassay Industry Analysis, Insights and Forecast, 2019-2031
- 8.1. Market Analysis, Insights and Forecast - by Type
- 8.1.1. Radioimmunoassay (RIA)
- 8.1.2. Enzyme Immunoassays (EIA)
- 8.1.3. Fluoroimmnoassay (FIA)
- 8.1.4. Chemiluminescence Immunoassay (CLIA)
- 8.1.5. Others
- 8.2. Market Analysis, Insights and Forecast - by Application
- 8.2.1. Disease Diagnosis
- 8.2.2. Therapeutic Drug Monitoring
- 8.2.3. Drug Discovery
- 8.2.4. Clinical Chemistry
- 8.2.5. Hematology
- 8.2.6. Others
- 8.3. Market Analysis, Insights and Forecast - by End User
- 8.3.1. Hospitals
- 8.3.2. Pharma & Biotech Companies
- 8.3.3. Clinical Laboratories
- 8.3.4. Others
- 8.1. Market Analysis, Insights and Forecast - by Type
- 9. Middle East and Africa Immunoassay Industry Analysis, Insights and Forecast, 2019-2031
- 9.1. Market Analysis, Insights and Forecast - by Type
- 9.1.1. Radioimmunoassay (RIA)
- 9.1.2. Enzyme Immunoassays (EIA)
- 9.1.3. Fluoroimmnoassay (FIA)
- 9.1.4. Chemiluminescence Immunoassay (CLIA)
- 9.1.5. Others
- 9.2. Market Analysis, Insights and Forecast - by Application
- 9.2.1. Disease Diagnosis
- 9.2.2. Therapeutic Drug Monitoring
- 9.2.3. Drug Discovery
- 9.2.4. Clinical Chemistry
- 9.2.5. Hematology
- 9.2.6. Others
- 9.3. Market Analysis, Insights and Forecast - by End User
- 9.3.1. Hospitals
- 9.3.2. Pharma & Biotech Companies
- 9.3.3. Clinical Laboratories
- 9.3.4. Others
- 9.1. Market Analysis, Insights and Forecast - by Type
- 10. South America Immunoassay Industry Analysis, Insights and Forecast, 2019-2031
- 10.1. Market Analysis, Insights and Forecast - by Type
- 10.1.1. Radioimmunoassay (RIA)
- 10.1.2. Enzyme Immunoassays (EIA)
- 10.1.3. Fluoroimmnoassay (FIA)
- 10.1.4. Chemiluminescence Immunoassay (CLIA)
- 10.1.5. Others
- 10.2. Market Analysis, Insights and Forecast - by Application
- 10.2.1. Disease Diagnosis
- 10.2.2. Therapeutic Drug Monitoring
- 10.2.3. Drug Discovery
- 10.2.4. Clinical Chemistry
- 10.2.5. Hematology
- 10.2.6. Others
- 10.3. Market Analysis, Insights and Forecast - by End User
- 10.3.1. Hospitals
- 10.3.2. Pharma & Biotech Companies
- 10.3.3. Clinical Laboratories
- 10.3.4. Others
- 10.1. Market Analysis, Insights and Forecast - by Type
- 11. North America Immunoassay Industry Analysis, Insights and Forecast, 2019-2031
- 11.1. Market Analysis, Insights and Forecast - By Country/Sub-region
- 11.1.1 United States
- 11.1.2 Canada
- 11.1.3 Mexico
- 12. Europe Immunoassay Industry Analysis, Insights and Forecast, 2019-2031
- 12.1. Market Analysis, Insights and Forecast - By Country/Sub-region
- 12.1.1 Germany
- 12.1.2 United Kingdom
- 12.1.3 France
- 12.1.4 Italy
- 12.1.5 Spain
- 12.1.6 Rest of Europe
- 13. Asia Pacific Immunoassay Industry Analysis, Insights and Forecast, 2019-2031
- 13.1. Market Analysis, Insights and Forecast - By Country/Sub-region
- 13.1.1 China
- 13.1.2 Japan
- 13.1.3 India
- 13.1.4 Australia
- 13.1.5 South Korea
- 13.1.6 Rest of Asia Pacific
- 14. Middle East and Africa Immunoassay Industry Analysis, Insights and Forecast, 2019-2031
- 14.1. Market Analysis, Insights and Forecast - By Country/Sub-region
- 14.1.1 GCC
- 14.1.2 South Africa
- 14.1.3 Rest of Middle East and Africa
- 15. South America Immunoassay Industry Analysis, Insights and Forecast, 2019-2031
- 15.1. Market Analysis, Insights and Forecast - By Country/Sub-region
- 15.1.1 Brazil
- 15.1.2 Argentina
- 15.1.3 Rest of South America
- 16. Competitive Analysis
- 16.1. Global Market Share Analysis 2024
- 16.2. Company Profiles
- 16.2.1 Becton Dickinson and Company
- 16.2.1.1. Overview
- 16.2.1.2. Products
- 16.2.1.3. SWOT Analysis
- 16.2.1.4. Recent Developments
- 16.2.1.5. Financials (Based on Availability)
- 16.2.2 Bio-Rad Laboratories Inc
- 16.2.2.1. Overview
- 16.2.2.2. Products
- 16.2.2.3. SWOT Analysis
- 16.2.2.4. Recent Developments
- 16.2.2.5. Financials (Based on Availability)
- 16.2.3 Hologic Inc
- 16.2.3.1. Overview
- 16.2.3.2. Products
- 16.2.3.3. SWOT Analysis
- 16.2.3.4. Recent Developments
- 16.2.3.5. Financials (Based on Availability)
- 16.2.4 Abbott Laboratories
- 16.2.4.1. Overview
- 16.2.4.2. Products
- 16.2.4.3. SWOT Analysis
- 16.2.4.4. Recent Developments
- 16.2.4.5. Financials (Based on Availability)
- 16.2.5 F Hoffmann-La Roche AG
- 16.2.5.1. Overview
- 16.2.5.2. Products
- 16.2.5.3. SWOT Analysis
- 16.2.5.4. Recent Developments
- 16.2.5.5. Financials (Based on Availability)
- 16.2.6 Agilent Technologies Inc
- 16.2.6.1. Overview
- 16.2.6.2. Products
- 16.2.6.3. SWOT Analysis
- 16.2.6.4. Recent Developments
- 16.2.6.5. Financials (Based on Availability)
- 16.2.7 Danaher Corporation (Beckman Coulter Inc)
- 16.2.7.1. Overview
- 16.2.7.2. Products
- 16.2.7.3. SWOT Analysis
- 16.2.7.4. Recent Developments
- 16.2.7.5. Financials (Based on Availability)
- 16.2.8 Qiagen NV
- 16.2.8.1. Overview
- 16.2.8.2. Products
- 16.2.8.3. SWOT Analysis
- 16.2.8.4. Recent Developments
- 16.2.8.5. Financials (Based on Availability)
- 16.2.9 Sysmex Corporation
- 16.2.9.1. Overview
- 16.2.9.2. Products
- 16.2.9.3. SWOT Analysis
- 16.2.9.4. Recent Developments
- 16.2.9.5. Financials (Based on Availability)
- 16.2.10 Thermo Fisher Scientific
- 16.2.10.1. Overview
- 16.2.10.2. Products
- 16.2.10.3. SWOT Analysis
- 16.2.10.4. Recent Developments
- 16.2.10.5. Financials (Based on Availability)
- 16.2.11 Luminex Corporation
- 16.2.11.1. Overview
- 16.2.11.2. Products
- 16.2.11.3. SWOT Analysis
- 16.2.11.4. Recent Developments
- 16.2.11.5. Financials (Based on Availability)
- 16.2.12 PerkinElmer Inc
- 16.2.12.1. Overview
- 16.2.12.2. Products
- 16.2.12.3. SWOT Analysis
- 16.2.12.4. Recent Developments
- 16.2.12.5. Financials (Based on Availability)
- 16.2.1 Becton Dickinson and Company
List of Figures
- Figure 1: Global Immunoassay Industry Revenue Breakdown (Million, %) by Region 2024 & 2032
- Figure 2: Global Immunoassay Industry Volume Breakdown (K Unit, %) by Region 2024 & 2032
- Figure 3: North America Immunoassay Industry Revenue (Million), by Country 2024 & 2032
- Figure 4: North America Immunoassay Industry Volume (K Unit), by Country 2024 & 2032
- Figure 5: North America Immunoassay Industry Revenue Share (%), by Country 2024 & 2032
- Figure 6: North America Immunoassay Industry Volume Share (%), by Country 2024 & 2032
- Figure 7: Europe Immunoassay Industry Revenue (Million), by Country 2024 & 2032
- Figure 8: Europe Immunoassay Industry Volume (K Unit), by Country 2024 & 2032
- Figure 9: Europe Immunoassay Industry Revenue Share (%), by Country 2024 & 2032
- Figure 10: Europe Immunoassay Industry Volume Share (%), by Country 2024 & 2032
- Figure 11: Asia Pacific Immunoassay Industry Revenue (Million), by Country 2024 & 2032
- Figure 12: Asia Pacific Immunoassay Industry Volume (K Unit), by Country 2024 & 2032
- Figure 13: Asia Pacific Immunoassay Industry Revenue Share (%), by Country 2024 & 2032
- Figure 14: Asia Pacific Immunoassay Industry Volume Share (%), by Country 2024 & 2032
- Figure 15: Middle East and Africa Immunoassay Industry Revenue (Million), by Country 2024 & 2032
- Figure 16: Middle East and Africa Immunoassay Industry Volume (K Unit), by Country 2024 & 2032
- Figure 17: Middle East and Africa Immunoassay Industry Revenue Share (%), by Country 2024 & 2032
- Figure 18: Middle East and Africa Immunoassay Industry Volume Share (%), by Country 2024 & 2032
- Figure 19: South America Immunoassay Industry Revenue (Million), by Country 2024 & 2032
- Figure 20: South America Immunoassay Industry Volume (K Unit), by Country 2024 & 2032
- Figure 21: South America Immunoassay Industry Revenue Share (%), by Country 2024 & 2032
- Figure 22: South America Immunoassay Industry Volume Share (%), by Country 2024 & 2032
- Figure 23: North America Immunoassay Industry Revenue (Million), by Type 2024 & 2032
- Figure 24: North America Immunoassay Industry Volume (K Unit), by Type 2024 & 2032
- Figure 25: North America Immunoassay Industry Revenue Share (%), by Type 2024 & 2032
- Figure 26: North America Immunoassay Industry Volume Share (%), by Type 2024 & 2032
- Figure 27: North America Immunoassay Industry Revenue (Million), by Application 2024 & 2032
- Figure 28: North America Immunoassay Industry Volume (K Unit), by Application 2024 & 2032
- Figure 29: North America Immunoassay Industry Revenue Share (%), by Application 2024 & 2032
- Figure 30: North America Immunoassay Industry Volume Share (%), by Application 2024 & 2032
- Figure 31: North America Immunoassay Industry Revenue (Million), by End User 2024 & 2032
- Figure 32: North America Immunoassay Industry Volume (K Unit), by End User 2024 & 2032
- Figure 33: North America Immunoassay Industry Revenue Share (%), by End User 2024 & 2032
- Figure 34: North America Immunoassay Industry Volume Share (%), by End User 2024 & 2032
- Figure 35: North America Immunoassay Industry Revenue (Million), by Country 2024 & 2032
- Figure 36: North America Immunoassay Industry Volume (K Unit), by Country 2024 & 2032
- Figure 37: North America Immunoassay Industry Revenue Share (%), by Country 2024 & 2032
- Figure 38: North America Immunoassay Industry Volume Share (%), by Country 2024 & 2032
- Figure 39: Europe Immunoassay Industry Revenue (Million), by Type 2024 & 2032
- Figure 40: Europe Immunoassay Industry Volume (K Unit), by Type 2024 & 2032
- Figure 41: Europe Immunoassay Industry Revenue Share (%), by Type 2024 & 2032
- Figure 42: Europe Immunoassay Industry Volume Share (%), by Type 2024 & 2032
- Figure 43: Europe Immunoassay Industry Revenue (Million), by Application 2024 & 2032
- Figure 44: Europe Immunoassay Industry Volume (K Unit), by Application 2024 & 2032
- Figure 45: Europe Immunoassay Industry Revenue Share (%), by Application 2024 & 2032
- Figure 46: Europe Immunoassay Industry Volume Share (%), by Application 2024 & 2032
- Figure 47: Europe Immunoassay Industry Revenue (Million), by End User 2024 & 2032
- Figure 48: Europe Immunoassay Industry Volume (K Unit), by End User 2024 & 2032
- Figure 49: Europe Immunoassay Industry Revenue Share (%), by End User 2024 & 2032
- Figure 50: Europe Immunoassay Industry Volume Share (%), by End User 2024 & 2032
- Figure 51: Europe Immunoassay Industry Revenue (Million), by Country 2024 & 2032
- Figure 52: Europe Immunoassay Industry Volume (K Unit), by Country 2024 & 2032
- Figure 53: Europe Immunoassay Industry Revenue Share (%), by Country 2024 & 2032
- Figure 54: Europe Immunoassay Industry Volume Share (%), by Country 2024 & 2032
- Figure 55: Asia Pacific Immunoassay Industry Revenue (Million), by Type 2024 & 2032
- Figure 56: Asia Pacific Immunoassay Industry Volume (K Unit), by Type 2024 & 2032
- Figure 57: Asia Pacific Immunoassay Industry Revenue Share (%), by Type 2024 & 2032
- Figure 58: Asia Pacific Immunoassay Industry Volume Share (%), by Type 2024 & 2032
- Figure 59: Asia Pacific Immunoassay Industry Revenue (Million), by Application 2024 & 2032
- Figure 60: Asia Pacific Immunoassay Industry Volume (K Unit), by Application 2024 & 2032
- Figure 61: Asia Pacific Immunoassay Industry Revenue Share (%), by Application 2024 & 2032
- Figure 62: Asia Pacific Immunoassay Industry Volume Share (%), by Application 2024 & 2032
- Figure 63: Asia Pacific Immunoassay Industry Revenue (Million), by End User 2024 & 2032
- Figure 64: Asia Pacific Immunoassay Industry Volume (K Unit), by End User 2024 & 2032
- Figure 65: Asia Pacific Immunoassay Industry Revenue Share (%), by End User 2024 & 2032
- Figure 66: Asia Pacific Immunoassay Industry Volume Share (%), by End User 2024 & 2032
- Figure 67: Asia Pacific Immunoassay Industry Revenue (Million), by Country 2024 & 2032
- Figure 68: Asia Pacific Immunoassay Industry Volume (K Unit), by Country 2024 & 2032
- Figure 69: Asia Pacific Immunoassay Industry Revenue Share (%), by Country 2024 & 2032
- Figure 70: Asia Pacific Immunoassay Industry Volume Share (%), by Country 2024 & 2032
- Figure 71: Middle East and Africa Immunoassay Industry Revenue (Million), by Type 2024 & 2032
- Figure 72: Middle East and Africa Immunoassay Industry Volume (K Unit), by Type 2024 & 2032
- Figure 73: Middle East and Africa Immunoassay Industry Revenue Share (%), by Type 2024 & 2032
- Figure 74: Middle East and Africa Immunoassay Industry Volume Share (%), by Type 2024 & 2032
- Figure 75: Middle East and Africa Immunoassay Industry Revenue (Million), by Application 2024 & 2032
- Figure 76: Middle East and Africa Immunoassay Industry Volume (K Unit), by Application 2024 & 2032
- Figure 77: Middle East and Africa Immunoassay Industry Revenue Share (%), by Application 2024 & 2032
- Figure 78: Middle East and Africa Immunoassay Industry Volume Share (%), by Application 2024 & 2032
- Figure 79: Middle East and Africa Immunoassay Industry Revenue (Million), by End User 2024 & 2032
- Figure 80: Middle East and Africa Immunoassay Industry Volume (K Unit), by End User 2024 & 2032
- Figure 81: Middle East and Africa Immunoassay Industry Revenue Share (%), by End User 2024 & 2032
- Figure 82: Middle East and Africa Immunoassay Industry Volume Share (%), by End User 2024 & 2032
- Figure 83: Middle East and Africa Immunoassay Industry Revenue (Million), by Country 2024 & 2032
- Figure 84: Middle East and Africa Immunoassay Industry Volume (K Unit), by Country 2024 & 2032
- Figure 85: Middle East and Africa Immunoassay Industry Revenue Share (%), by Country 2024 & 2032
- Figure 86: Middle East and Africa Immunoassay Industry Volume Share (%), by Country 2024 & 2032
- Figure 87: South America Immunoassay Industry Revenue (Million), by Type 2024 & 2032
- Figure 88: South America Immunoassay Industry Volume (K Unit), by Type 2024 & 2032
- Figure 89: South America Immunoassay Industry Revenue Share (%), by Type 2024 & 2032
- Figure 90: South America Immunoassay Industry Volume Share (%), by Type 2024 & 2032
- Figure 91: South America Immunoassay Industry Revenue (Million), by Application 2024 & 2032
- Figure 92: South America Immunoassay Industry Volume (K Unit), by Application 2024 & 2032
- Figure 93: South America Immunoassay Industry Revenue Share (%), by Application 2024 & 2032
- Figure 94: South America Immunoassay Industry Volume Share (%), by Application 2024 & 2032
- Figure 95: South America Immunoassay Industry Revenue (Million), by End User 2024 & 2032
- Figure 96: South America Immunoassay Industry Volume (K Unit), by End User 2024 & 2032
- Figure 97: South America Immunoassay Industry Revenue Share (%), by End User 2024 & 2032
- Figure 98: South America Immunoassay Industry Volume Share (%), by End User 2024 & 2032
- Figure 99: South America Immunoassay Industry Revenue (Million), by Country 2024 & 2032
- Figure 100: South America Immunoassay Industry Volume (K Unit), by Country 2024 & 2032
- Figure 101: South America Immunoassay Industry Revenue Share (%), by Country 2024 & 2032
- Figure 102: South America Immunoassay Industry Volume Share (%), by Country 2024 & 2032
List of Tables
- Table 1: Global Immunoassay Industry Revenue Million Forecast, by Region 2019 & 2032
- Table 2: Global Immunoassay Industry Volume K Unit Forecast, by Region 2019 & 2032
- Table 3: Global Immunoassay Industry Revenue Million Forecast, by Type 2019 & 2032
- Table 4: Global Immunoassay Industry Volume K Unit Forecast, by Type 2019 & 2032
- Table 5: Global Immunoassay Industry Revenue Million Forecast, by Application 2019 & 2032
- Table 6: Global Immunoassay Industry Volume K Unit Forecast, by Application 2019 & 2032
- Table 7: Global Immunoassay Industry Revenue Million Forecast, by End User 2019 & 2032
- Table 8: Global Immunoassay Industry Volume K Unit Forecast, by End User 2019 & 2032
- Table 9: Global Immunoassay Industry Revenue Million Forecast, by Region 2019 & 2032
- Table 10: Global Immunoassay Industry Volume K Unit Forecast, by Region 2019 & 2032
- Table 11: Global Immunoassay Industry Revenue Million Forecast, by Country 2019 & 2032
- Table 12: Global Immunoassay Industry Volume K Unit Forecast, by Country 2019 & 2032
- Table 13: United States Immunoassay Industry Revenue (Million) Forecast, by Application 2019 & 2032
- Table 14: United States Immunoassay Industry Volume (K Unit) Forecast, by Application 2019 & 2032
- Table 15: Canada Immunoassay Industry Revenue (Million) Forecast, by Application 2019 & 2032
- Table 16: Canada Immunoassay Industry Volume (K Unit) Forecast, by Application 2019 & 2032
- Table 17: Mexico Immunoassay Industry Revenue (Million) Forecast, by Application 2019 & 2032
- Table 18: Mexico Immunoassay Industry Volume (K Unit) Forecast, by Application 2019 & 2032
- Table 19: Global Immunoassay Industry Revenue Million Forecast, by Country 2019 & 2032
- Table 20: Global Immunoassay Industry Volume K Unit Forecast, by Country 2019 & 2032
- Table 21: Germany Immunoassay Industry Revenue (Million) Forecast, by Application 2019 & 2032
- Table 22: Germany Immunoassay Industry Volume (K Unit) Forecast, by Application 2019 & 2032
- Table 23: United Kingdom Immunoassay Industry Revenue (Million) Forecast, by Application 2019 & 2032
- Table 24: United Kingdom Immunoassay Industry Volume (K Unit) Forecast, by Application 2019 & 2032
- Table 25: France Immunoassay Industry Revenue (Million) Forecast, by Application 2019 & 2032
- Table 26: France Immunoassay Industry Volume (K Unit) Forecast, by Application 2019 & 2032
- Table 27: Italy Immunoassay Industry Revenue (Million) Forecast, by Application 2019 & 2032
- Table 28: Italy Immunoassay Industry Volume (K Unit) Forecast, by Application 2019 & 2032
- Table 29: Spain Immunoassay Industry Revenue (Million) Forecast, by Application 2019 & 2032
- Table 30: Spain Immunoassay Industry Volume (K Unit) Forecast, by Application 2019 & 2032
- Table 31: Rest of Europe Immunoassay Industry Revenue (Million) Forecast, by Application 2019 & 2032
- Table 32: Rest of Europe Immunoassay Industry Volume (K Unit) Forecast, by Application 2019 & 2032
- Table 33: Global Immunoassay Industry Revenue Million Forecast, by Country 2019 & 2032
- Table 34: Global Immunoassay Industry Volume K Unit Forecast, by Country 2019 & 2032
- Table 35: China Immunoassay Industry Revenue (Million) Forecast, by Application 2019 & 2032
- Table 36: China Immunoassay Industry Volume (K Unit) Forecast, by Application 2019 & 2032
- Table 37: Japan Immunoassay Industry Revenue (Million) Forecast, by Application 2019 & 2032
- Table 38: Japan Immunoassay Industry Volume (K Unit) Forecast, by Application 2019 & 2032
- Table 39: India Immunoassay Industry Revenue (Million) Forecast, by Application 2019 & 2032
- Table 40: India Immunoassay Industry Volume (K Unit) Forecast, by Application 2019 & 2032
- Table 41: Australia Immunoassay Industry Revenue (Million) Forecast, by Application 2019 & 2032
- Table 42: Australia Immunoassay Industry Volume (K Unit) Forecast, by Application 2019 & 2032
- Table 43: South Korea Immunoassay Industry Revenue (Million) Forecast, by Application 2019 & 2032
- Table 44: South Korea Immunoassay Industry Volume (K Unit) Forecast, by Application 2019 & 2032
- Table 45: Rest of Asia Pacific Immunoassay Industry Revenue (Million) Forecast, by Application 2019 & 2032
- Table 46: Rest of Asia Pacific Immunoassay Industry Volume (K Unit) Forecast, by Application 2019 & 2032
- Table 47: Global Immunoassay Industry Revenue Million Forecast, by Country 2019 & 2032
- Table 48: Global Immunoassay Industry Volume K Unit Forecast, by Country 2019 & 2032
- Table 49: GCC Immunoassay Industry Revenue (Million) Forecast, by Application 2019 & 2032
- Table 50: GCC Immunoassay Industry Volume (K Unit) Forecast, by Application 2019 & 2032
- Table 51: South Africa Immunoassay Industry Revenue (Million) Forecast, by Application 2019 & 2032
- Table 52: South Africa Immunoassay Industry Volume (K Unit) Forecast, by Application 2019 & 2032
- Table 53: Rest of Middle East and Africa Immunoassay Industry Revenue (Million) Forecast, by Application 2019 & 2032
- Table 54: Rest of Middle East and Africa Immunoassay Industry Volume (K Unit) Forecast, by Application 2019 & 2032
- Table 55: Global Immunoassay Industry Revenue Million Forecast, by Country 2019 & 2032
- Table 56: Global Immunoassay Industry Volume K Unit Forecast, by Country 2019 & 2032
- Table 57: Brazil Immunoassay Industry Revenue (Million) Forecast, by Application 2019 & 2032
- Table 58: Brazil Immunoassay Industry Volume (K Unit) Forecast, by Application 2019 & 2032
- Table 59: Argentina Immunoassay Industry Revenue (Million) Forecast, by Application 2019 & 2032
- Table 60: Argentina Immunoassay Industry Volume (K Unit) Forecast, by Application 2019 & 2032
- Table 61: Rest of South America Immunoassay Industry Revenue (Million) Forecast, by Application 2019 & 2032
- Table 62: Rest of South America Immunoassay Industry Volume (K Unit) Forecast, by Application 2019 & 2032
- Table 63: Global Immunoassay Industry Revenue Million Forecast, by Type 2019 & 2032
- Table 64: Global Immunoassay Industry Volume K Unit Forecast, by Type 2019 & 2032
- Table 65: Global Immunoassay Industry Revenue Million Forecast, by Application 2019 & 2032
- Table 66: Global Immunoassay Industry Volume K Unit Forecast, by Application 2019 & 2032
- Table 67: Global Immunoassay Industry Revenue Million Forecast, by End User 2019 & 2032
- Table 68: Global Immunoassay Industry Volume K Unit Forecast, by End User 2019 & 2032
- Table 69: Global Immunoassay Industry Revenue Million Forecast, by Country 2019 & 2032
- Table 70: Global Immunoassay Industry Volume K Unit Forecast, by Country 2019 & 2032
- Table 71: United States Immunoassay Industry Revenue (Million) Forecast, by Application 2019 & 2032
- Table 72: United States Immunoassay Industry Volume (K Unit) Forecast, by Application 2019 & 2032
- Table 73: Canada Immunoassay Industry Revenue (Million) Forecast, by Application 2019 & 2032
- Table 74: Canada Immunoassay Industry Volume (K Unit) Forecast, by Application 2019 & 2032
- Table 75: Mexico Immunoassay Industry Revenue (Million) Forecast, by Application 2019 & 2032
- Table 76: Mexico Immunoassay Industry Volume (K Unit) Forecast, by Application 2019 & 2032
- Table 77: Global Immunoassay Industry Revenue Million Forecast, by Type 2019 & 2032
- Table 78: Global Immunoassay Industry Volume K Unit Forecast, by Type 2019 & 2032
- Table 79: Global Immunoassay Industry Revenue Million Forecast, by Application 2019 & 2032
- Table 80: Global Immunoassay Industry Volume K Unit Forecast, by Application 2019 & 2032
- Table 81: Global Immunoassay Industry Revenue Million Forecast, by End User 2019 & 2032
- Table 82: Global Immunoassay Industry Volume K Unit Forecast, by End User 2019 & 2032
- Table 83: Global Immunoassay Industry Revenue Million Forecast, by Country 2019 & 2032
- Table 84: Global Immunoassay Industry Volume K Unit Forecast, by Country 2019 & 2032
- Table 85: Germany Immunoassay Industry Revenue (Million) Forecast, by Application 2019 & 2032
- Table 86: Germany Immunoassay Industry Volume (K Unit) Forecast, by Application 2019 & 2032
- Table 87: United Kingdom Immunoassay Industry Revenue (Million) Forecast, by Application 2019 & 2032
- Table 88: United Kingdom Immunoassay Industry Volume (K Unit) Forecast, by Application 2019 & 2032
- Table 89: France Immunoassay Industry Revenue (Million) Forecast, by Application 2019 & 2032
- Table 90: France Immunoassay Industry Volume (K Unit) Forecast, by Application 2019 & 2032
- Table 91: Italy Immunoassay Industry Revenue (Million) Forecast, by Application 2019 & 2032
- Table 92: Italy Immunoassay Industry Volume (K Unit) Forecast, by Application 2019 & 2032
- Table 93: Spain Immunoassay Industry Revenue (Million) Forecast, by Application 2019 & 2032
- Table 94: Spain Immunoassay Industry Volume (K Unit) Forecast, by Application 2019 & 2032
- Table 95: Rest of Europe Immunoassay Industry Revenue (Million) Forecast, by Application 2019 & 2032
- Table 96: Rest of Europe Immunoassay Industry Volume (K Unit) Forecast, by Application 2019 & 2032
- Table 97: Global Immunoassay Industry Revenue Million Forecast, by Type 2019 & 2032
- Table 98: Global Immunoassay Industry Volume K Unit Forecast, by Type 2019 & 2032
- Table 99: Global Immunoassay Industry Revenue Million Forecast, by Application 2019 & 2032
- Table 100: Global Immunoassay Industry Volume K Unit Forecast, by Application 2019 & 2032
- Table 101: Global Immunoassay Industry Revenue Million Forecast, by End User 2019 & 2032
- Table 102: Global Immunoassay Industry Volume K Unit Forecast, by End User 2019 & 2032
- Table 103: Global Immunoassay Industry Revenue Million Forecast, by Country 2019 & 2032
- Table 104: Global Immunoassay Industry Volume K Unit Forecast, by Country 2019 & 2032
- Table 105: China Immunoassay Industry Revenue (Million) Forecast, by Application 2019 & 2032
- Table 106: China Immunoassay Industry Volume (K Unit) Forecast, by Application 2019 & 2032
- Table 107: Japan Immunoassay Industry Revenue (Million) Forecast, by Application 2019 & 2032
- Table 108: Japan Immunoassay Industry Volume (K Unit) Forecast, by Application 2019 & 2032
- Table 109: India Immunoassay Industry Revenue (Million) Forecast, by Application 2019 & 2032
- Table 110: India Immunoassay Industry Volume (K Unit) Forecast, by Application 2019 & 2032
- Table 111: Australia Immunoassay Industry Revenue (Million) Forecast, by Application 2019 & 2032
- Table 112: Australia Immunoassay Industry Volume (K Unit) Forecast, by Application 2019 & 2032
- Table 113: South Korea Immunoassay Industry Revenue (Million) Forecast, by Application 2019 & 2032
- Table 114: South Korea Immunoassay Industry Volume (K Unit) Forecast, by Application 2019 & 2032
- Table 115: Rest of Asia Pacific Immunoassay Industry Revenue (Million) Forecast, by Application 2019 & 2032
- Table 116: Rest of Asia Pacific Immunoassay Industry Volume (K Unit) Forecast, by Application 2019 & 2032
- Table 117: Global Immunoassay Industry Revenue Million Forecast, by Type 2019 & 2032
- Table 118: Global Immunoassay Industry Volume K Unit Forecast, by Type 2019 & 2032
- Table 119: Global Immunoassay Industry Revenue Million Forecast, by Application 2019 & 2032
- Table 120: Global Immunoassay Industry Volume K Unit Forecast, by Application 2019 & 2032
- Table 121: Global Immunoassay Industry Revenue Million Forecast, by End User 2019 & 2032
- Table 122: Global Immunoassay Industry Volume K Unit Forecast, by End User 2019 & 2032
- Table 123: Global Immunoassay Industry Revenue Million Forecast, by Country 2019 & 2032
- Table 124: Global Immunoassay Industry Volume K Unit Forecast, by Country 2019 & 2032
- Table 125: GCC Immunoassay Industry Revenue (Million) Forecast, by Application 2019 & 2032
- Table 126: GCC Immunoassay Industry Volume (K Unit) Forecast, by Application 2019 & 2032
- Table 127: South Africa Immunoassay Industry Revenue (Million) Forecast, by Application 2019 & 2032
- Table 128: South Africa Immunoassay Industry Volume (K Unit) Forecast, by Application 2019 & 2032
- Table 129: Rest of Middle East and Africa Immunoassay Industry Revenue (Million) Forecast, by Application 2019 & 2032
- Table 130: Rest of Middle East and Africa Immunoassay Industry Volume (K Unit) Forecast, by Application 2019 & 2032
- Table 131: Global Immunoassay Industry Revenue Million Forecast, by Type 2019 & 2032
- Table 132: Global Immunoassay Industry Volume K Unit Forecast, by Type 2019 & 2032
- Table 133: Global Immunoassay Industry Revenue Million Forecast, by Application 2019 & 2032
- Table 134: Global Immunoassay Industry Volume K Unit Forecast, by Application 2019 & 2032
- Table 135: Global Immunoassay Industry Revenue Million Forecast, by End User 2019 & 2032
- Table 136: Global Immunoassay Industry Volume K Unit Forecast, by End User 2019 & 2032
- Table 137: Global Immunoassay Industry Revenue Million Forecast, by Country 2019 & 2032
- Table 138: Global Immunoassay Industry Volume K Unit Forecast, by Country 2019 & 2032
- Table 139: Brazil Immunoassay Industry Revenue (Million) Forecast, by Application 2019 & 2032
- Table 140: Brazil Immunoassay Industry Volume (K Unit) Forecast, by Application 2019 & 2032
- Table 141: Argentina Immunoassay Industry Revenue (Million) Forecast, by Application 2019 & 2032
- Table 142: Argentina Immunoassay Industry Volume (K Unit) Forecast, by Application 2019 & 2032
- Table 143: Rest of South America Immunoassay Industry Revenue (Million) Forecast, by Application 2019 & 2032
- Table 144: Rest of South America Immunoassay Industry Volume (K Unit) Forecast, by Application 2019 & 2032
Frequently Asked Questions
1. What is the projected Compound Annual Growth Rate (CAGR) of the Immunoassay Industry?
The projected CAGR is approximately 7.70%.
2. Which companies are prominent players in the Immunoassay Industry?
Key companies in the market include Becton Dickinson and Company, Bio-Rad Laboratories Inc, Hologic Inc, Abbott Laboratories, F Hoffmann-La Roche AG, Agilent Technologies Inc, Danaher Corporation (Beckman Coulter Inc), Qiagen NV, Sysmex Corporation, Thermo Fisher Scientific, Luminex Corporation, PerkinElmer Inc .
3. What are the main segments of the Immunoassay Industry?
The market segments include Type, Application, End User.
4. Can you provide details about the market size?
The market size is estimated to be USD XX Million as of 2022.
5. What are some drivers contributing to market growth?
High Sensitivity and Specificity of Immunoassays; Technological Advancements in Immunoassay Instruments; Increasing Prevalence of Chronic and Infectious Diseases.
6. What are the notable trends driving market growth?
Enzyme Immunoassays (EIA) Segment is Expected to Hold Significant Market Share in Immunoassay Market.
7. Are there any restraints impacting market growth?
Stringent Regulatory Scenario for Approval of Immunoassays; Complexity of Procedures.
8. Can you provide examples of recent developments in the market?
In November 2022, Getein launched MAGICL 6000 CLIA analyzer at MEDICA 2022. MAGICL 6000 is a compact and innovative CLIA analyzer, with optimal choice for mid to high-workflow laboratories that require a one-step CLIA solution.
9. What pricing options are available for accessing the report?
Pricing options include single-user, multi-user, and enterprise licenses priced at USD 4750, USD 5250, and USD 8750 respectively.
10. Is the market size provided in terms of value or volume?
The market size is provided in terms of value, measured in Million and volume, measured in K Unit.
11. Are there any specific market keywords associated with the report?
Yes, the market keyword associated with the report is "Immunoassay Industry," which aids in identifying and referencing the specific market segment covered.
12. How do I determine which pricing option suits my needs best?
The pricing options vary based on user requirements and access needs. Individual users may opt for single-user licenses, while businesses requiring broader access may choose multi-user or enterprise licenses for cost-effective access to the report.
13. Are there any additional resources or data provided in the Immunoassay Industry report?
While the report offers comprehensive insights, it's advisable to review the specific contents or supplementary materials provided to ascertain if additional resources or data are available.
14. How can I stay updated on further developments or reports in the Immunoassay Industry?
To stay informed about further developments, trends, and reports in the Immunoassay Industry, consider subscribing to industry newsletters, following relevant companies and organizations, or regularly checking reputable industry news sources and publications.
Methodology
Step 1 - Identification of Relevant Samples Size from Population Database


Step 2 - Approaches for Defining Global Market Size (Value, Volume* & Price*)

Note*: In applicable scenarios
Step 3 - Data Sources
Primary Research
- Web Analytics
- Survey Reports
- Research Institute
- Latest Research Reports
- Opinion Leaders
Secondary Research
- Annual Reports
- White Paper
- Latest Press Release
- Industry Association
- Paid Database
- Investor Presentations

Step 4 - Data Triangulation
Involves using different sources of information in order to increase the validity of a study
These sources are likely to be stakeholders in a program - participants, other researchers, program staff, other community members, and so on.
Then we put all data in single framework & apply various statistical tools to find out the dynamic on the market.
During the analysis stage, feedback from the stakeholder groups would be compared to determine areas of agreement as well as areas of divergence


