
Key Insights
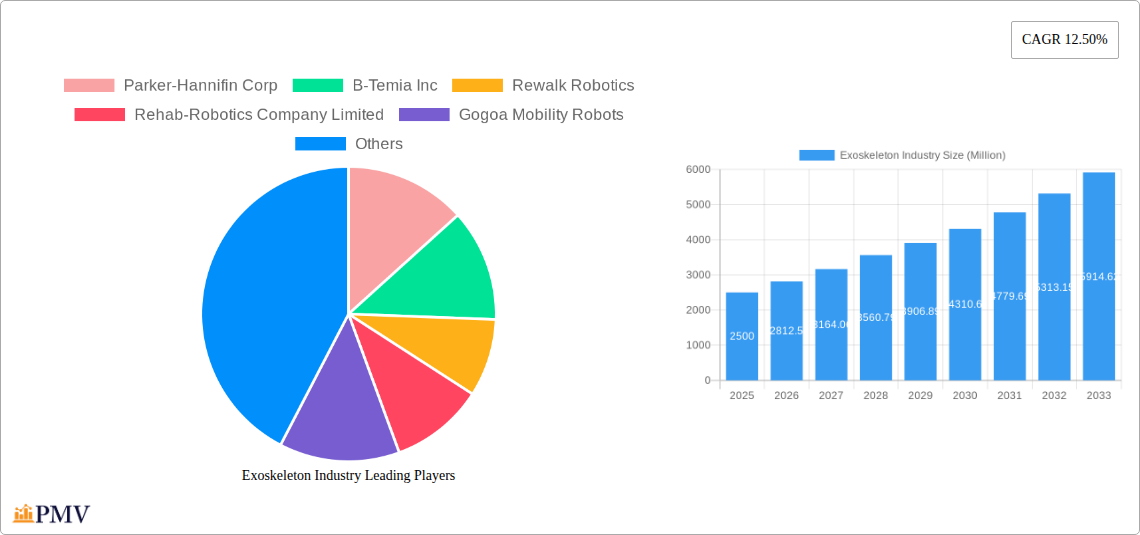
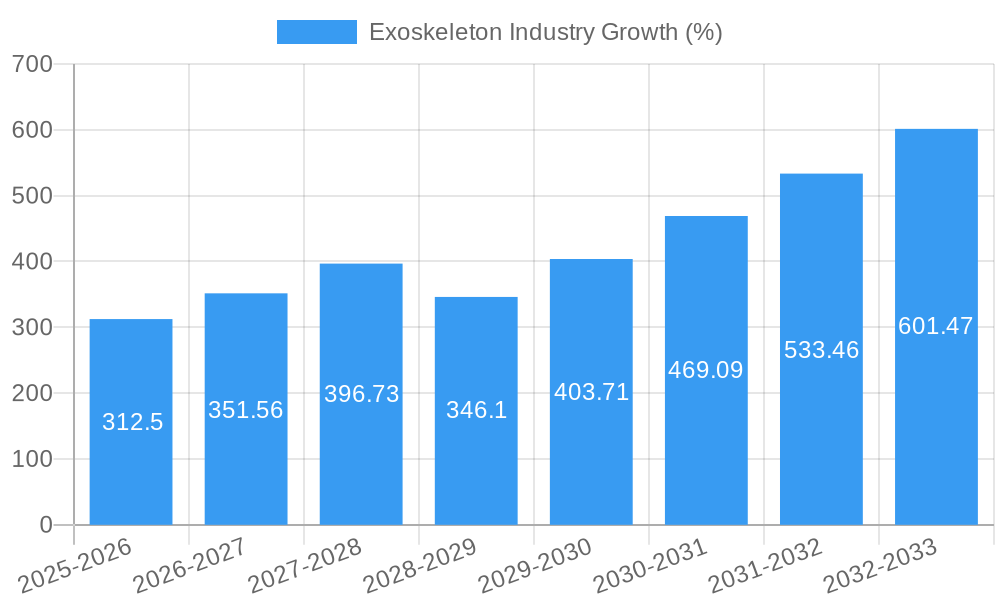
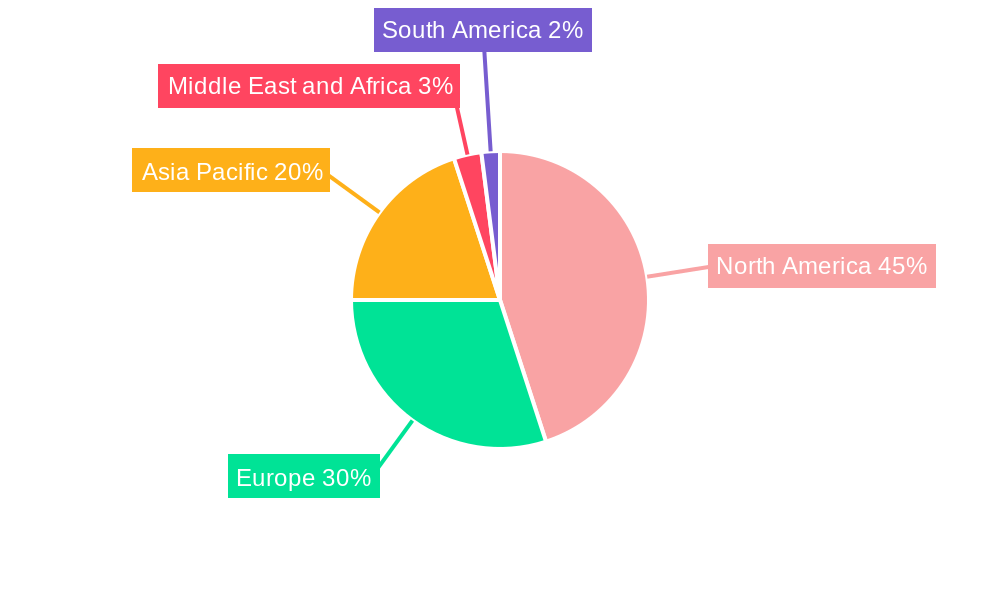
The global exoskeleton market, currently experiencing robust growth, is projected to reach a substantial size driven by increasing demand for rehabilitation solutions, advancements in augmentation technologies, and the rising prevalence of neurological disorders and physical impairments. The market's compound annual growth rate (CAGR) of 12.50% from 2019 to 2024 indicates a significant expansion, expected to continue throughout the forecast period (2025-2033). Key drivers include technological innovations leading to lighter, more comfortable, and functionally advanced exoskeletons, increasing healthcare spending globally, and the growing acceptance of robotic-assisted rehabilitation. Market segmentation reveals a strong demand across various treatment types (rehabilitation and augmentation) and body parts (upper and lower body), with stationary and mobile product types catering to diverse needs. North America currently holds a significant market share, fueled by early adoption of advanced medical technologies and a large aging population. However, the Asia-Pacific region is poised for rapid growth due to rising disposable incomes and increasing healthcare infrastructure development. While high initial investment costs and potential safety concerns may act as restraints, ongoing research and development efforts are focused on addressing these challenges, paving the way for broader market penetration.
The competitive landscape features a mix of established players and emerging companies, each vying for market dominance through product innovation and strategic partnerships. Major players like Parker-Hannifin Corp, Ekso Bionics Holdings, and Rewalk Robotics are leveraging their technological expertise to develop advanced exoskeletons for various applications, including healthcare, industrial settings, and military applications. The market's future trajectory is contingent on successful technological advancements, regulatory approvals, and increasing awareness among healthcare professionals and patients about the benefits of exoskeleton technology. Continued investment in research and development, along with strategic collaborations between technology companies and healthcare providers, will be crucial for driving further market growth and expansion in the coming years. The diverse application areas and the evolving needs of an aging global population suggest a promising outlook for the exoskeleton industry, with significant potential for continued expansion.
Exoskeleton Industry Market Report: 2019-2033
This comprehensive report provides a detailed analysis of the global exoskeleton industry, offering invaluable insights for stakeholders seeking to navigate this rapidly evolving market. The report covers the period from 2019 to 2033, with a focus on the forecast period of 2025-2033 and a base year of 2025. The total market value is projected to reach xx Million by 2033.
Exoskeleton Industry Market Structure & Competitive Dynamics
The global exoskeleton market is characterized by a moderately concentrated structure, with key players holding significant market share. The industry is witnessing increased innovation, driven by advancements in robotics, sensors, and materials science. Regulatory frameworks, varying across geographies, play a crucial role in market penetration and adoption. Product substitutes, such as traditional mobility aids, remain a competitive force, although exoskeletons offer superior functionality and potential for improved patient outcomes. End-user trends, particularly in healthcare and industrial applications, are shaping product development and market demand. Mergers and acquisitions (M&A) activities are increasing, signaling industry consolidation and strategic expansion efforts. For example, the M&A deal value in 2024 was estimated at xx Million. Key players like Ekso Bionics Holdings and Cyberdyne Inc. have acquired smaller companies to bolster their technology portfolios and expand their market reach. Market share analysis reveals that the top 5 players collectively account for approximately xx% of the global market in 2025.
- Market Concentration: Moderately Concentrated
- Innovation Ecosystem: Robust, driven by advancements in robotics and materials science.
- Regulatory Frameworks: Varying across regions, impacting market access.
- Product Substitutes: Traditional mobility aids, but exoskeletons offer superior functionality.
- M&A Activity: Increasing, signaling industry consolidation and expansion.
Exoskeleton Industry Trends & Insights
The exoskeleton market is experiencing significant growth, driven by several key factors. The rising geriatric population globally is fueling the demand for rehabilitation exoskeletons. Technological advancements, such as the integration of artificial intelligence (AI) and machine learning (ML), are enhancing the performance and capabilities of exoskeletons, leading to increased adoption. Furthermore, growing investments in research and development, coupled with increasing government support for assistive technologies, are creating favorable market conditions. Consumer preferences are shifting towards lightweight, comfortable, and user-friendly exoskeletons. Competitive dynamics are characterized by ongoing innovation, strategic partnerships, and market expansion efforts by leading players. The Compound Annual Growth Rate (CAGR) for the global exoskeleton market during the forecast period (2025-2033) is estimated at xx%. Market penetration is expected to increase significantly, particularly in developed countries, due to higher awareness and improved healthcare infrastructure.
Dominant Markets & Segments in Exoskeleton Industry
The North American region currently dominates the global exoskeleton market, driven by factors such as high healthcare expenditure, advanced technological infrastructure, and strong regulatory support for medical devices. Within North America, the United States holds the largest market share.
- Leading Region: North America
- Leading Country: United States
Segment Dominance:
- Treatment Type: Rehabilitation exoskeletons constitute the largest segment, owing to the growing prevalence of neurological disorders and musculoskeletal injuries.
- Body Part Type: Lower body exoskeletons currently hold the largest market share, primarily due to the high demand for mobility assistance.
- Product Type: Mobile exoskeletons are gaining traction due to their versatility and ability to provide assistance in various settings.
Key Drivers:
- High healthcare expenditure: Driving demand in developed markets.
- Technological advancements: Enhanced functionalities and improved user experience.
- Favorable regulatory environment: Facilitating market access for medical devices.
- Growing awareness: Increased understanding of the benefits of exoskeletons.
Exoskeleton Industry Product Innovations
Recent innovations include the development of soft exoskeletons, which provide comfortable and adaptable support, and the integration of advanced sensor technologies to enhance user control and feedback. These advancements are improving the functionality, comfort, and adaptability of exoskeletons, expanding their potential applications across various sectors. This, in turn, leads to a greater market fit, broadening customer appeal and increasing market penetration.
Report Segmentation & Scope
This report segments the exoskeleton market based on treatment type (rehabilitation, augmentation), body part type (upper body, lower body), and product type (stationary, mobile). Each segment is analyzed in detail, providing insights into market size, growth projections, and competitive dynamics. Growth projections vary across segments, with the rehabilitation and lower-body exoskeleton segments experiencing faster growth than their counterparts. The competitive landscape also varies across segments, with some segments exhibiting high concentration and others displaying higher fragmentation.
Key Drivers of Exoskeleton Industry Growth
The growth of the exoskeleton industry is fueled by several key factors. Technological advancements in robotics, sensors, and materials science have led to the development of lighter, more comfortable, and more effective exoskeletons. Furthermore, the increasing prevalence of neurological disorders and musculoskeletal injuries is driving demand for rehabilitation exoskeletons. Government initiatives and funding for assistive technologies are also contributing to market growth, as is the rising awareness among healthcare professionals and consumers of the potential benefits of exoskeleton technology.
Challenges in the Exoskeleton Industry Sector
The exoskeleton industry faces several challenges, including high production costs, stringent regulatory approvals, and the need for skilled professionals for operation and maintenance. Supply chain disruptions and the complexity of integrating advanced technologies into exoskeleton designs also pose significant hurdles. Moreover, the limited reimbursement coverage for exoskeletons in some healthcare systems restricts market access and limits adoption. These challenges collectively impact market growth and expansion.
Leading Players in the Exoskeleton Industry Market
- Parker-Hannifin Corp
- B-Temia Inc
- Rewalk Robotics
- Rehab-Robotics Company Limited
- Gogoa Mobility Robots
- Bioservo Technologies AB
- Bionik Laboratories Corp
- Cyberdyne Inc
- Ekso Bionics Holdings
- Bioness Inc
Key Developments in Exoskeleton Industry Sector
- 2023 Q3: Ekso Bionics launched a new generation of exoskeletons with improved features.
- 2024 Q1: Cyberdyne Inc. announced a strategic partnership for global market expansion.
- 2024 Q4: A major acquisition in the rehabilitation exoskeleton segment reshaped market dynamics.
Strategic Exoskeleton Industry Market Outlook
The exoskeleton market is poised for significant growth, driven by continued technological innovation, increasing demand from healthcare and industrial sectors, and supportive regulatory environments. Strategic opportunities exist in developing lightweight, user-friendly exoskeletons, exploring new applications, and expanding market penetration in emerging economies. Focusing on personalized solutions and integrating advanced technologies will be crucial for success in this dynamic market.
Exoskeleton Industry Segmentation
-
1. Treatment Type
- 1.1. Rehabilitation
- 1.2. Augmentation
-
2. Body Part Type
- 2.1. Upper Body
- 2.2. Lower Body
-
3. Product Type
- 3.1. Stationary
- 3.2. Mobile
Exoskeleton Industry Segmentation By Geography
-
1. North America
- 1.1. United States
- 1.2. Canada
- 1.3. Mexico
-
2. Europe
- 2.1. Germany
- 2.2. United Kingdom
- 2.3. France
- 2.4. Italy
- 2.5. Spain
- 2.6. Rest of Europe
-
3. Asia Pacific
- 3.1. China
- 3.2. Japan
- 3.3. India
- 3.4. Australia
- 3.5. South Korea
- 3.6. Rest of Asia Pacific
-
4. Middle East and Africa
- 4.1. GCC
- 4.2. South Africa
- 4.3. Rest of Middle East and Africa
-
5. South America
- 5.1. Brazil
- 5.2. Argentina
- 5.3. Rest of South America
Exoskeleton Industry REPORT HIGHLIGHTS
| Aspects | Details |
|---|---|
| Study Period | 2019-2033 |
| Base Year | 2024 |
| Estimated Year | 2025 |
| Forecast Period | 2025-2033 |
| Historical Period | 2019-2024 |
| Growth Rate | CAGR of 12.50% from 2019-2033 |
| Segmentation |
|
Table of Contents
- 1. Introduction
- 1.1. Research Scope
- 1.2. Market Segmentation
- 1.3. Research Methodology
- 1.4. Definitions and Assumptions
- 2. Executive Summary
- 2.1. Introduction
- 3. Market Dynamics
- 3.1. Introduction
- 3.2. Market Drivers
- 3.2.1. Growing Demand from Healthcare Sector for Robotic Rehabilitation; Advancement in Robotic Technologies; Huge Investment for the Development of the Exoskeleton Technology
- 3.3. Market Restrains
- 3.3.1. Risks Involved with Using Exoskeletons Due to Vague Safety Guidelines
- 3.4. Market Trends
- 3.4.1. The Mobile Segment is Expected to Hold the Largest Share by Product Type Over the Forecast Period
- 4. Market Factor Analysis
- 4.1. Porters Five Forces
- 4.2. Supply/Value Chain
- 4.3. PESTEL analysis
- 4.4. Market Entropy
- 4.5. Patent/Trademark Analysis
- 5. Global Exoskeleton Industry Analysis, Insights and Forecast, 2019-2031
- 5.1. Market Analysis, Insights and Forecast - by Treatment Type
- 5.1.1. Rehabilitation
- 5.1.2. Augmentation
- 5.2. Market Analysis, Insights and Forecast - by Body Part Type
- 5.2.1. Upper Body
- 5.2.2. Lower Body
- 5.3. Market Analysis, Insights and Forecast - by Product Type
- 5.3.1. Stationary
- 5.3.2. Mobile
- 5.4. Market Analysis, Insights and Forecast - by Region
- 5.4.1. North America
- 5.4.2. Europe
- 5.4.3. Asia Pacific
- 5.4.4. Middle East and Africa
- 5.4.5. South America
- 5.1. Market Analysis, Insights and Forecast - by Treatment Type
- 6. North America Exoskeleton Industry Analysis, Insights and Forecast, 2019-2031
- 6.1. Market Analysis, Insights and Forecast - by Treatment Type
- 6.1.1. Rehabilitation
- 6.1.2. Augmentation
- 6.2. Market Analysis, Insights and Forecast - by Body Part Type
- 6.2.1. Upper Body
- 6.2.2. Lower Body
- 6.3. Market Analysis, Insights and Forecast - by Product Type
- 6.3.1. Stationary
- 6.3.2. Mobile
- 6.1. Market Analysis, Insights and Forecast - by Treatment Type
- 7. Europe Exoskeleton Industry Analysis, Insights and Forecast, 2019-2031
- 7.1. Market Analysis, Insights and Forecast - by Treatment Type
- 7.1.1. Rehabilitation
- 7.1.2. Augmentation
- 7.2. Market Analysis, Insights and Forecast - by Body Part Type
- 7.2.1. Upper Body
- 7.2.2. Lower Body
- 7.3. Market Analysis, Insights and Forecast - by Product Type
- 7.3.1. Stationary
- 7.3.2. Mobile
- 7.1. Market Analysis, Insights and Forecast - by Treatment Type
- 8. Asia Pacific Exoskeleton Industry Analysis, Insights and Forecast, 2019-2031
- 8.1. Market Analysis, Insights and Forecast - by Treatment Type
- 8.1.1. Rehabilitation
- 8.1.2. Augmentation
- 8.2. Market Analysis, Insights and Forecast - by Body Part Type
- 8.2.1. Upper Body
- 8.2.2. Lower Body
- 8.3. Market Analysis, Insights and Forecast - by Product Type
- 8.3.1. Stationary
- 8.3.2. Mobile
- 8.1. Market Analysis, Insights and Forecast - by Treatment Type
- 9. Middle East and Africa Exoskeleton Industry Analysis, Insights and Forecast, 2019-2031
- 9.1. Market Analysis, Insights and Forecast - by Treatment Type
- 9.1.1. Rehabilitation
- 9.1.2. Augmentation
- 9.2. Market Analysis, Insights and Forecast - by Body Part Type
- 9.2.1. Upper Body
- 9.2.2. Lower Body
- 9.3. Market Analysis, Insights and Forecast - by Product Type
- 9.3.1. Stationary
- 9.3.2. Mobile
- 9.1. Market Analysis, Insights and Forecast - by Treatment Type
- 10. South America Exoskeleton Industry Analysis, Insights and Forecast, 2019-2031
- 10.1. Market Analysis, Insights and Forecast - by Treatment Type
- 10.1.1. Rehabilitation
- 10.1.2. Augmentation
- 10.2. Market Analysis, Insights and Forecast - by Body Part Type
- 10.2.1. Upper Body
- 10.2.2. Lower Body
- 10.3. Market Analysis, Insights and Forecast - by Product Type
- 10.3.1. Stationary
- 10.3.2. Mobile
- 10.1. Market Analysis, Insights and Forecast - by Treatment Type
- 11. North America Exoskeleton Industry Analysis, Insights and Forecast, 2019-2031
- 11.1. Market Analysis, Insights and Forecast - By Country/Sub-region
- 11.1.1 United States
- 11.1.2 Canada
- 11.1.3 Mexico
- 12. Europe Exoskeleton Industry Analysis, Insights and Forecast, 2019-2031
- 12.1. Market Analysis, Insights and Forecast - By Country/Sub-region
- 12.1.1 Germany
- 12.1.2 United Kingdom
- 12.1.3 France
- 12.1.4 Italy
- 12.1.5 Spain
- 12.1.6 Rest of Europe
- 13. Asia Pacific Exoskeleton Industry Analysis, Insights and Forecast, 2019-2031
- 13.1. Market Analysis, Insights and Forecast - By Country/Sub-region
- 13.1.1 China
- 13.1.2 Japan
- 13.1.3 India
- 13.1.4 Australia
- 13.1.5 South Korea
- 13.1.6 Rest of Asia Pacific
- 14. Middle East and Africa Exoskeleton Industry Analysis, Insights and Forecast, 2019-2031
- 14.1. Market Analysis, Insights and Forecast - By Country/Sub-region
- 14.1.1 GCC
- 14.1.2 South Africa
- 14.1.3 Rest of Middle East and Africa
- 15. South America Exoskeleton Industry Analysis, Insights and Forecast, 2019-2031
- 15.1. Market Analysis, Insights and Forecast - By Country/Sub-region
- 15.1.1 Brazil
- 15.1.2 Argentina
- 15.1.3 Rest of South America
- 16. Competitive Analysis
- 16.1. Global Market Share Analysis 2024
- 16.2. Company Profiles
- 16.2.1 Parker-Hannifin Corp
- 16.2.1.1. Overview
- 16.2.1.2. Products
- 16.2.1.3. SWOT Analysis
- 16.2.1.4. Recent Developments
- 16.2.1.5. Financials (Based on Availability)
- 16.2.2 B-Temia Inc
- 16.2.2.1. Overview
- 16.2.2.2. Products
- 16.2.2.3. SWOT Analysis
- 16.2.2.4. Recent Developments
- 16.2.2.5. Financials (Based on Availability)
- 16.2.3 Rewalk Robotics
- 16.2.3.1. Overview
- 16.2.3.2. Products
- 16.2.3.3. SWOT Analysis
- 16.2.3.4. Recent Developments
- 16.2.3.5. Financials (Based on Availability)
- 16.2.4 Rehab-Robotics Company Limited
- 16.2.4.1. Overview
- 16.2.4.2. Products
- 16.2.4.3. SWOT Analysis
- 16.2.4.4. Recent Developments
- 16.2.4.5. Financials (Based on Availability)
- 16.2.5 Gogoa Mobility Robots
- 16.2.5.1. Overview
- 16.2.5.2. Products
- 16.2.5.3. SWOT Analysis
- 16.2.5.4. Recent Developments
- 16.2.5.5. Financials (Based on Availability)
- 16.2.6 Bioservo Technologies AB
- 16.2.6.1. Overview
- 16.2.6.2. Products
- 16.2.6.3. SWOT Analysis
- 16.2.6.4. Recent Developments
- 16.2.6.5. Financials (Based on Availability)
- 16.2.7 Bionik Laboratories Corp
- 16.2.7.1. Overview
- 16.2.7.2. Products
- 16.2.7.3. SWOT Analysis
- 16.2.7.4. Recent Developments
- 16.2.7.5. Financials (Based on Availability)
- 16.2.8 Cyberdyne Inc
- 16.2.8.1. Overview
- 16.2.8.2. Products
- 16.2.8.3. SWOT Analysis
- 16.2.8.4. Recent Developments
- 16.2.8.5. Financials (Based on Availability)
- 16.2.9 Ekso Bionics Holdings
- 16.2.9.1. Overview
- 16.2.9.2. Products
- 16.2.9.3. SWOT Analysis
- 16.2.9.4. Recent Developments
- 16.2.9.5. Financials (Based on Availability)
- 16.2.10 Bioness Inc
- 16.2.10.1. Overview
- 16.2.10.2. Products
- 16.2.10.3. SWOT Analysis
- 16.2.10.4. Recent Developments
- 16.2.10.5. Financials (Based on Availability)
- 16.2.1 Parker-Hannifin Corp
List of Figures
- Figure 1: Global Exoskeleton Industry Revenue Breakdown (Million, %) by Region 2024 & 2032
- Figure 2: North America Exoskeleton Industry Revenue (Million), by Country 2024 & 2032
- Figure 3: North America Exoskeleton Industry Revenue Share (%), by Country 2024 & 2032
- Figure 4: Europe Exoskeleton Industry Revenue (Million), by Country 2024 & 2032
- Figure 5: Europe Exoskeleton Industry Revenue Share (%), by Country 2024 & 2032
- Figure 6: Asia Pacific Exoskeleton Industry Revenue (Million), by Country 2024 & 2032
- Figure 7: Asia Pacific Exoskeleton Industry Revenue Share (%), by Country 2024 & 2032
- Figure 8: Middle East and Africa Exoskeleton Industry Revenue (Million), by Country 2024 & 2032
- Figure 9: Middle East and Africa Exoskeleton Industry Revenue Share (%), by Country 2024 & 2032
- Figure 10: South America Exoskeleton Industry Revenue (Million), by Country 2024 & 2032
- Figure 11: South America Exoskeleton Industry Revenue Share (%), by Country 2024 & 2032
- Figure 12: North America Exoskeleton Industry Revenue (Million), by Treatment Type 2024 & 2032
- Figure 13: North America Exoskeleton Industry Revenue Share (%), by Treatment Type 2024 & 2032
- Figure 14: North America Exoskeleton Industry Revenue (Million), by Body Part Type 2024 & 2032
- Figure 15: North America Exoskeleton Industry Revenue Share (%), by Body Part Type 2024 & 2032
- Figure 16: North America Exoskeleton Industry Revenue (Million), by Product Type 2024 & 2032
- Figure 17: North America Exoskeleton Industry Revenue Share (%), by Product Type 2024 & 2032
- Figure 18: North America Exoskeleton Industry Revenue (Million), by Country 2024 & 2032
- Figure 19: North America Exoskeleton Industry Revenue Share (%), by Country 2024 & 2032
- Figure 20: Europe Exoskeleton Industry Revenue (Million), by Treatment Type 2024 & 2032
- Figure 21: Europe Exoskeleton Industry Revenue Share (%), by Treatment Type 2024 & 2032
- Figure 22: Europe Exoskeleton Industry Revenue (Million), by Body Part Type 2024 & 2032
- Figure 23: Europe Exoskeleton Industry Revenue Share (%), by Body Part Type 2024 & 2032
- Figure 24: Europe Exoskeleton Industry Revenue (Million), by Product Type 2024 & 2032
- Figure 25: Europe Exoskeleton Industry Revenue Share (%), by Product Type 2024 & 2032
- Figure 26: Europe Exoskeleton Industry Revenue (Million), by Country 2024 & 2032
- Figure 27: Europe Exoskeleton Industry Revenue Share (%), by Country 2024 & 2032
- Figure 28: Asia Pacific Exoskeleton Industry Revenue (Million), by Treatment Type 2024 & 2032
- Figure 29: Asia Pacific Exoskeleton Industry Revenue Share (%), by Treatment Type 2024 & 2032
- Figure 30: Asia Pacific Exoskeleton Industry Revenue (Million), by Body Part Type 2024 & 2032
- Figure 31: Asia Pacific Exoskeleton Industry Revenue Share (%), by Body Part Type 2024 & 2032
- Figure 32: Asia Pacific Exoskeleton Industry Revenue (Million), by Product Type 2024 & 2032
- Figure 33: Asia Pacific Exoskeleton Industry Revenue Share (%), by Product Type 2024 & 2032
- Figure 34: Asia Pacific Exoskeleton Industry Revenue (Million), by Country 2024 & 2032
- Figure 35: Asia Pacific Exoskeleton Industry Revenue Share (%), by Country 2024 & 2032
- Figure 36: Middle East and Africa Exoskeleton Industry Revenue (Million), by Treatment Type 2024 & 2032
- Figure 37: Middle East and Africa Exoskeleton Industry Revenue Share (%), by Treatment Type 2024 & 2032
- Figure 38: Middle East and Africa Exoskeleton Industry Revenue (Million), by Body Part Type 2024 & 2032
- Figure 39: Middle East and Africa Exoskeleton Industry Revenue Share (%), by Body Part Type 2024 & 2032
- Figure 40: Middle East and Africa Exoskeleton Industry Revenue (Million), by Product Type 2024 & 2032
- Figure 41: Middle East and Africa Exoskeleton Industry Revenue Share (%), by Product Type 2024 & 2032
- Figure 42: Middle East and Africa Exoskeleton Industry Revenue (Million), by Country 2024 & 2032
- Figure 43: Middle East and Africa Exoskeleton Industry Revenue Share (%), by Country 2024 & 2032
- Figure 44: South America Exoskeleton Industry Revenue (Million), by Treatment Type 2024 & 2032
- Figure 45: South America Exoskeleton Industry Revenue Share (%), by Treatment Type 2024 & 2032
- Figure 46: South America Exoskeleton Industry Revenue (Million), by Body Part Type 2024 & 2032
- Figure 47: South America Exoskeleton Industry Revenue Share (%), by Body Part Type 2024 & 2032
- Figure 48: South America Exoskeleton Industry Revenue (Million), by Product Type 2024 & 2032
- Figure 49: South America Exoskeleton Industry Revenue Share (%), by Product Type 2024 & 2032
- Figure 50: South America Exoskeleton Industry Revenue (Million), by Country 2024 & 2032
- Figure 51: South America Exoskeleton Industry Revenue Share (%), by Country 2024 & 2032
List of Tables
- Table 1: Global Exoskeleton Industry Revenue Million Forecast, by Region 2019 & 2032
- Table 2: Global Exoskeleton Industry Revenue Million Forecast, by Treatment Type 2019 & 2032
- Table 3: Global Exoskeleton Industry Revenue Million Forecast, by Body Part Type 2019 & 2032
- Table 4: Global Exoskeleton Industry Revenue Million Forecast, by Product Type 2019 & 2032
- Table 5: Global Exoskeleton Industry Revenue Million Forecast, by Region 2019 & 2032
- Table 6: Global Exoskeleton Industry Revenue Million Forecast, by Country 2019 & 2032
- Table 7: United States Exoskeleton Industry Revenue (Million) Forecast, by Application 2019 & 2032
- Table 8: Canada Exoskeleton Industry Revenue (Million) Forecast, by Application 2019 & 2032
- Table 9: Mexico Exoskeleton Industry Revenue (Million) Forecast, by Application 2019 & 2032
- Table 10: Global Exoskeleton Industry Revenue Million Forecast, by Country 2019 & 2032
- Table 11: Germany Exoskeleton Industry Revenue (Million) Forecast, by Application 2019 & 2032
- Table 12: United Kingdom Exoskeleton Industry Revenue (Million) Forecast, by Application 2019 & 2032
- Table 13: France Exoskeleton Industry Revenue (Million) Forecast, by Application 2019 & 2032
- Table 14: Italy Exoskeleton Industry Revenue (Million) Forecast, by Application 2019 & 2032
- Table 15: Spain Exoskeleton Industry Revenue (Million) Forecast, by Application 2019 & 2032
- Table 16: Rest of Europe Exoskeleton Industry Revenue (Million) Forecast, by Application 2019 & 2032
- Table 17: Global Exoskeleton Industry Revenue Million Forecast, by Country 2019 & 2032
- Table 18: China Exoskeleton Industry Revenue (Million) Forecast, by Application 2019 & 2032
- Table 19: Japan Exoskeleton Industry Revenue (Million) Forecast, by Application 2019 & 2032
- Table 20: India Exoskeleton Industry Revenue (Million) Forecast, by Application 2019 & 2032
- Table 21: Australia Exoskeleton Industry Revenue (Million) Forecast, by Application 2019 & 2032
- Table 22: South Korea Exoskeleton Industry Revenue (Million) Forecast, by Application 2019 & 2032
- Table 23: Rest of Asia Pacific Exoskeleton Industry Revenue (Million) Forecast, by Application 2019 & 2032
- Table 24: Global Exoskeleton Industry Revenue Million Forecast, by Country 2019 & 2032
- Table 25: GCC Exoskeleton Industry Revenue (Million) Forecast, by Application 2019 & 2032
- Table 26: South Africa Exoskeleton Industry Revenue (Million) Forecast, by Application 2019 & 2032
- Table 27: Rest of Middle East and Africa Exoskeleton Industry Revenue (Million) Forecast, by Application 2019 & 2032
- Table 28: Global Exoskeleton Industry Revenue Million Forecast, by Country 2019 & 2032
- Table 29: Brazil Exoskeleton Industry Revenue (Million) Forecast, by Application 2019 & 2032
- Table 30: Argentina Exoskeleton Industry Revenue (Million) Forecast, by Application 2019 & 2032
- Table 31: Rest of South America Exoskeleton Industry Revenue (Million) Forecast, by Application 2019 & 2032
- Table 32: Global Exoskeleton Industry Revenue Million Forecast, by Treatment Type 2019 & 2032
- Table 33: Global Exoskeleton Industry Revenue Million Forecast, by Body Part Type 2019 & 2032
- Table 34: Global Exoskeleton Industry Revenue Million Forecast, by Product Type 2019 & 2032
- Table 35: Global Exoskeleton Industry Revenue Million Forecast, by Country 2019 & 2032
- Table 36: United States Exoskeleton Industry Revenue (Million) Forecast, by Application 2019 & 2032
- Table 37: Canada Exoskeleton Industry Revenue (Million) Forecast, by Application 2019 & 2032
- Table 38: Mexico Exoskeleton Industry Revenue (Million) Forecast, by Application 2019 & 2032
- Table 39: Global Exoskeleton Industry Revenue Million Forecast, by Treatment Type 2019 & 2032
- Table 40: Global Exoskeleton Industry Revenue Million Forecast, by Body Part Type 2019 & 2032
- Table 41: Global Exoskeleton Industry Revenue Million Forecast, by Product Type 2019 & 2032
- Table 42: Global Exoskeleton Industry Revenue Million Forecast, by Country 2019 & 2032
- Table 43: Germany Exoskeleton Industry Revenue (Million) Forecast, by Application 2019 & 2032
- Table 44: United Kingdom Exoskeleton Industry Revenue (Million) Forecast, by Application 2019 & 2032
- Table 45: France Exoskeleton Industry Revenue (Million) Forecast, by Application 2019 & 2032
- Table 46: Italy Exoskeleton Industry Revenue (Million) Forecast, by Application 2019 & 2032
- Table 47: Spain Exoskeleton Industry Revenue (Million) Forecast, by Application 2019 & 2032
- Table 48: Rest of Europe Exoskeleton Industry Revenue (Million) Forecast, by Application 2019 & 2032
- Table 49: Global Exoskeleton Industry Revenue Million Forecast, by Treatment Type 2019 & 2032
- Table 50: Global Exoskeleton Industry Revenue Million Forecast, by Body Part Type 2019 & 2032
- Table 51: Global Exoskeleton Industry Revenue Million Forecast, by Product Type 2019 & 2032
- Table 52: Global Exoskeleton Industry Revenue Million Forecast, by Country 2019 & 2032
- Table 53: China Exoskeleton Industry Revenue (Million) Forecast, by Application 2019 & 2032
- Table 54: Japan Exoskeleton Industry Revenue (Million) Forecast, by Application 2019 & 2032
- Table 55: India Exoskeleton Industry Revenue (Million) Forecast, by Application 2019 & 2032
- Table 56: Australia Exoskeleton Industry Revenue (Million) Forecast, by Application 2019 & 2032
- Table 57: South Korea Exoskeleton Industry Revenue (Million) Forecast, by Application 2019 & 2032
- Table 58: Rest of Asia Pacific Exoskeleton Industry Revenue (Million) Forecast, by Application 2019 & 2032
- Table 59: Global Exoskeleton Industry Revenue Million Forecast, by Treatment Type 2019 & 2032
- Table 60: Global Exoskeleton Industry Revenue Million Forecast, by Body Part Type 2019 & 2032
- Table 61: Global Exoskeleton Industry Revenue Million Forecast, by Product Type 2019 & 2032
- Table 62: Global Exoskeleton Industry Revenue Million Forecast, by Country 2019 & 2032
- Table 63: GCC Exoskeleton Industry Revenue (Million) Forecast, by Application 2019 & 2032
- Table 64: South Africa Exoskeleton Industry Revenue (Million) Forecast, by Application 2019 & 2032
- Table 65: Rest of Middle East and Africa Exoskeleton Industry Revenue (Million) Forecast, by Application 2019 & 2032
- Table 66: Global Exoskeleton Industry Revenue Million Forecast, by Treatment Type 2019 & 2032
- Table 67: Global Exoskeleton Industry Revenue Million Forecast, by Body Part Type 2019 & 2032
- Table 68: Global Exoskeleton Industry Revenue Million Forecast, by Product Type 2019 & 2032
- Table 69: Global Exoskeleton Industry Revenue Million Forecast, by Country 2019 & 2032
- Table 70: Brazil Exoskeleton Industry Revenue (Million) Forecast, by Application 2019 & 2032
- Table 71: Argentina Exoskeleton Industry Revenue (Million) Forecast, by Application 2019 & 2032
- Table 72: Rest of South America Exoskeleton Industry Revenue (Million) Forecast, by Application 2019 & 2032
Frequently Asked Questions
1. What is the projected Compound Annual Growth Rate (CAGR) of the Exoskeleton Industry?
The projected CAGR is approximately 12.50%.
2. Which companies are prominent players in the Exoskeleton Industry?
Key companies in the market include Parker-Hannifin Corp, B-Temia Inc, Rewalk Robotics, Rehab-Robotics Company Limited, Gogoa Mobility Robots, Bioservo Technologies AB, Bionik Laboratories Corp, Cyberdyne Inc, Ekso Bionics Holdings, Bioness Inc.
3. What are the main segments of the Exoskeleton Industry?
The market segments include Treatment Type, Body Part Type, Product Type.
4. Can you provide details about the market size?
The market size is estimated to be USD XX Million as of 2022.
5. What are some drivers contributing to market growth?
Growing Demand from Healthcare Sector for Robotic Rehabilitation; Advancement in Robotic Technologies; Huge Investment for the Development of the Exoskeleton Technology.
6. What are the notable trends driving market growth?
The Mobile Segment is Expected to Hold the Largest Share by Product Type Over the Forecast Period.
7. Are there any restraints impacting market growth?
Risks Involved with Using Exoskeletons Due to Vague Safety Guidelines.
8. Can you provide examples of recent developments in the market?
N/A
9. What pricing options are available for accessing the report?
Pricing options include single-user, multi-user, and enterprise licenses priced at USD 4750, USD 5250, and USD 8750 respectively.
10. Is the market size provided in terms of value or volume?
The market size is provided in terms of value, measured in Million.
11. Are there any specific market keywords associated with the report?
Yes, the market keyword associated with the report is "Exoskeleton Industry," which aids in identifying and referencing the specific market segment covered.
12. How do I determine which pricing option suits my needs best?
The pricing options vary based on user requirements and access needs. Individual users may opt for single-user licenses, while businesses requiring broader access may choose multi-user or enterprise licenses for cost-effective access to the report.
13. Are there any additional resources or data provided in the Exoskeleton Industry report?
While the report offers comprehensive insights, it's advisable to review the specific contents or supplementary materials provided to ascertain if additional resources or data are available.
14. How can I stay updated on further developments or reports in the Exoskeleton Industry?
To stay informed about further developments, trends, and reports in the Exoskeleton Industry, consider subscribing to industry newsletters, following relevant companies and organizations, or regularly checking reputable industry news sources and publications.
Methodology
Step 1 - Identification of Relevant Samples Size from Population Database


Step 2 - Approaches for Defining Global Market Size (Value, Volume* & Price*)

Note*: In applicable scenarios
Step 3 - Data Sources
Primary Research
- Web Analytics
- Survey Reports
- Research Institute
- Latest Research Reports
- Opinion Leaders
Secondary Research
- Annual Reports
- White Paper
- Latest Press Release
- Industry Association
- Paid Database
- Investor Presentations

Step 4 - Data Triangulation
Involves using different sources of information in order to increase the validity of a study
These sources are likely to be stakeholders in a program - participants, other researchers, program staff, other community members, and so on.
Then we put all data in single framework & apply various statistical tools to find out the dynamic on the market.
During the analysis stage, feedback from the stakeholder groups would be compared to determine areas of agreement as well as areas of divergence


