
Key Insights
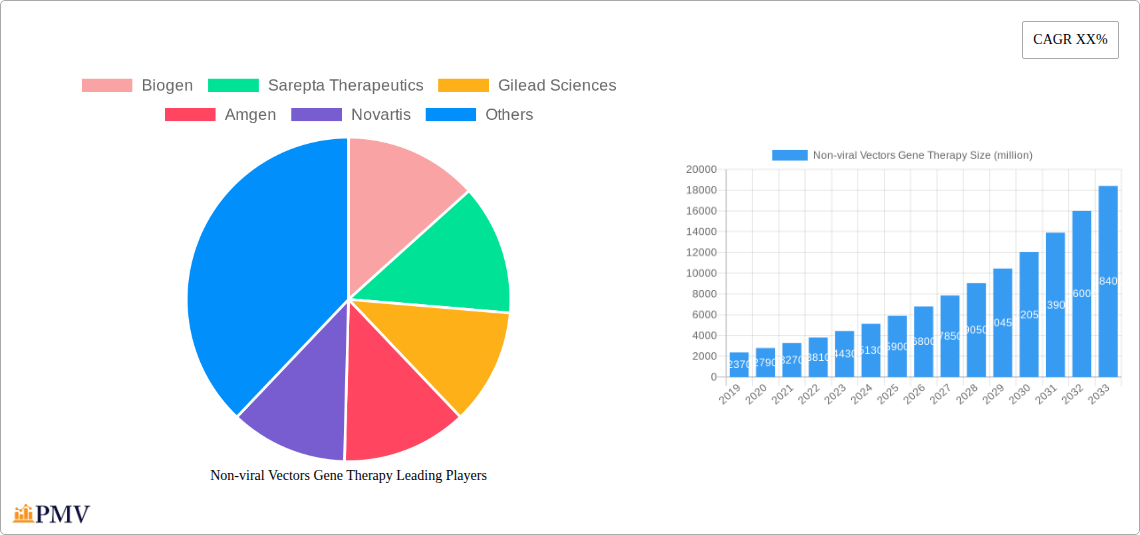
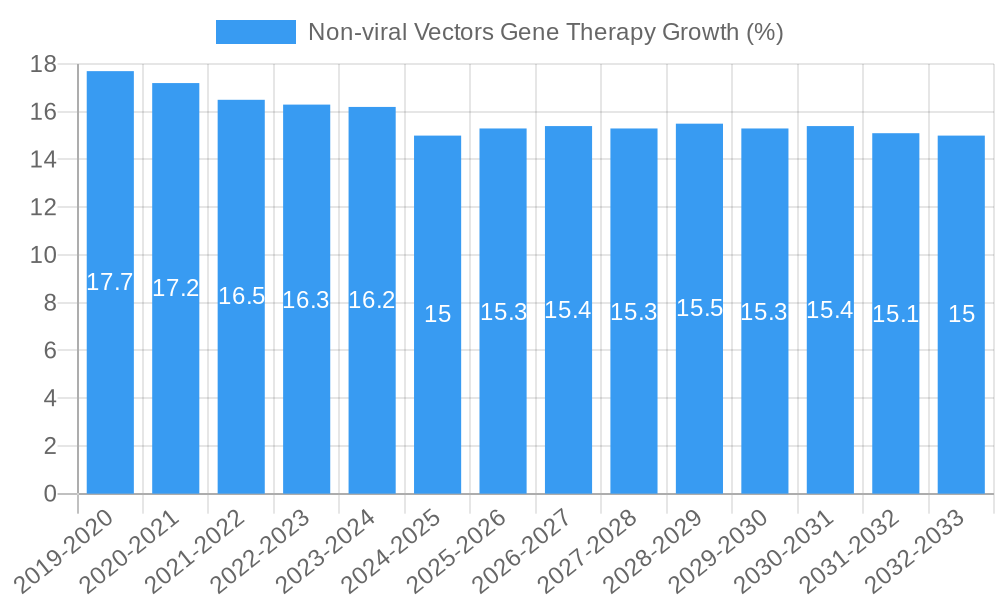
The Non-viral Vectors Gene Therapy market is poised for significant expansion, projected to reach a substantial market size of approximately $6,500 million by 2025, with an estimated Compound Annual Growth Rate (CAGR) of 18% between 2019 and 2033. This robust growth trajectory is primarily fueled by the increasing prevalence of genetic disorders, advancements in gene editing technologies, and a growing emphasis on personalized medicine. The inherent advantages of non-viral vectors, such as their lower immunogenicity and simpler manufacturing processes compared to viral counterparts, are making them increasingly attractive for therapeutic applications. The market is segmented into In Vivo and Ex Vivo applications, with a notable focus on Oligonucleotides and Other Non-viral Vectors, reflecting the diverse and evolving nature of gene therapy development. Leading companies like Biogen, Sarepta Therapeutics, and Gilead Sciences are heavily investing in research and development, driving innovation and expanding the therapeutic pipeline.
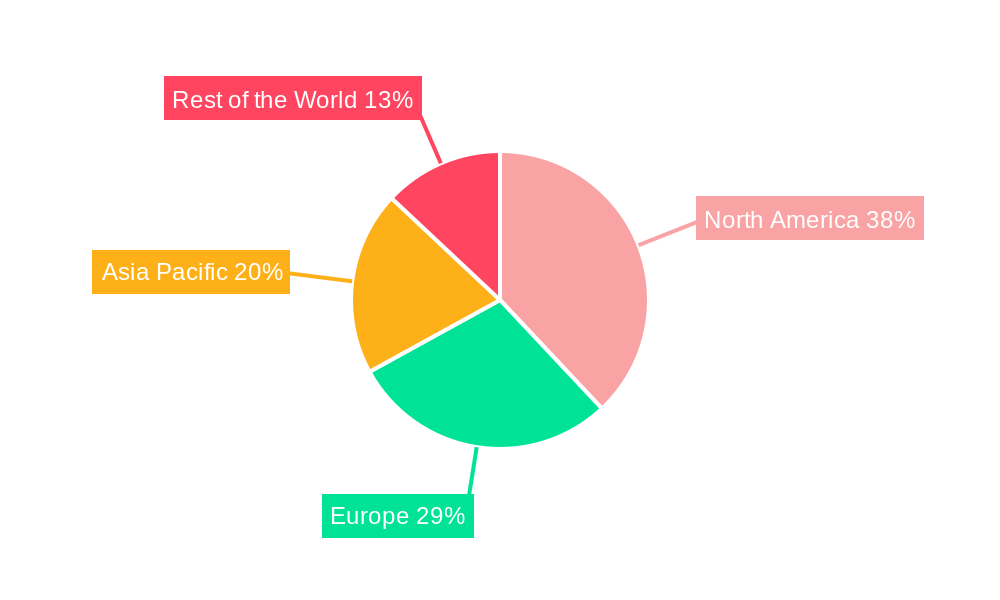
The market's dynamism is further shaped by a confluence of influential drivers and emerging trends. Increased funding for gene therapy research, favorable regulatory landscapes in key regions, and the successful clinical translation of non-viral vector-based therapies are all contributing to market acceleration. However, challenges such as the cost of treatment, the need for enhanced delivery efficiency, and the ongoing development of more sophisticated vector designs present restraining factors that the industry is actively addressing. Geographically, North America, particularly the United States, is anticipated to dominate the market due to its strong research infrastructure and early adoption of novel therapies. Asia Pacific is expected to witness the fastest growth, driven by expanding healthcare investments in China and India and a burgeoning demand for advanced medical treatments. The projected market value, driven by these factors, underscores the immense potential and transformative impact of non-viral vectors in the future of genetic medicine.
Non-viral Vectors Gene Therapy Market: A Comprehensive Report
This in-depth report provides a detailed analysis of the Non-viral Vectors Gene Therapy market, covering critical aspects from market structure and competitive dynamics to emerging trends, regional dominance, and strategic outlook. Designed for industry professionals, investors, and researchers, this report offers actionable insights and forecasts for the period 2019–2033, with a base year of 2025 and a forecast period of 2025–2033. Leverage this comprehensive resource to navigate the rapidly evolving landscape of gene therapy.
Non-viral Vectors Gene Therapy Market Structure & Competitive Dynamics
The Non-viral Vectors Gene Therapy market exhibits a dynamic and increasingly competitive structure, characterized by significant innovation and strategic collaborations. Market concentration varies across different sub-segments, with some areas dominated by a few key players, while others present more fragmented competitive landscapes. The innovation ecosystem is thriving, fueled by extensive research and development in novel non-viral vector technologies, leading to an estimated market value of USD 5,000 million in 2025. Regulatory frameworks, particularly in developed regions, are evolving to accommodate the unique challenges and opportunities presented by gene therapies, creating a nuanced environment for market entry and growth. Product substitutes, though limited in direct gene therapy applications, exist in traditional therapeutic modalities, influencing market adoption rates. End-user trends are strongly driven by the increasing prevalence of genetic disorders and the growing demand for more targeted and effective treatments. Mergers and acquisition (M&A) activities are on the rise, with significant deal values projected to exceed USD 1,500 million as companies seek to consolidate their market positions, acquire novel technologies, and expand their therapeutic pipelines.
- Market Share: Top 5 companies are estimated to hold approximately 60% market share in specific therapeutic areas by 2027.
- M&A Deal Values: Projected to reach USD 2,000 million by 2030, driven by strategic acquisitions to bolster R&D capabilities.
- Innovation Ecosystem: Robust pipeline development with over 300 preclinical and clinical-stage non-viral gene therapy candidates.
Non-viral Vectors Gene Therapy Industry Trends & Insights
The Non-viral Vectors Gene Therapy industry is experiencing robust growth, projected to expand at a Compound Annual Growth Rate (CAGR) of approximately 18% from 2025 to 2033. This significant expansion is primarily driven by advancements in material science, synthetic biology, and a deeper understanding of cellular mechanisms, enabling the development of more efficient and safer non-viral delivery systems. Technological disruptions are constantly reshaping the landscape, with breakthroughs in lipid nanoparticles (LNPs), polymers, and peptide-based vectors offering improved cellular uptake, reduced immunogenicity, and enhanced therapeutic efficacy. Consumer preferences are increasingly leaning towards personalized medicine and gene-based therapies, particularly for rare genetic diseases and conditions with unmet medical needs. The competitive dynamics are intensifying, with established pharmaceutical giants and agile biotech startups alike investing heavily in non-viral gene therapy research and development. Key market penetration is evident in areas like oncology and rare inherited diseases, where the precision and specificity of gene therapy offer a distinct advantage over conventional treatments. The market penetration for non-viral gene therapies is expected to reach 10% of the overall gene therapy market by 2030. The global market size for non-viral vectors gene therapy is estimated to reach USD 15,000 million by 2033.
- Market Growth Drivers: Rising prevalence of genetic disorders, increasing R&D investments, and favorable regulatory pathways.
- Technological Advancements: Development of novel delivery systems like LNPs, biodegradable polymers, and targeted peptides.
- Consumer Preferences: Growing demand for personalized medicine and curative therapies.
- Competitive Landscape: Intense competition, with significant investments from both established players and emerging biotech firms.
- Market Penetration: Expanding reach into oncology, rare diseases, and other therapeutic areas.
Dominant Markets & Segments in Non-viral Vectors Gene Therapy
North America currently dominates the Non-viral Vectors Gene Therapy market, driven by substantial government funding for biomedical research, a strong presence of leading pharmaceutical and biotechnology companies, and a well-established regulatory infrastructure. The United States, in particular, is a focal point for innovation and investment, contributing significantly to market growth. The Application: In Vivo segment is expected to witness the highest growth, accounting for an estimated USD 8,000 million by 2033, owing to the convenience and potential for systemic delivery offered by in vivo approaches. Within the Types segmentation, Other Non-viral Vectors beyond oligonucleotides, encompassing advanced lipid-based and polymeric systems, are projected to capture a larger market share, estimated at USD 6,500 million by 2033, due to their versatility and improving safety profiles. Economic policies supporting biopharmaceutical innovation and robust healthcare infrastructure further solidify North America's leading position.
- Leading Region: North America, with the United States as the primary driver, owing to significant R&D investments and favorable regulatory environments.
- Dominant Application Segment: In Vivo gene therapy, offering potential for widespread therapeutic delivery and an estimated market size of USD 8,000 million by 2033.
- Growing Type Segment: Other Non-viral Vectors (e.g., LNPs, polymers), expected to reach USD 6,500 million by 2033, due to their versatility and advancements in delivery efficiency.
- Key Drivers for Dominance:
- Economic Policies: Government incentives and tax credits for biopharmaceutical research.
- Infrastructure: Advanced research facilities and clinical trial networks.
- Regulatory Frameworks: Evolving pathways for gene therapy approval.
- Investment: High levels of venture capital and corporate investment.
Non-viral Vectors Gene Therapy Product Innovations
Product innovations in Non-viral Vectors Gene Therapy are primarily focused on enhancing delivery efficiency, reducing immunogenicity, and expanding therapeutic applications. Novel lipid nanoparticle (LNP) formulations are demonstrating improved cellular targeting and endosomal escape, leading to more effective gene expression. Polymeric vectors are being engineered for biodegradability and controlled release, minimizing off-target effects. These advancements are opening doors for treatments in previously intractable genetic disorders and complex diseases like cancer. The competitive advantage lies in the development of vectors with superior safety profiles and the ability to deliver larger genetic payloads, pushing the boundaries of what is therapeutically achievable.
Report Segmentation & Scope
This report meticulously segments the Non-viral Vectors Gene Therapy market to provide granular insights into specific growth areas and competitive dynamics. The segmentation is based on key application types and vector technologies, offering a comprehensive view of the market landscape.
- Application: In Vivo This segment focuses on gene therapies delivered directly into the patient's body. It is projected to grow substantially, with an estimated market size of USD 8,000 million by 2033, driven by the development of more efficient and targeted delivery systems for a wide range of genetic conditions.
- Application: Ex Vivo This segment encompasses gene therapies where cells are modified outside the body before being reintroduced to the patient. It is expected to maintain steady growth, with an estimated market size of USD 4,500 million by 2033, particularly for blood disorders and certain immune deficiencies.
- Types: Oligonucleotides This segment includes gene therapies utilizing antisense oligonucleotides, siRNAs, and other nucleic acid-based modalities. The market for oligonucleotides is estimated at USD 4,000 million by 2033, driven by their established therapeutic applications and ongoing development for new targets.
- Types: Other Non-viral Vectors This broad category covers advanced delivery systems such as lipid nanoparticles, polymers, peptides, and exophers. This segment is anticipated to experience the most rapid growth, with an estimated market size of USD 6,500 million by 2033, due to rapid technological advancements and increasing adoption.
Key Drivers of Non-viral Vectors Gene Therapy Growth
The growth of the Non-viral Vectors Gene Therapy market is propelled by a confluence of powerful factors. Technological innovation remains a paramount driver, with continuous advancements in vector design leading to enhanced efficacy and safety. The increasing understanding of genetic diseases and the subsequent identification of novel therapeutic targets create sustained demand for gene therapy solutions. Economic factors, including rising healthcare expenditure and significant investments from venture capital and pharmaceutical companies, are fueling R&D and commercialization efforts. Furthermore, evolving regulatory pathways in key markets are streamlining the approval process for innovative gene therapies, encouraging further investment and market expansion. The decreasing cost of gene sequencing and the growing pipeline of gene therapy candidates also contribute significantly.
- Technological Advancements: Breakthroughs in LNP, polymer, and peptide-based vector development.
- Unmet Medical Needs: Growing demand for curative treatments for rare genetic diseases and complex conditions.
- Investment Landscape: Robust funding from venture capital, private equity, and major pharmaceutical companies.
- Regulatory Support: Evolving and more streamlined approval pathways for gene therapies.
- Disease Understanding: Advancements in genomics and molecular biology identifying new therapeutic targets.
Challenges in the Non-viral Vectors Gene Therapy Sector
Despite its promising growth, the Non-viral Vectors Gene Therapy sector faces several significant challenges that can impede market expansion. Manufacturing scalability and cost-effectiveness remain critical hurdles, with the production of high-quality vectors at scale still being a complex and expensive process, estimated to cost upwards of USD 500,000 per dose for some advanced therapies. Regulatory uncertainty and the need for long-term safety data can slow down the approval of new therapies. Moreover, ensuring equitable access and affordability for patients is a growing concern, as the high cost of these advanced treatments can create significant barriers. Competition from other gene therapy modalities, such as viral vectors, and the potential for off-target effects and immune responses also present ongoing challenges that require continuous research and development.
- Manufacturing Scalability: Challenges in producing high-quality non-viral vectors at a commercial scale.
- Cost of Treatment: High per-dose costs are a significant barrier to patient access and market penetration.
- Regulatory Hurdles: Evolving regulatory frameworks and the need for extensive long-term safety data.
- Competition: Pressure from viral vector gene therapies and other advanced treatment modalities.
- Off-Target Effects: Ongoing need to minimize unintended cellular modifications and immune responses.
Leading Players in the Non-viral Vectors Gene Therapy Market
- Biogen
- Sarepta Therapeutics
- Gilead Sciences
- Amgen
- Novartis
- Orchard Therapeutics
- Spark Therapeutics
- Agc Biologics
- Anges
- Bluebird Bio
- Jazz Pharmaceuticals
- Dynavax Technologies
Key Developments in Non-viral Vectors Gene Therapy Sector
- 2023/Q4: Sarepta Therapeutics announces positive clinical trial data for its Duchenne muscular dystrophy gene therapy candidate utilizing non-viral delivery.
- 2024/Q1: Gilead Sciences expands its gene therapy pipeline through a strategic acquisition of a company specializing in LNP technology, valued at over USD 1,000 million.
- 2024/Q2: AGC Biologics announces significant expansion of its viral and non-viral vector manufacturing capacity to meet growing market demand.
- 2024/Q3: Novartis reports promising results from its phase II trial for a rare genetic liver disease using an innovative non-viral vector approach.
- 2024/Q4: Orchard Therapeutics receives regulatory approval for a novel ex vivo gene therapy treatment for a rare metabolic disorder.
- 2025/Q1: Spark Therapeutics advances its in vivo non-viral gene therapy candidate for a neurological disorder into Phase III trials.
- 2025/Q2: Bluebird Bio partners with a leading polymer manufacturer to develop next-generation biodegradable non-viral vectors.
- 2025/Q3: Amgen announces an R&D collaboration focused on optimizing non-viral delivery systems for oncology applications.
- 2025/Q4: Dynavax Technologies presents preclinical data showcasing the potential of its proprietary non-viral adjuvant technology in gene therapy applications.
- 2026/Q1: Jazz Pharmaceuticals explores novel non-viral gene editing technologies to address unmet needs in hematological malignancies.
Strategic Non-viral Vectors Gene Therapy Market Outlook
The strategic outlook for the Non-viral Vectors Gene Therapy market remains exceptionally bright, fueled by ongoing innovation and a growing pipeline of potential therapeutics. The market is poised for sustained expansion, driven by advancements in LNP and polymeric vector technologies, which offer improved safety and efficacy profiles compared to earlier generations. Strategic collaborations, mergers, and acquisitions will continue to shape the competitive landscape, as companies seek to consolidate their positions and access cutting-edge technologies. The increasing focus on rare diseases and personalized medicine presents significant opportunities for non-viral gene therapies to establish a strong market presence. Furthermore, a more favorable regulatory environment and a growing understanding of genetic diseases will accelerate the development and commercialization of these transformative treatments, projecting a future where non-viral gene therapies play a pivotal role in medicine.
Non-viral Vectors Gene Therapy Segmentation
-
1. Application
- 1.1. In Vivo
- 1.2. Ex Vivo
-
2. Types
- 2.1. Oligonucleotides
- 2.2. Other Non-viral Vectors
Non-viral Vectors Gene Therapy Segmentation By Geography
-
1. North America
- 1.1. United States
- 1.2. Canada
- 1.3. Mexico
-
2. South America
- 2.1. Brazil
- 2.2. Argentina
- 2.3. Rest of South America
-
3. Europe
- 3.1. United Kingdom
- 3.2. Germany
- 3.3. France
- 3.4. Italy
- 3.5. Spain
- 3.6. Russia
- 3.7. Benelux
- 3.8. Nordics
- 3.9. Rest of Europe
-
4. Middle East & Africa
- 4.1. Turkey
- 4.2. Israel
- 4.3. GCC
- 4.4. North Africa
- 4.5. South Africa
- 4.6. Rest of Middle East & Africa
-
5. Asia Pacific
- 5.1. China
- 5.2. India
- 5.3. Japan
- 5.4. South Korea
- 5.5. ASEAN
- 5.6. Oceania
- 5.7. Rest of Asia Pacific
Non-viral Vectors Gene Therapy REPORT HIGHLIGHTS
| Aspects | Details |
|---|---|
| Study Period | 2019-2033 |
| Base Year | 2024 |
| Estimated Year | 2025 |
| Forecast Period | 2025-2033 |
| Historical Period | 2019-2024 |
| Growth Rate | CAGR of XX% from 2019-2033 |
| Segmentation |
|
Table of Contents
- 1. Introduction
- 1.1. Research Scope
- 1.2. Market Segmentation
- 1.3. Research Methodology
- 1.4. Definitions and Assumptions
- 2. Executive Summary
- 2.1. Introduction
- 3. Market Dynamics
- 3.1. Introduction
- 3.2. Market Drivers
- 3.3. Market Restrains
- 3.4. Market Trends
- 4. Market Factor Analysis
- 4.1. Porters Five Forces
- 4.2. Supply/Value Chain
- 4.3. PESTEL analysis
- 4.4. Market Entropy
- 4.5. Patent/Trademark Analysis
- 5. Global Non-viral Vectors Gene Therapy Analysis, Insights and Forecast, 2019-2031
- 5.1. Market Analysis, Insights and Forecast - by Application
- 5.1.1. In Vivo
- 5.1.2. Ex Vivo
- 5.2. Market Analysis, Insights and Forecast - by Types
- 5.2.1. Oligonucleotides
- 5.2.2. Other Non-viral Vectors
- 5.3. Market Analysis, Insights and Forecast - by Region
- 5.3.1. North America
- 5.3.2. South America
- 5.3.3. Europe
- 5.3.4. Middle East & Africa
- 5.3.5. Asia Pacific
- 5.1. Market Analysis, Insights and Forecast - by Application
- 6. North America Non-viral Vectors Gene Therapy Analysis, Insights and Forecast, 2019-2031
- 6.1. Market Analysis, Insights and Forecast - by Application
- 6.1.1. In Vivo
- 6.1.2. Ex Vivo
- 6.2. Market Analysis, Insights and Forecast - by Types
- 6.2.1. Oligonucleotides
- 6.2.2. Other Non-viral Vectors
- 6.1. Market Analysis, Insights and Forecast - by Application
- 7. South America Non-viral Vectors Gene Therapy Analysis, Insights and Forecast, 2019-2031
- 7.1. Market Analysis, Insights and Forecast - by Application
- 7.1.1. In Vivo
- 7.1.2. Ex Vivo
- 7.2. Market Analysis, Insights and Forecast - by Types
- 7.2.1. Oligonucleotides
- 7.2.2. Other Non-viral Vectors
- 7.1. Market Analysis, Insights and Forecast - by Application
- 8. Europe Non-viral Vectors Gene Therapy Analysis, Insights and Forecast, 2019-2031
- 8.1. Market Analysis, Insights and Forecast - by Application
- 8.1.1. In Vivo
- 8.1.2. Ex Vivo
- 8.2. Market Analysis, Insights and Forecast - by Types
- 8.2.1. Oligonucleotides
- 8.2.2. Other Non-viral Vectors
- 8.1. Market Analysis, Insights and Forecast - by Application
- 9. Middle East & Africa Non-viral Vectors Gene Therapy Analysis, Insights and Forecast, 2019-2031
- 9.1. Market Analysis, Insights and Forecast - by Application
- 9.1.1. In Vivo
- 9.1.2. Ex Vivo
- 9.2. Market Analysis, Insights and Forecast - by Types
- 9.2.1. Oligonucleotides
- 9.2.2. Other Non-viral Vectors
- 9.1. Market Analysis, Insights and Forecast - by Application
- 10. Asia Pacific Non-viral Vectors Gene Therapy Analysis, Insights and Forecast, 2019-2031
- 10.1. Market Analysis, Insights and Forecast - by Application
- 10.1.1. In Vivo
- 10.1.2. Ex Vivo
- 10.2. Market Analysis, Insights and Forecast - by Types
- 10.2.1. Oligonucleotides
- 10.2.2. Other Non-viral Vectors
- 10.1. Market Analysis, Insights and Forecast - by Application
- 11. Competitive Analysis
- 11.1. Global Market Share Analysis 2024
- 11.2. Company Profiles
- 11.2.1 Biogen
- 11.2.1.1. Overview
- 11.2.1.2. Products
- 11.2.1.3. SWOT Analysis
- 11.2.1.4. Recent Developments
- 11.2.1.5. Financials (Based on Availability)
- 11.2.2 Sarepta Therapeutics
- 11.2.2.1. Overview
- 11.2.2.2. Products
- 11.2.2.3. SWOT Analysis
- 11.2.2.4. Recent Developments
- 11.2.2.5. Financials (Based on Availability)
- 11.2.3 Gilead Sciences
- 11.2.3.1. Overview
- 11.2.3.2. Products
- 11.2.3.3. SWOT Analysis
- 11.2.3.4. Recent Developments
- 11.2.3.5. Financials (Based on Availability)
- 11.2.4 Amgen
- 11.2.4.1. Overview
- 11.2.4.2. Products
- 11.2.4.3. SWOT Analysis
- 11.2.4.4. Recent Developments
- 11.2.4.5. Financials (Based on Availability)
- 11.2.5 Novartis
- 11.2.5.1. Overview
- 11.2.5.2. Products
- 11.2.5.3. SWOT Analysis
- 11.2.5.4. Recent Developments
- 11.2.5.5. Financials (Based on Availability)
- 11.2.6 Orchard Therapeutics
- 11.2.6.1. Overview
- 11.2.6.2. Products
- 11.2.6.3. SWOT Analysis
- 11.2.6.4. Recent Developments
- 11.2.6.5. Financials (Based on Availability)
- 11.2.7 Spark Therapeutics
- 11.2.7.1. Overview
- 11.2.7.2. Products
- 11.2.7.3. SWOT Analysis
- 11.2.7.4. Recent Developments
- 11.2.7.5. Financials (Based on Availability)
- 11.2.8 Agc Biologics
- 11.2.8.1. Overview
- 11.2.8.2. Products
- 11.2.8.3. SWOT Analysis
- 11.2.8.4. Recent Developments
- 11.2.8.5. Financials (Based on Availability)
- 11.2.9 Anges
- 11.2.9.1. Overview
- 11.2.9.2. Products
- 11.2.9.3. SWOT Analysis
- 11.2.9.4. Recent Developments
- 11.2.9.5. Financials (Based on Availability)
- 11.2.10 Bluebird Bio
- 11.2.10.1. Overview
- 11.2.10.2. Products
- 11.2.10.3. SWOT Analysis
- 11.2.10.4. Recent Developments
- 11.2.10.5. Financials (Based on Availability)
- 11.2.11 Jazz Pharmaceuticals
- 11.2.11.1. Overview
- 11.2.11.2. Products
- 11.2.11.3. SWOT Analysis
- 11.2.11.4. Recent Developments
- 11.2.11.5. Financials (Based on Availability)
- 11.2.12 Dynavax Technologies
- 11.2.12.1. Overview
- 11.2.12.2. Products
- 11.2.12.3. SWOT Analysis
- 11.2.12.4. Recent Developments
- 11.2.12.5. Financials (Based on Availability)
- 11.2.1 Biogen
List of Figures
- Figure 1: Global Non-viral Vectors Gene Therapy Revenue Breakdown (million, %) by Region 2024 & 2032
- Figure 2: North America Non-viral Vectors Gene Therapy Revenue (million), by Application 2024 & 2032
- Figure 3: North America Non-viral Vectors Gene Therapy Revenue Share (%), by Application 2024 & 2032
- Figure 4: North America Non-viral Vectors Gene Therapy Revenue (million), by Types 2024 & 2032
- Figure 5: North America Non-viral Vectors Gene Therapy Revenue Share (%), by Types 2024 & 2032
- Figure 6: North America Non-viral Vectors Gene Therapy Revenue (million), by Country 2024 & 2032
- Figure 7: North America Non-viral Vectors Gene Therapy Revenue Share (%), by Country 2024 & 2032
- Figure 8: South America Non-viral Vectors Gene Therapy Revenue (million), by Application 2024 & 2032
- Figure 9: South America Non-viral Vectors Gene Therapy Revenue Share (%), by Application 2024 & 2032
- Figure 10: South America Non-viral Vectors Gene Therapy Revenue (million), by Types 2024 & 2032
- Figure 11: South America Non-viral Vectors Gene Therapy Revenue Share (%), by Types 2024 & 2032
- Figure 12: South America Non-viral Vectors Gene Therapy Revenue (million), by Country 2024 & 2032
- Figure 13: South America Non-viral Vectors Gene Therapy Revenue Share (%), by Country 2024 & 2032
- Figure 14: Europe Non-viral Vectors Gene Therapy Revenue (million), by Application 2024 & 2032
- Figure 15: Europe Non-viral Vectors Gene Therapy Revenue Share (%), by Application 2024 & 2032
- Figure 16: Europe Non-viral Vectors Gene Therapy Revenue (million), by Types 2024 & 2032
- Figure 17: Europe Non-viral Vectors Gene Therapy Revenue Share (%), by Types 2024 & 2032
- Figure 18: Europe Non-viral Vectors Gene Therapy Revenue (million), by Country 2024 & 2032
- Figure 19: Europe Non-viral Vectors Gene Therapy Revenue Share (%), by Country 2024 & 2032
- Figure 20: Middle East & Africa Non-viral Vectors Gene Therapy Revenue (million), by Application 2024 & 2032
- Figure 21: Middle East & Africa Non-viral Vectors Gene Therapy Revenue Share (%), by Application 2024 & 2032
- Figure 22: Middle East & Africa Non-viral Vectors Gene Therapy Revenue (million), by Types 2024 & 2032
- Figure 23: Middle East & Africa Non-viral Vectors Gene Therapy Revenue Share (%), by Types 2024 & 2032
- Figure 24: Middle East & Africa Non-viral Vectors Gene Therapy Revenue (million), by Country 2024 & 2032
- Figure 25: Middle East & Africa Non-viral Vectors Gene Therapy Revenue Share (%), by Country 2024 & 2032
- Figure 26: Asia Pacific Non-viral Vectors Gene Therapy Revenue (million), by Application 2024 & 2032
- Figure 27: Asia Pacific Non-viral Vectors Gene Therapy Revenue Share (%), by Application 2024 & 2032
- Figure 28: Asia Pacific Non-viral Vectors Gene Therapy Revenue (million), by Types 2024 & 2032
- Figure 29: Asia Pacific Non-viral Vectors Gene Therapy Revenue Share (%), by Types 2024 & 2032
- Figure 30: Asia Pacific Non-viral Vectors Gene Therapy Revenue (million), by Country 2024 & 2032
- Figure 31: Asia Pacific Non-viral Vectors Gene Therapy Revenue Share (%), by Country 2024 & 2032
List of Tables
- Table 1: Global Non-viral Vectors Gene Therapy Revenue million Forecast, by Region 2019 & 2032
- Table 2: Global Non-viral Vectors Gene Therapy Revenue million Forecast, by Application 2019 & 2032
- Table 3: Global Non-viral Vectors Gene Therapy Revenue million Forecast, by Types 2019 & 2032
- Table 4: Global Non-viral Vectors Gene Therapy Revenue million Forecast, by Region 2019 & 2032
- Table 5: Global Non-viral Vectors Gene Therapy Revenue million Forecast, by Application 2019 & 2032
- Table 6: Global Non-viral Vectors Gene Therapy Revenue million Forecast, by Types 2019 & 2032
- Table 7: Global Non-viral Vectors Gene Therapy Revenue million Forecast, by Country 2019 & 2032
- Table 8: United States Non-viral Vectors Gene Therapy Revenue (million) Forecast, by Application 2019 & 2032
- Table 9: Canada Non-viral Vectors Gene Therapy Revenue (million) Forecast, by Application 2019 & 2032
- Table 10: Mexico Non-viral Vectors Gene Therapy Revenue (million) Forecast, by Application 2019 & 2032
- Table 11: Global Non-viral Vectors Gene Therapy Revenue million Forecast, by Application 2019 & 2032
- Table 12: Global Non-viral Vectors Gene Therapy Revenue million Forecast, by Types 2019 & 2032
- Table 13: Global Non-viral Vectors Gene Therapy Revenue million Forecast, by Country 2019 & 2032
- Table 14: Brazil Non-viral Vectors Gene Therapy Revenue (million) Forecast, by Application 2019 & 2032
- Table 15: Argentina Non-viral Vectors Gene Therapy Revenue (million) Forecast, by Application 2019 & 2032
- Table 16: Rest of South America Non-viral Vectors Gene Therapy Revenue (million) Forecast, by Application 2019 & 2032
- Table 17: Global Non-viral Vectors Gene Therapy Revenue million Forecast, by Application 2019 & 2032
- Table 18: Global Non-viral Vectors Gene Therapy Revenue million Forecast, by Types 2019 & 2032
- Table 19: Global Non-viral Vectors Gene Therapy Revenue million Forecast, by Country 2019 & 2032
- Table 20: United Kingdom Non-viral Vectors Gene Therapy Revenue (million) Forecast, by Application 2019 & 2032
- Table 21: Germany Non-viral Vectors Gene Therapy Revenue (million) Forecast, by Application 2019 & 2032
- Table 22: France Non-viral Vectors Gene Therapy Revenue (million) Forecast, by Application 2019 & 2032
- Table 23: Italy Non-viral Vectors Gene Therapy Revenue (million) Forecast, by Application 2019 & 2032
- Table 24: Spain Non-viral Vectors Gene Therapy Revenue (million) Forecast, by Application 2019 & 2032
- Table 25: Russia Non-viral Vectors Gene Therapy Revenue (million) Forecast, by Application 2019 & 2032
- Table 26: Benelux Non-viral Vectors Gene Therapy Revenue (million) Forecast, by Application 2019 & 2032
- Table 27: Nordics Non-viral Vectors Gene Therapy Revenue (million) Forecast, by Application 2019 & 2032
- Table 28: Rest of Europe Non-viral Vectors Gene Therapy Revenue (million) Forecast, by Application 2019 & 2032
- Table 29: Global Non-viral Vectors Gene Therapy Revenue million Forecast, by Application 2019 & 2032
- Table 30: Global Non-viral Vectors Gene Therapy Revenue million Forecast, by Types 2019 & 2032
- Table 31: Global Non-viral Vectors Gene Therapy Revenue million Forecast, by Country 2019 & 2032
- Table 32: Turkey Non-viral Vectors Gene Therapy Revenue (million) Forecast, by Application 2019 & 2032
- Table 33: Israel Non-viral Vectors Gene Therapy Revenue (million) Forecast, by Application 2019 & 2032
- Table 34: GCC Non-viral Vectors Gene Therapy Revenue (million) Forecast, by Application 2019 & 2032
- Table 35: North Africa Non-viral Vectors Gene Therapy Revenue (million) Forecast, by Application 2019 & 2032
- Table 36: South Africa Non-viral Vectors Gene Therapy Revenue (million) Forecast, by Application 2019 & 2032
- Table 37: Rest of Middle East & Africa Non-viral Vectors Gene Therapy Revenue (million) Forecast, by Application 2019 & 2032
- Table 38: Global Non-viral Vectors Gene Therapy Revenue million Forecast, by Application 2019 & 2032
- Table 39: Global Non-viral Vectors Gene Therapy Revenue million Forecast, by Types 2019 & 2032
- Table 40: Global Non-viral Vectors Gene Therapy Revenue million Forecast, by Country 2019 & 2032
- Table 41: China Non-viral Vectors Gene Therapy Revenue (million) Forecast, by Application 2019 & 2032
- Table 42: India Non-viral Vectors Gene Therapy Revenue (million) Forecast, by Application 2019 & 2032
- Table 43: Japan Non-viral Vectors Gene Therapy Revenue (million) Forecast, by Application 2019 & 2032
- Table 44: South Korea Non-viral Vectors Gene Therapy Revenue (million) Forecast, by Application 2019 & 2032
- Table 45: ASEAN Non-viral Vectors Gene Therapy Revenue (million) Forecast, by Application 2019 & 2032
- Table 46: Oceania Non-viral Vectors Gene Therapy Revenue (million) Forecast, by Application 2019 & 2032
- Table 47: Rest of Asia Pacific Non-viral Vectors Gene Therapy Revenue (million) Forecast, by Application 2019 & 2032
Frequently Asked Questions
1. What is the projected Compound Annual Growth Rate (CAGR) of the Non-viral Vectors Gene Therapy?
The projected CAGR is approximately XX%.
2. Which companies are prominent players in the Non-viral Vectors Gene Therapy?
Key companies in the market include Biogen, Sarepta Therapeutics, Gilead Sciences, Amgen, Novartis, Orchard Therapeutics, Spark Therapeutics, Agc Biologics, Anges, Bluebird Bio, Jazz Pharmaceuticals, Dynavax Technologies.
3. What are the main segments of the Non-viral Vectors Gene Therapy?
The market segments include Application, Types.
4. Can you provide details about the market size?
The market size is estimated to be USD XXX million as of 2022.
5. What are some drivers contributing to market growth?
N/A
6. What are the notable trends driving market growth?
N/A
7. Are there any restraints impacting market growth?
N/A
8. Can you provide examples of recent developments in the market?
N/A
9. What pricing options are available for accessing the report?
Pricing options include single-user, multi-user, and enterprise licenses priced at USD 4900.00, USD 7350.00, and USD 9800.00 respectively.
10. Is the market size provided in terms of value or volume?
The market size is provided in terms of value, measured in million.
11. Are there any specific market keywords associated with the report?
Yes, the market keyword associated with the report is "Non-viral Vectors Gene Therapy," which aids in identifying and referencing the specific market segment covered.
12. How do I determine which pricing option suits my needs best?
The pricing options vary based on user requirements and access needs. Individual users may opt for single-user licenses, while businesses requiring broader access may choose multi-user or enterprise licenses for cost-effective access to the report.
13. Are there any additional resources or data provided in the Non-viral Vectors Gene Therapy report?
While the report offers comprehensive insights, it's advisable to review the specific contents or supplementary materials provided to ascertain if additional resources or data are available.
14. How can I stay updated on further developments or reports in the Non-viral Vectors Gene Therapy?
To stay informed about further developments, trends, and reports in the Non-viral Vectors Gene Therapy, consider subscribing to industry newsletters, following relevant companies and organizations, or regularly checking reputable industry news sources and publications.
Methodology
Step 1 - Identification of Relevant Samples Size from Population Database


Step 2 - Approaches for Defining Global Market Size (Value, Volume* & Price*)

Note*: In applicable scenarios
Step 3 - Data Sources
Primary Research
- Web Analytics
- Survey Reports
- Research Institute
- Latest Research Reports
- Opinion Leaders
Secondary Research
- Annual Reports
- White Paper
- Latest Press Release
- Industry Association
- Paid Database
- Investor Presentations

Step 4 - Data Triangulation
Involves using different sources of information in order to increase the validity of a study
These sources are likely to be stakeholders in a program - participants, other researchers, program staff, other community members, and so on.
Then we put all data in single framework & apply various statistical tools to find out the dynamic on the market.
During the analysis stage, feedback from the stakeholder groups would be compared to determine areas of agreement as well as areas of divergence


