
Key Insights
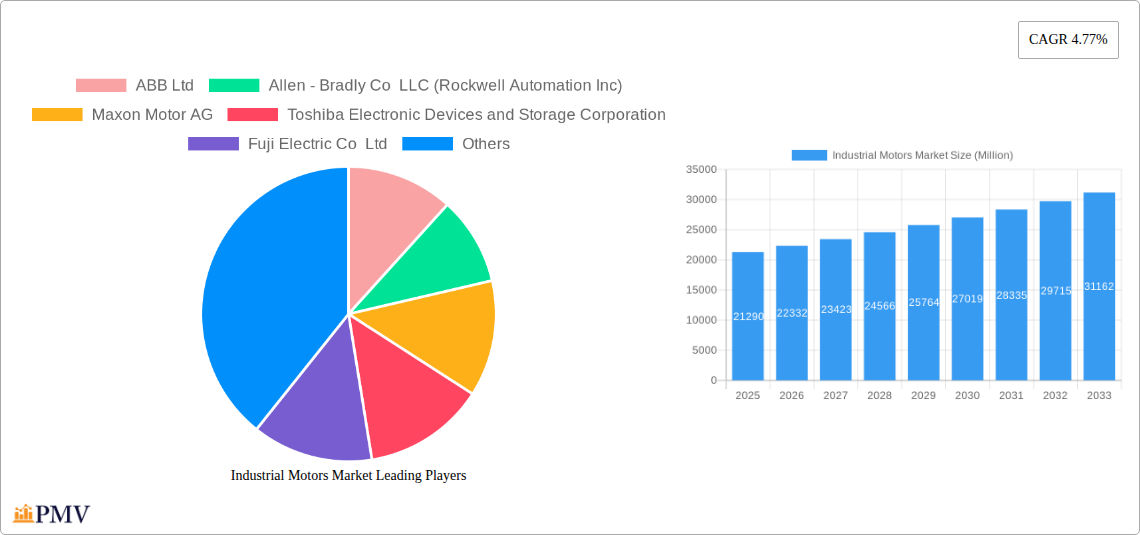
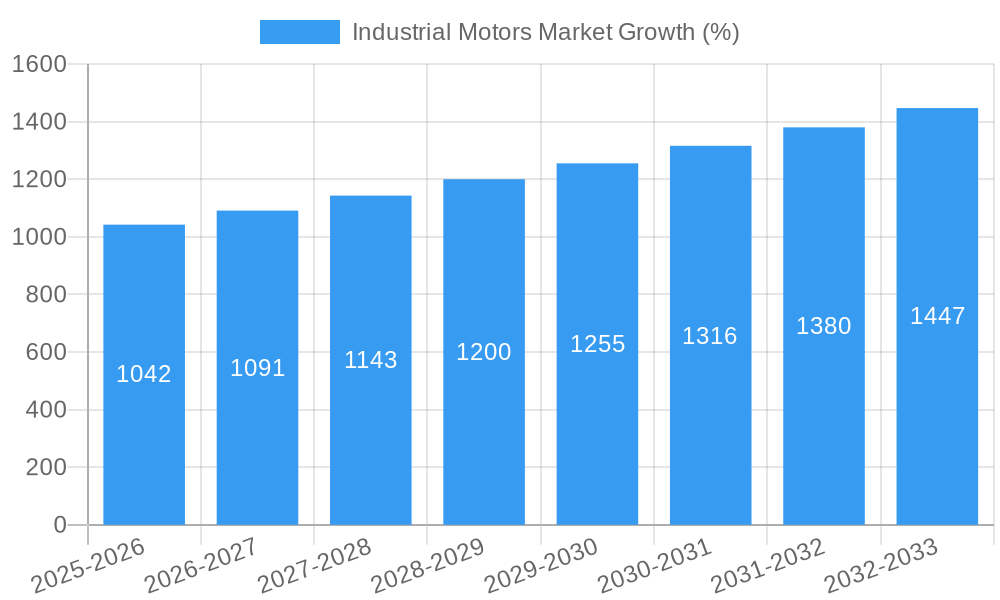
The global industrial motors market, valued at $21.29 billion in 2025, is projected to experience robust growth, driven by increasing industrial automation across diverse sectors. A Compound Annual Growth Rate (CAGR) of 4.77% from 2025 to 2033 indicates a significant expansion, fueled by the rising demand for energy-efficient motors in applications like oil and gas extraction, power generation, and manufacturing. The shift towards Industry 4.0 and smart manufacturing initiatives further accelerates this growth, necessitating advanced motor technologies like servo and electronically commutated motors (EC motors) for precise control and enhanced productivity. Growth is particularly strong in regions like Asia-Pacific, driven by rapid industrialization and infrastructure development in countries such as China and India. While the market faces potential restraints from fluctuating raw material prices and supply chain disruptions, the long-term outlook remains positive, supported by ongoing technological advancements and increasing government investments in sustainable industrial practices.
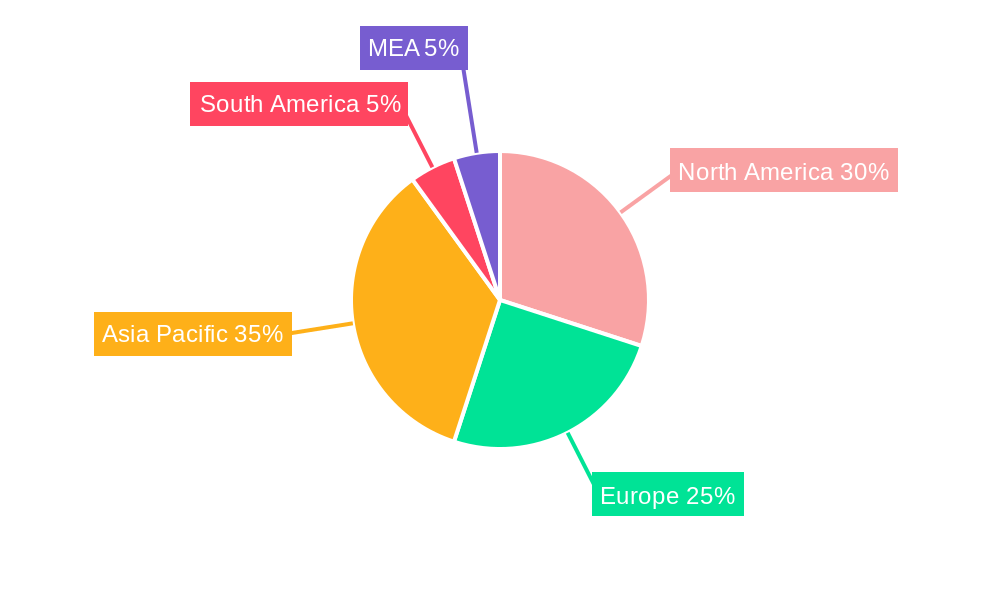
The market segmentation reveals key trends. AC motors currently dominate, but the adoption of DC and EC motors is increasing due to their superior efficiency and control capabilities. High-voltage motors are prevalent in heavy-duty industrial applications, while low-voltage motors find widespread use in lighter applications. End-user sectors like oil and gas, and power generation are key drivers, while the chemicals and petrochemicals sector is also showing significant growth potential. Major players like ABB, Siemens, and Nidec are actively investing in R&D and strategic partnerships to maintain their market leadership, while emerging companies are innovating to provide niche solutions and compete effectively. The geographical distribution reflects varying levels of industrial development, with North America and Europe currently holding substantial market share, but Asia-Pacific demonstrating the highest growth potential over the forecast period. The competitive landscape is dynamic, characterized by both established players and innovative entrants continuously seeking to enhance their product offerings and expand their market reach.
Industrial Motors Market: A Comprehensive Report (2019-2033)
This detailed report provides a comprehensive analysis of the global Industrial Motors Market, covering the period from 2019 to 2033. It offers in-depth insights into market segmentation, competitive dynamics, key trends, and future growth prospects, empowering businesses to make informed strategic decisions. The report leverages extensive market research and data analysis to deliver actionable intelligence for industry professionals. The base year for this report is 2025, with estimations for 2025 and forecasts extending to 2033. The historical period covered is 2019-2024. The total market size is projected to reach xx Million by 2033, exhibiting a CAGR of xx% during the forecast period.
Industrial Motors Market Market Structure & Competitive Dynamics
The industrial motors market is characterized by a moderately concentrated structure, with several major players holding significant market share. The top 10 companies—including ABB Ltd, Allen-Bradley Co LLC (Rockwell Automation Inc), Maxon Motor AG, Toshiba Electronic Devices and Storage Corporation, Fuji Electric Co Ltd, ATB Austria Antriebstechnik AG, Siemens, Nidec Industrial Solutions, Johnson Electric Holdings Limited, and others—account for approximately xx% of the global market in 2025. Competition is intense, driven by technological innovation, product differentiation, and pricing strategies.
Innovation ecosystems are robust, with significant R&D investments focused on energy efficiency, advanced control systems, and smart motor technologies. Regulatory frameworks, particularly those related to energy efficiency and environmental standards, play a crucial role in shaping market dynamics. Product substitutes, such as hydraulic and pneumatic systems, pose a limited threat due to the advantages of electric motors in terms of precision, efficiency, and control. End-user trends towards automation and digitalization are key growth drivers.
M&A activity has been significant, with several notable deals shaping the market landscape. For example, ABB's acquisition of Siemens' low-voltage NEMA motor business significantly strengthened ABB's market position. The total value of M&A deals in the industrial motors market during the historical period (2019-2024) is estimated at xx Million. Further consolidation is anticipated in the coming years.
Industrial Motors Market Industry Trends & Insights
The industrial motors market is experiencing robust growth, driven by several key factors. The increasing adoption of automation and Industry 4.0 technologies across various end-user industries is a major catalyst. The rising demand for energy-efficient motors, propelled by stringent environmental regulations and the need for cost optimization, further fuels market expansion. Technological advancements, such as the development of high-efficiency motors, advanced control systems, and smart motor technologies, are transforming the industry. The growth is also influenced by factors like infrastructure development in emerging economies and rising investments in renewable energy projects. The market is witnessing a gradual shift towards high-voltage and medium-voltage motors due to their superior performance in demanding industrial applications. Consumer preferences are increasingly leaning towards customized solutions, leading manufacturers to focus on providing bespoke motor solutions to meet specific application requirements. The competitive landscape is dynamic, with companies investing heavily in R&D and strategic partnerships to maintain their market positions. The global industrial motors market is projected to exhibit a CAGR of xx% from 2025 to 2033. Market penetration of energy-efficient motors is expected to reach xx% by 2033, driven by stringent regulatory standards and increasing awareness of sustainability.
Dominant Markets & Segments in Industrial Motors Market
Leading Region: North America currently holds the largest market share, followed by Europe and Asia-Pacific. Strong industrial activity and investments in infrastructure development in North America contribute to its dominance.
Leading Country: The United States holds a significant share within North America due to its mature industrial sector and advanced technological capabilities.
Dominant Motor Type: Alternating Current (AC) motors currently dominate the market owing to their robustness, cost-effectiveness, and widespread applicability.
Dominant Voltage: Low-voltage motors command the largest segment due to their suitability for a wide range of applications across various industries.
Dominant End-User: The oil and gas, and power generation sectors represent significant end-users due to their intensive use of industrial motors. Growth drivers include:
- Oil and Gas: Increasing exploration and production activities, coupled with the need for enhanced efficiency and automation.
- Power Generation: Investments in renewable energy infrastructure and upgrades to existing power plants.
- Mining and Metals: Growth in mining and metals production, requiring robust and high-performance motors.
- Water and Wastewater Management: Rising demand for improved water infrastructure and treatment facilities.
- Chemicals and Petrochemicals: Expansion of the chemical and petrochemical industries and the implementation of advanced process control systems.
- Discrete Manufacturing: The continuous automation and modernization of manufacturing processes.
Industrial Motors Market Product Innovations
Recent product developments in the industrial motors market have focused on enhanced energy efficiency, advanced control systems, and improved durability. Smart motor technologies with integrated sensors and data analytics capabilities are gaining traction, enabling predictive maintenance and optimization of motor performance. These innovations offer significant competitive advantages by improving operational efficiency, reducing downtime, and enhancing overall system reliability. The market is seeing the integration of AI and machine learning in motor design and control, allowing for optimized performance and reduced energy consumption. This focus aligns with the growing demand for sustainable and efficient industrial solutions.
Report Segmentation & Scope
This report segments the industrial motors market based on motor type (Alternating Current (AC) Motors, Direct Current (DC) Motor, Other Types of Motors (Servo and Electronically Commutated Motors (EC))), voltage (High Voltage, Medium Voltage, Low Voltage), and end-user (Oil and Gas, Power Generation, Mining and Metals, Water and Wastewater Management, Chemicals and Petrochemicals, Discrete Manufacturing, Other End Users). Each segment's growth projections, market size, and competitive dynamics are analyzed in detail, providing a comprehensive understanding of the market landscape. The AC motor segment is expected to maintain its dominance due to its cost-effectiveness and wide applications, while the other types of motors segment is projected to experience significant growth due to the increasing demand for precision and control in various applications. High-voltage motors will grow at a slower pace than the medium and low-voltage segments.
Key Drivers of Industrial Motors Market Growth
Several factors are driving the growth of the industrial motors market. These include the increasing adoption of automation technologies across various industries, growing demand for energy-efficient motors, and continuous technological advancements in motor design and control systems. Government regulations promoting energy efficiency and sustainability are also playing a crucial role. Furthermore, infrastructure development in emerging economies and the expansion of the renewable energy sector are contributing significantly to market growth.
Challenges in the Industrial Motors Market Sector
Despite the positive growth outlook, the industrial motors market faces several challenges. These include supply chain disruptions, rising raw material costs, and intense competition among manufacturers. Regulatory compliance requirements can also pose difficulties. Furthermore, the cyclical nature of certain end-user industries can impact demand, creating fluctuations in the market. These factors can lead to price volatility and affect the profitability of companies operating in the sector.
Leading Players in the Industrial Motors Market Market
- ABB Ltd
- Allen-Bradley Co LLC (Rockwell Automation Inc)
- Maxon Motor AG
- Toshiba Electronic Devices and Storage Corporation
- Fuji Electric Co Ltd
- ATB Austria Antriebstechnik AG
- Siemens
- Nidec Industrial Solutions
- Johnson Electric Holdings Limited
- Arc Systems Inc
- Emerson Electric Co
- Franklin Electric Co Inc
- Ametek Inc
- Menzel Elektromotoren Gmb
- Wolong Industrial Motors
Key Developments in Industrial Motors Market Sector
- May 2023: ABB completed its acquisition of Siemens' low-voltage NEMA motor business, strengthening its market position.
- March 2023: Siemens launched "Innomotics," a new company encompassing its low- to high-voltage motor businesses.
- September 2022: Mitsubishi Electric and TMEIC collaborated to develop an AI-powered electrical motor design support system, accelerating design processes.
Strategic Industrial Motors Market Market Outlook
The industrial motors market is poised for continued growth, driven by the ongoing trend of automation and digitalization across various industries. Emerging technologies, such as AI-powered motor control and predictive maintenance systems, will further enhance efficiency and reduce operational costs. Strategic opportunities exist for manufacturers who can develop innovative, energy-efficient, and customized motor solutions to meet the evolving demands of their customers. The market's future potential is strong, particularly in developing economies with growing industrialization rates and infrastructure investments.
Industrial Motors Market Segmentation
-
1. Type of Motor
- 1.1. Alternating Current (AC) Motors
- 1.2. Direct Current (DC) Motor
- 1.3. Other Ty
-
2. Voltage
- 2.1. High Voltage
- 2.2. Medium Voltage
- 2.3. Low Voltage
-
3. End User
- 3.1. Oil & Gas
- 3.2. Power Generation
- 3.3. Mining & Metals
- 3.4. Water & Wastewater Management
- 3.5. Chemicals & Petrochemicals
- 3.6. Discrete Manufacturing
- 3.7. Other End Users
Industrial Motors Market Segmentation By Geography
- 1. North America
- 2. Europe
- 3. Asia
- 4. Australia and New Zealand
- 5. Latin America
- 6. Middle East and Africa
Industrial Motors Market REPORT HIGHLIGHTS
| Aspects | Details |
|---|---|
| Study Period | 2019-2033 |
| Base Year | 2024 |
| Estimated Year | 2025 |
| Forecast Period | 2025-2033 |
| Historical Period | 2019-2024 |
| Growth Rate | CAGR of 4.77% from 2019-2033 |
| Segmentation |
|
Table of Contents
- 1. Introduction
- 1.1. Research Scope
- 1.2. Market Segmentation
- 1.3. Research Methodology
- 1.4. Definitions and Assumptions
- 2. Executive Summary
- 2.1. Introduction
- 3. Market Dynamics
- 3.1. Introduction
- 3.2. Market Drivers
- 3.2.1. Demand for Energy Efficiency Owing to Government Regulations; Growing Shift towards Smart Motors
- 3.3. Market Restrains
- 3.3.1. High Switching Costs May Act as a Restraint
- 3.4. Market Trends
- 3.4.1. Low Voltage to Hold Significant Market Share
- 4. Market Factor Analysis
- 4.1. Porters Five Forces
- 4.2. Supply/Value Chain
- 4.3. PESTEL analysis
- 4.4. Market Entropy
- 4.5. Patent/Trademark Analysis
- 5. Global Industrial Motors Market Analysis, Insights and Forecast, 2019-2031
- 5.1. Market Analysis, Insights and Forecast - by Type of Motor
- 5.1.1. Alternating Current (AC) Motors
- 5.1.2. Direct Current (DC) Motor
- 5.1.3. Other Ty
- 5.2. Market Analysis, Insights and Forecast - by Voltage
- 5.2.1. High Voltage
- 5.2.2. Medium Voltage
- 5.2.3. Low Voltage
- 5.3. Market Analysis, Insights and Forecast - by End User
- 5.3.1. Oil & Gas
- 5.3.2. Power Generation
- 5.3.3. Mining & Metals
- 5.3.4. Water & Wastewater Management
- 5.3.5. Chemicals & Petrochemicals
- 5.3.6. Discrete Manufacturing
- 5.3.7. Other End Users
- 5.4. Market Analysis, Insights and Forecast - by Region
- 5.4.1. North America
- 5.4.2. Europe
- 5.4.3. Asia
- 5.4.4. Australia and New Zealand
- 5.4.5. Latin America
- 5.4.6. Middle East and Africa
- 5.1. Market Analysis, Insights and Forecast - by Type of Motor
- 6. North America Industrial Motors Market Analysis, Insights and Forecast, 2019-2031
- 6.1. Market Analysis, Insights and Forecast - by Type of Motor
- 6.1.1. Alternating Current (AC) Motors
- 6.1.2. Direct Current (DC) Motor
- 6.1.3. Other Ty
- 6.2. Market Analysis, Insights and Forecast - by Voltage
- 6.2.1. High Voltage
- 6.2.2. Medium Voltage
- 6.2.3. Low Voltage
- 6.3. Market Analysis, Insights and Forecast - by End User
- 6.3.1. Oil & Gas
- 6.3.2. Power Generation
- 6.3.3. Mining & Metals
- 6.3.4. Water & Wastewater Management
- 6.3.5. Chemicals & Petrochemicals
- 6.3.6. Discrete Manufacturing
- 6.3.7. Other End Users
- 6.1. Market Analysis, Insights and Forecast - by Type of Motor
- 7. Europe Industrial Motors Market Analysis, Insights and Forecast, 2019-2031
- 7.1. Market Analysis, Insights and Forecast - by Type of Motor
- 7.1.1. Alternating Current (AC) Motors
- 7.1.2. Direct Current (DC) Motor
- 7.1.3. Other Ty
- 7.2. Market Analysis, Insights and Forecast - by Voltage
- 7.2.1. High Voltage
- 7.2.2. Medium Voltage
- 7.2.3. Low Voltage
- 7.3. Market Analysis, Insights and Forecast - by End User
- 7.3.1. Oil & Gas
- 7.3.2. Power Generation
- 7.3.3. Mining & Metals
- 7.3.4. Water & Wastewater Management
- 7.3.5. Chemicals & Petrochemicals
- 7.3.6. Discrete Manufacturing
- 7.3.7. Other End Users
- 7.1. Market Analysis, Insights and Forecast - by Type of Motor
- 8. Asia Industrial Motors Market Analysis, Insights and Forecast, 2019-2031
- 8.1. Market Analysis, Insights and Forecast - by Type of Motor
- 8.1.1. Alternating Current (AC) Motors
- 8.1.2. Direct Current (DC) Motor
- 8.1.3. Other Ty
- 8.2. Market Analysis, Insights and Forecast - by Voltage
- 8.2.1. High Voltage
- 8.2.2. Medium Voltage
- 8.2.3. Low Voltage
- 8.3. Market Analysis, Insights and Forecast - by End User
- 8.3.1. Oil & Gas
- 8.3.2. Power Generation
- 8.3.3. Mining & Metals
- 8.3.4. Water & Wastewater Management
- 8.3.5. Chemicals & Petrochemicals
- 8.3.6. Discrete Manufacturing
- 8.3.7. Other End Users
- 8.1. Market Analysis, Insights and Forecast - by Type of Motor
- 9. Australia and New Zealand Industrial Motors Market Analysis, Insights and Forecast, 2019-2031
- 9.1. Market Analysis, Insights and Forecast - by Type of Motor
- 9.1.1. Alternating Current (AC) Motors
- 9.1.2. Direct Current (DC) Motor
- 9.1.3. Other Ty
- 9.2. Market Analysis, Insights and Forecast - by Voltage
- 9.2.1. High Voltage
- 9.2.2. Medium Voltage
- 9.2.3. Low Voltage
- 9.3. Market Analysis, Insights and Forecast - by End User
- 9.3.1. Oil & Gas
- 9.3.2. Power Generation
- 9.3.3. Mining & Metals
- 9.3.4. Water & Wastewater Management
- 9.3.5. Chemicals & Petrochemicals
- 9.3.6. Discrete Manufacturing
- 9.3.7. Other End Users
- 9.1. Market Analysis, Insights and Forecast - by Type of Motor
- 10. Latin America Industrial Motors Market Analysis, Insights and Forecast, 2019-2031
- 10.1. Market Analysis, Insights and Forecast - by Type of Motor
- 10.1.1. Alternating Current (AC) Motors
- 10.1.2. Direct Current (DC) Motor
- 10.1.3. Other Ty
- 10.2. Market Analysis, Insights and Forecast - by Voltage
- 10.2.1. High Voltage
- 10.2.2. Medium Voltage
- 10.2.3. Low Voltage
- 10.3. Market Analysis, Insights and Forecast - by End User
- 10.3.1. Oil & Gas
- 10.3.2. Power Generation
- 10.3.3. Mining & Metals
- 10.3.4. Water & Wastewater Management
- 10.3.5. Chemicals & Petrochemicals
- 10.3.6. Discrete Manufacturing
- 10.3.7. Other End Users
- 10.1. Market Analysis, Insights and Forecast - by Type of Motor
- 11. Middle East and Africa Industrial Motors Market Analysis, Insights and Forecast, 2019-2031
- 11.1. Market Analysis, Insights and Forecast - by Type of Motor
- 11.1.1. Alternating Current (AC) Motors
- 11.1.2. Direct Current (DC) Motor
- 11.1.3. Other Ty
- 11.2. Market Analysis, Insights and Forecast - by Voltage
- 11.2.1. High Voltage
- 11.2.2. Medium Voltage
- 11.2.3. Low Voltage
- 11.3. Market Analysis, Insights and Forecast - by End User
- 11.3.1. Oil & Gas
- 11.3.2. Power Generation
- 11.3.3. Mining & Metals
- 11.3.4. Water & Wastewater Management
- 11.3.5. Chemicals & Petrochemicals
- 11.3.6. Discrete Manufacturing
- 11.3.7. Other End Users
- 11.1. Market Analysis, Insights and Forecast - by Type of Motor
- 12. North America Industrial Motors Market Analysis, Insights and Forecast, 2019-2031
- 12.1. Market Analysis, Insights and Forecast - By Country/Sub-region
- 12.1.1 United States
- 12.1.2 Canada
- 12.1.3 Mexico
- 13. Europe Industrial Motors Market Analysis, Insights and Forecast, 2019-2031
- 13.1. Market Analysis, Insights and Forecast - By Country/Sub-region
- 13.1.1 Germany
- 13.1.2 United Kingdom
- 13.1.3 France
- 13.1.4 Spain
- 13.1.5 Italy
- 13.1.6 Spain
- 13.1.7 Belgium
- 13.1.8 Netherland
- 13.1.9 Nordics
- 13.1.10 Rest of Europe
- 14. Asia Pacific Industrial Motors Market Analysis, Insights and Forecast, 2019-2031
- 14.1. Market Analysis, Insights and Forecast - By Country/Sub-region
- 14.1.1 China
- 14.1.2 Japan
- 14.1.3 India
- 14.1.4 South Korea
- 14.1.5 Southeast Asia
- 14.1.6 Australia
- 14.1.7 Indonesia
- 14.1.8 Phillipes
- 14.1.9 Singapore
- 14.1.10 Thailandc
- 14.1.11 Rest of Asia Pacific
- 15. South America Industrial Motors Market Analysis, Insights and Forecast, 2019-2031
- 15.1. Market Analysis, Insights and Forecast - By Country/Sub-region
- 15.1.1 Brazil
- 15.1.2 Argentina
- 15.1.3 Peru
- 15.1.4 Chile
- 15.1.5 Colombia
- 15.1.6 Ecuador
- 15.1.7 Venezuela
- 15.1.8 Rest of South America
- 16. MEA Industrial Motors Market Analysis, Insights and Forecast, 2019-2031
- 16.1. Market Analysis, Insights and Forecast - By Country/Sub-region
- 16.1.1 United Arab Emirates
- 16.1.2 Saudi Arabia
- 16.1.3 South Africa
- 16.1.4 Rest of Middle East and Africa
- 17. Competitive Analysis
- 17.1. Global Market Share Analysis 2024
- 17.2. Company Profiles
- 17.2.1 ABB Ltd
- 17.2.1.1. Overview
- 17.2.1.2. Products
- 17.2.1.3. SWOT Analysis
- 17.2.1.4. Recent Developments
- 17.2.1.5. Financials (Based on Availability)
- 17.2.2 Allen - Bradly Co LLC (Rockwell Automation Inc)
- 17.2.2.1. Overview
- 17.2.2.2. Products
- 17.2.2.3. SWOT Analysis
- 17.2.2.4. Recent Developments
- 17.2.2.5. Financials (Based on Availability)
- 17.2.3 Maxon Motor AG
- 17.2.3.1. Overview
- 17.2.3.2. Products
- 17.2.3.3. SWOT Analysis
- 17.2.3.4. Recent Developments
- 17.2.3.5. Financials (Based on Availability)
- 17.2.4 Toshiba Electronic Devices and Storage Corporation
- 17.2.4.1. Overview
- 17.2.4.2. Products
- 17.2.4.3. SWOT Analysis
- 17.2.4.4. Recent Developments
- 17.2.4.5. Financials (Based on Availability)
- 17.2.5 Fuji Electric Co Ltd
- 17.2.5.1. Overview
- 17.2.5.2. Products
- 17.2.5.3. SWOT Analysis
- 17.2.5.4. Recent Developments
- 17.2.5.5. Financials (Based on Availability)
- 17.2.6 ATB Austria Antriebstechnik AG
- 17.2.6.1. Overview
- 17.2.6.2. Products
- 17.2.6.3. SWOT Analysis
- 17.2.6.4. Recent Developments
- 17.2.6.5. Financials (Based on Availability)
- 17.2.7 Siemens
- 17.2.7.1. Overview
- 17.2.7.2. Products
- 17.2.7.3. SWOT Analysis
- 17.2.7.4. Recent Developments
- 17.2.7.5. Financials (Based on Availability)
- 17.2.8 Nidec Industrial Solutions
- 17.2.8.1. Overview
- 17.2.8.2. Products
- 17.2.8.3. SWOT Analysis
- 17.2.8.4. Recent Developments
- 17.2.8.5. Financials (Based on Availability)
- 17.2.9 Johnson Electric Holdings Limited
- 17.2.9.1. Overview
- 17.2.9.2. Products
- 17.2.9.3. SWOT Analysis
- 17.2.9.4. Recent Developments
- 17.2.9.5. Financials (Based on Availability)
- 17.2.10 Arc Systems Inc
- 17.2.10.1. Overview
- 17.2.10.2. Products
- 17.2.10.3. SWOT Analysis
- 17.2.10.4. Recent Developments
- 17.2.10.5. Financials (Based on Availability)
- 17.2.11 Emerson Electric Co
- 17.2.11.1. Overview
- 17.2.11.2. Products
- 17.2.11.3. SWOT Analysis
- 17.2.11.4. Recent Developments
- 17.2.11.5. Financials (Based on Availability)
- 17.2.12 Franklin Electric Co Inc
- 17.2.12.1. Overview
- 17.2.12.2. Products
- 17.2.12.3. SWOT Analysis
- 17.2.12.4. Recent Developments
- 17.2.12.5. Financials (Based on Availability)
- 17.2.13 Ametek Inc
- 17.2.13.1. Overview
- 17.2.13.2. Products
- 17.2.13.3. SWOT Analysis
- 17.2.13.4. Recent Developments
- 17.2.13.5. Financials (Based on Availability)
- 17.2.14 Menzel Elektromotoren Gmb
- 17.2.14.1. Overview
- 17.2.14.2. Products
- 17.2.14.3. SWOT Analysis
- 17.2.14.4. Recent Developments
- 17.2.14.5. Financials (Based on Availability)
- 17.2.15 Wolong Industrial Motors
- 17.2.15.1. Overview
- 17.2.15.2. Products
- 17.2.15.3. SWOT Analysis
- 17.2.15.4. Recent Developments
- 17.2.15.5. Financials (Based on Availability)
- 17.2.1 ABB Ltd
List of Figures
- Figure 1: Global Industrial Motors Market Revenue Breakdown (Million, %) by Region 2024 & 2032
- Figure 2: Global Industrial Motors Market Volume Breakdown (K Units, %) by Region 2024 & 2032
- Figure 3: North America Industrial Motors Market Revenue (Million), by Country 2024 & 2032
- Figure 4: North America Industrial Motors Market Volume (K Units), by Country 2024 & 2032
- Figure 5: North America Industrial Motors Market Revenue Share (%), by Country 2024 & 2032
- Figure 6: North America Industrial Motors Market Volume Share (%), by Country 2024 & 2032
- Figure 7: Europe Industrial Motors Market Revenue (Million), by Country 2024 & 2032
- Figure 8: Europe Industrial Motors Market Volume (K Units), by Country 2024 & 2032
- Figure 9: Europe Industrial Motors Market Revenue Share (%), by Country 2024 & 2032
- Figure 10: Europe Industrial Motors Market Volume Share (%), by Country 2024 & 2032
- Figure 11: Asia Pacific Industrial Motors Market Revenue (Million), by Country 2024 & 2032
- Figure 12: Asia Pacific Industrial Motors Market Volume (K Units), by Country 2024 & 2032
- Figure 13: Asia Pacific Industrial Motors Market Revenue Share (%), by Country 2024 & 2032
- Figure 14: Asia Pacific Industrial Motors Market Volume Share (%), by Country 2024 & 2032
- Figure 15: South America Industrial Motors Market Revenue (Million), by Country 2024 & 2032
- Figure 16: South America Industrial Motors Market Volume (K Units), by Country 2024 & 2032
- Figure 17: South America Industrial Motors Market Revenue Share (%), by Country 2024 & 2032
- Figure 18: South America Industrial Motors Market Volume Share (%), by Country 2024 & 2032
- Figure 19: MEA Industrial Motors Market Revenue (Million), by Country 2024 & 2032
- Figure 20: MEA Industrial Motors Market Volume (K Units), by Country 2024 & 2032
- Figure 21: MEA Industrial Motors Market Revenue Share (%), by Country 2024 & 2032
- Figure 22: MEA Industrial Motors Market Volume Share (%), by Country 2024 & 2032
- Figure 23: North America Industrial Motors Market Revenue (Million), by Type of Motor 2024 & 2032
- Figure 24: North America Industrial Motors Market Volume (K Units), by Type of Motor 2024 & 2032
- Figure 25: North America Industrial Motors Market Revenue Share (%), by Type of Motor 2024 & 2032
- Figure 26: North America Industrial Motors Market Volume Share (%), by Type of Motor 2024 & 2032
- Figure 27: North America Industrial Motors Market Revenue (Million), by Voltage 2024 & 2032
- Figure 28: North America Industrial Motors Market Volume (K Units), by Voltage 2024 & 2032
- Figure 29: North America Industrial Motors Market Revenue Share (%), by Voltage 2024 & 2032
- Figure 30: North America Industrial Motors Market Volume Share (%), by Voltage 2024 & 2032
- Figure 31: North America Industrial Motors Market Revenue (Million), by End User 2024 & 2032
- Figure 32: North America Industrial Motors Market Volume (K Units), by End User 2024 & 2032
- Figure 33: North America Industrial Motors Market Revenue Share (%), by End User 2024 & 2032
- Figure 34: North America Industrial Motors Market Volume Share (%), by End User 2024 & 2032
- Figure 35: North America Industrial Motors Market Revenue (Million), by Country 2024 & 2032
- Figure 36: North America Industrial Motors Market Volume (K Units), by Country 2024 & 2032
- Figure 37: North America Industrial Motors Market Revenue Share (%), by Country 2024 & 2032
- Figure 38: North America Industrial Motors Market Volume Share (%), by Country 2024 & 2032
- Figure 39: Europe Industrial Motors Market Revenue (Million), by Type of Motor 2024 & 2032
- Figure 40: Europe Industrial Motors Market Volume (K Units), by Type of Motor 2024 & 2032
- Figure 41: Europe Industrial Motors Market Revenue Share (%), by Type of Motor 2024 & 2032
- Figure 42: Europe Industrial Motors Market Volume Share (%), by Type of Motor 2024 & 2032
- Figure 43: Europe Industrial Motors Market Revenue (Million), by Voltage 2024 & 2032
- Figure 44: Europe Industrial Motors Market Volume (K Units), by Voltage 2024 & 2032
- Figure 45: Europe Industrial Motors Market Revenue Share (%), by Voltage 2024 & 2032
- Figure 46: Europe Industrial Motors Market Volume Share (%), by Voltage 2024 & 2032
- Figure 47: Europe Industrial Motors Market Revenue (Million), by End User 2024 & 2032
- Figure 48: Europe Industrial Motors Market Volume (K Units), by End User 2024 & 2032
- Figure 49: Europe Industrial Motors Market Revenue Share (%), by End User 2024 & 2032
- Figure 50: Europe Industrial Motors Market Volume Share (%), by End User 2024 & 2032
- Figure 51: Europe Industrial Motors Market Revenue (Million), by Country 2024 & 2032
- Figure 52: Europe Industrial Motors Market Volume (K Units), by Country 2024 & 2032
- Figure 53: Europe Industrial Motors Market Revenue Share (%), by Country 2024 & 2032
- Figure 54: Europe Industrial Motors Market Volume Share (%), by Country 2024 & 2032
- Figure 55: Asia Industrial Motors Market Revenue (Million), by Type of Motor 2024 & 2032
- Figure 56: Asia Industrial Motors Market Volume (K Units), by Type of Motor 2024 & 2032
- Figure 57: Asia Industrial Motors Market Revenue Share (%), by Type of Motor 2024 & 2032
- Figure 58: Asia Industrial Motors Market Volume Share (%), by Type of Motor 2024 & 2032
- Figure 59: Asia Industrial Motors Market Revenue (Million), by Voltage 2024 & 2032
- Figure 60: Asia Industrial Motors Market Volume (K Units), by Voltage 2024 & 2032
- Figure 61: Asia Industrial Motors Market Revenue Share (%), by Voltage 2024 & 2032
- Figure 62: Asia Industrial Motors Market Volume Share (%), by Voltage 2024 & 2032
- Figure 63: Asia Industrial Motors Market Revenue (Million), by End User 2024 & 2032
- Figure 64: Asia Industrial Motors Market Volume (K Units), by End User 2024 & 2032
- Figure 65: Asia Industrial Motors Market Revenue Share (%), by End User 2024 & 2032
- Figure 66: Asia Industrial Motors Market Volume Share (%), by End User 2024 & 2032
- Figure 67: Asia Industrial Motors Market Revenue (Million), by Country 2024 & 2032
- Figure 68: Asia Industrial Motors Market Volume (K Units), by Country 2024 & 2032
- Figure 69: Asia Industrial Motors Market Revenue Share (%), by Country 2024 & 2032
- Figure 70: Asia Industrial Motors Market Volume Share (%), by Country 2024 & 2032
- Figure 71: Australia and New Zealand Industrial Motors Market Revenue (Million), by Type of Motor 2024 & 2032
- Figure 72: Australia and New Zealand Industrial Motors Market Volume (K Units), by Type of Motor 2024 & 2032
- Figure 73: Australia and New Zealand Industrial Motors Market Revenue Share (%), by Type of Motor 2024 & 2032
- Figure 74: Australia and New Zealand Industrial Motors Market Volume Share (%), by Type of Motor 2024 & 2032
- Figure 75: Australia and New Zealand Industrial Motors Market Revenue (Million), by Voltage 2024 & 2032
- Figure 76: Australia and New Zealand Industrial Motors Market Volume (K Units), by Voltage 2024 & 2032
- Figure 77: Australia and New Zealand Industrial Motors Market Revenue Share (%), by Voltage 2024 & 2032
- Figure 78: Australia and New Zealand Industrial Motors Market Volume Share (%), by Voltage 2024 & 2032
- Figure 79: Australia and New Zealand Industrial Motors Market Revenue (Million), by End User 2024 & 2032
- Figure 80: Australia and New Zealand Industrial Motors Market Volume (K Units), by End User 2024 & 2032
- Figure 81: Australia and New Zealand Industrial Motors Market Revenue Share (%), by End User 2024 & 2032
- Figure 82: Australia and New Zealand Industrial Motors Market Volume Share (%), by End User 2024 & 2032
- Figure 83: Australia and New Zealand Industrial Motors Market Revenue (Million), by Country 2024 & 2032
- Figure 84: Australia and New Zealand Industrial Motors Market Volume (K Units), by Country 2024 & 2032
- Figure 85: Australia and New Zealand Industrial Motors Market Revenue Share (%), by Country 2024 & 2032
- Figure 86: Australia and New Zealand Industrial Motors Market Volume Share (%), by Country 2024 & 2032
- Figure 87: Latin America Industrial Motors Market Revenue (Million), by Type of Motor 2024 & 2032
- Figure 88: Latin America Industrial Motors Market Volume (K Units), by Type of Motor 2024 & 2032
- Figure 89: Latin America Industrial Motors Market Revenue Share (%), by Type of Motor 2024 & 2032
- Figure 90: Latin America Industrial Motors Market Volume Share (%), by Type of Motor 2024 & 2032
- Figure 91: Latin America Industrial Motors Market Revenue (Million), by Voltage 2024 & 2032
- Figure 92: Latin America Industrial Motors Market Volume (K Units), by Voltage 2024 & 2032
- Figure 93: Latin America Industrial Motors Market Revenue Share (%), by Voltage 2024 & 2032
- Figure 94: Latin America Industrial Motors Market Volume Share (%), by Voltage 2024 & 2032
- Figure 95: Latin America Industrial Motors Market Revenue (Million), by End User 2024 & 2032
- Figure 96: Latin America Industrial Motors Market Volume (K Units), by End User 2024 & 2032
- Figure 97: Latin America Industrial Motors Market Revenue Share (%), by End User 2024 & 2032
- Figure 98: Latin America Industrial Motors Market Volume Share (%), by End User 2024 & 2032
- Figure 99: Latin America Industrial Motors Market Revenue (Million), by Country 2024 & 2032
- Figure 100: Latin America Industrial Motors Market Volume (K Units), by Country 2024 & 2032
- Figure 101: Latin America Industrial Motors Market Revenue Share (%), by Country 2024 & 2032
- Figure 102: Latin America Industrial Motors Market Volume Share (%), by Country 2024 & 2032
- Figure 103: Middle East and Africa Industrial Motors Market Revenue (Million), by Type of Motor 2024 & 2032
- Figure 104: Middle East and Africa Industrial Motors Market Volume (K Units), by Type of Motor 2024 & 2032
- Figure 105: Middle East and Africa Industrial Motors Market Revenue Share (%), by Type of Motor 2024 & 2032
- Figure 106: Middle East and Africa Industrial Motors Market Volume Share (%), by Type of Motor 2024 & 2032
- Figure 107: Middle East and Africa Industrial Motors Market Revenue (Million), by Voltage 2024 & 2032
- Figure 108: Middle East and Africa Industrial Motors Market Volume (K Units), by Voltage 2024 & 2032
- Figure 109: Middle East and Africa Industrial Motors Market Revenue Share (%), by Voltage 2024 & 2032
- Figure 110: Middle East and Africa Industrial Motors Market Volume Share (%), by Voltage 2024 & 2032
- Figure 111: Middle East and Africa Industrial Motors Market Revenue (Million), by End User 2024 & 2032
- Figure 112: Middle East and Africa Industrial Motors Market Volume (K Units), by End User 2024 & 2032
- Figure 113: Middle East and Africa Industrial Motors Market Revenue Share (%), by End User 2024 & 2032
- Figure 114: Middle East and Africa Industrial Motors Market Volume Share (%), by End User 2024 & 2032
- Figure 115: Middle East and Africa Industrial Motors Market Revenue (Million), by Country 2024 & 2032
- Figure 116: Middle East and Africa Industrial Motors Market Volume (K Units), by Country 2024 & 2032
- Figure 117: Middle East and Africa Industrial Motors Market Revenue Share (%), by Country 2024 & 2032
- Figure 118: Middle East and Africa Industrial Motors Market Volume Share (%), by Country 2024 & 2032
List of Tables
- Table 1: Global Industrial Motors Market Revenue Million Forecast, by Region 2019 & 2032
- Table 2: Global Industrial Motors Market Volume K Units Forecast, by Region 2019 & 2032
- Table 3: Global Industrial Motors Market Revenue Million Forecast, by Type of Motor 2019 & 2032
- Table 4: Global Industrial Motors Market Volume K Units Forecast, by Type of Motor 2019 & 2032
- Table 5: Global Industrial Motors Market Revenue Million Forecast, by Voltage 2019 & 2032
- Table 6: Global Industrial Motors Market Volume K Units Forecast, by Voltage 2019 & 2032
- Table 7: Global Industrial Motors Market Revenue Million Forecast, by End User 2019 & 2032
- Table 8: Global Industrial Motors Market Volume K Units Forecast, by End User 2019 & 2032
- Table 9: Global Industrial Motors Market Revenue Million Forecast, by Region 2019 & 2032
- Table 10: Global Industrial Motors Market Volume K Units Forecast, by Region 2019 & 2032
- Table 11: Global Industrial Motors Market Revenue Million Forecast, by Country 2019 & 2032
- Table 12: Global Industrial Motors Market Volume K Units Forecast, by Country 2019 & 2032
- Table 13: United States Industrial Motors Market Revenue (Million) Forecast, by Application 2019 & 2032
- Table 14: United States Industrial Motors Market Volume (K Units) Forecast, by Application 2019 & 2032
- Table 15: Canada Industrial Motors Market Revenue (Million) Forecast, by Application 2019 & 2032
- Table 16: Canada Industrial Motors Market Volume (K Units) Forecast, by Application 2019 & 2032
- Table 17: Mexico Industrial Motors Market Revenue (Million) Forecast, by Application 2019 & 2032
- Table 18: Mexico Industrial Motors Market Volume (K Units) Forecast, by Application 2019 & 2032
- Table 19: Global Industrial Motors Market Revenue Million Forecast, by Country 2019 & 2032
- Table 20: Global Industrial Motors Market Volume K Units Forecast, by Country 2019 & 2032
- Table 21: Germany Industrial Motors Market Revenue (Million) Forecast, by Application 2019 & 2032
- Table 22: Germany Industrial Motors Market Volume (K Units) Forecast, by Application 2019 & 2032
- Table 23: United Kingdom Industrial Motors Market Revenue (Million) Forecast, by Application 2019 & 2032
- Table 24: United Kingdom Industrial Motors Market Volume (K Units) Forecast, by Application 2019 & 2032
- Table 25: France Industrial Motors Market Revenue (Million) Forecast, by Application 2019 & 2032
- Table 26: France Industrial Motors Market Volume (K Units) Forecast, by Application 2019 & 2032
- Table 27: Spain Industrial Motors Market Revenue (Million) Forecast, by Application 2019 & 2032
- Table 28: Spain Industrial Motors Market Volume (K Units) Forecast, by Application 2019 & 2032
- Table 29: Italy Industrial Motors Market Revenue (Million) Forecast, by Application 2019 & 2032
- Table 30: Italy Industrial Motors Market Volume (K Units) Forecast, by Application 2019 & 2032
- Table 31: Spain Industrial Motors Market Revenue (Million) Forecast, by Application 2019 & 2032
- Table 32: Spain Industrial Motors Market Volume (K Units) Forecast, by Application 2019 & 2032
- Table 33: Belgium Industrial Motors Market Revenue (Million) Forecast, by Application 2019 & 2032
- Table 34: Belgium Industrial Motors Market Volume (K Units) Forecast, by Application 2019 & 2032
- Table 35: Netherland Industrial Motors Market Revenue (Million) Forecast, by Application 2019 & 2032
- Table 36: Netherland Industrial Motors Market Volume (K Units) Forecast, by Application 2019 & 2032
- Table 37: Nordics Industrial Motors Market Revenue (Million) Forecast, by Application 2019 & 2032
- Table 38: Nordics Industrial Motors Market Volume (K Units) Forecast, by Application 2019 & 2032
- Table 39: Rest of Europe Industrial Motors Market Revenue (Million) Forecast, by Application 2019 & 2032
- Table 40: Rest of Europe Industrial Motors Market Volume (K Units) Forecast, by Application 2019 & 2032
- Table 41: Global Industrial Motors Market Revenue Million Forecast, by Country 2019 & 2032
- Table 42: Global Industrial Motors Market Volume K Units Forecast, by Country 2019 & 2032
- Table 43: China Industrial Motors Market Revenue (Million) Forecast, by Application 2019 & 2032
- Table 44: China Industrial Motors Market Volume (K Units) Forecast, by Application 2019 & 2032
- Table 45: Japan Industrial Motors Market Revenue (Million) Forecast, by Application 2019 & 2032
- Table 46: Japan Industrial Motors Market Volume (K Units) Forecast, by Application 2019 & 2032
- Table 47: India Industrial Motors Market Revenue (Million) Forecast, by Application 2019 & 2032
- Table 48: India Industrial Motors Market Volume (K Units) Forecast, by Application 2019 & 2032
- Table 49: South Korea Industrial Motors Market Revenue (Million) Forecast, by Application 2019 & 2032
- Table 50: South Korea Industrial Motors Market Volume (K Units) Forecast, by Application 2019 & 2032
- Table 51: Southeast Asia Industrial Motors Market Revenue (Million) Forecast, by Application 2019 & 2032
- Table 52: Southeast Asia Industrial Motors Market Volume (K Units) Forecast, by Application 2019 & 2032
- Table 53: Australia Industrial Motors Market Revenue (Million) Forecast, by Application 2019 & 2032
- Table 54: Australia Industrial Motors Market Volume (K Units) Forecast, by Application 2019 & 2032
- Table 55: Indonesia Industrial Motors Market Revenue (Million) Forecast, by Application 2019 & 2032
- Table 56: Indonesia Industrial Motors Market Volume (K Units) Forecast, by Application 2019 & 2032
- Table 57: Phillipes Industrial Motors Market Revenue (Million) Forecast, by Application 2019 & 2032
- Table 58: Phillipes Industrial Motors Market Volume (K Units) Forecast, by Application 2019 & 2032
- Table 59: Singapore Industrial Motors Market Revenue (Million) Forecast, by Application 2019 & 2032
- Table 60: Singapore Industrial Motors Market Volume (K Units) Forecast, by Application 2019 & 2032
- Table 61: Thailandc Industrial Motors Market Revenue (Million) Forecast, by Application 2019 & 2032
- Table 62: Thailandc Industrial Motors Market Volume (K Units) Forecast, by Application 2019 & 2032
- Table 63: Rest of Asia Pacific Industrial Motors Market Revenue (Million) Forecast, by Application 2019 & 2032
- Table 64: Rest of Asia Pacific Industrial Motors Market Volume (K Units) Forecast, by Application 2019 & 2032
- Table 65: Global Industrial Motors Market Revenue Million Forecast, by Country 2019 & 2032
- Table 66: Global Industrial Motors Market Volume K Units Forecast, by Country 2019 & 2032
- Table 67: Brazil Industrial Motors Market Revenue (Million) Forecast, by Application 2019 & 2032
- Table 68: Brazil Industrial Motors Market Volume (K Units) Forecast, by Application 2019 & 2032
- Table 69: Argentina Industrial Motors Market Revenue (Million) Forecast, by Application 2019 & 2032
- Table 70: Argentina Industrial Motors Market Volume (K Units) Forecast, by Application 2019 & 2032
- Table 71: Peru Industrial Motors Market Revenue (Million) Forecast, by Application 2019 & 2032
- Table 72: Peru Industrial Motors Market Volume (K Units) Forecast, by Application 2019 & 2032
- Table 73: Chile Industrial Motors Market Revenue (Million) Forecast, by Application 2019 & 2032
- Table 74: Chile Industrial Motors Market Volume (K Units) Forecast, by Application 2019 & 2032
- Table 75: Colombia Industrial Motors Market Revenue (Million) Forecast, by Application 2019 & 2032
- Table 76: Colombia Industrial Motors Market Volume (K Units) Forecast, by Application 2019 & 2032
- Table 77: Ecuador Industrial Motors Market Revenue (Million) Forecast, by Application 2019 & 2032
- Table 78: Ecuador Industrial Motors Market Volume (K Units) Forecast, by Application 2019 & 2032
- Table 79: Venezuela Industrial Motors Market Revenue (Million) Forecast, by Application 2019 & 2032
- Table 80: Venezuela Industrial Motors Market Volume (K Units) Forecast, by Application 2019 & 2032
- Table 81: Rest of South America Industrial Motors Market Revenue (Million) Forecast, by Application 2019 & 2032
- Table 82: Rest of South America Industrial Motors Market Volume (K Units) Forecast, by Application 2019 & 2032
- Table 83: Global Industrial Motors Market Revenue Million Forecast, by Country 2019 & 2032
- Table 84: Global Industrial Motors Market Volume K Units Forecast, by Country 2019 & 2032
- Table 85: United Arab Emirates Industrial Motors Market Revenue (Million) Forecast, by Application 2019 & 2032
- Table 86: United Arab Emirates Industrial Motors Market Volume (K Units) Forecast, by Application 2019 & 2032
- Table 87: Saudi Arabia Industrial Motors Market Revenue (Million) Forecast, by Application 2019 & 2032
- Table 88: Saudi Arabia Industrial Motors Market Volume (K Units) Forecast, by Application 2019 & 2032
- Table 89: South Africa Industrial Motors Market Revenue (Million) Forecast, by Application 2019 & 2032
- Table 90: South Africa Industrial Motors Market Volume (K Units) Forecast, by Application 2019 & 2032
- Table 91: Rest of Middle East and Africa Industrial Motors Market Revenue (Million) Forecast, by Application 2019 & 2032
- Table 92: Rest of Middle East and Africa Industrial Motors Market Volume (K Units) Forecast, by Application 2019 & 2032
- Table 93: Global Industrial Motors Market Revenue Million Forecast, by Type of Motor 2019 & 2032
- Table 94: Global Industrial Motors Market Volume K Units Forecast, by Type of Motor 2019 & 2032
- Table 95: Global Industrial Motors Market Revenue Million Forecast, by Voltage 2019 & 2032
- Table 96: Global Industrial Motors Market Volume K Units Forecast, by Voltage 2019 & 2032
- Table 97: Global Industrial Motors Market Revenue Million Forecast, by End User 2019 & 2032
- Table 98: Global Industrial Motors Market Volume K Units Forecast, by End User 2019 & 2032
- Table 99: Global Industrial Motors Market Revenue Million Forecast, by Country 2019 & 2032
- Table 100: Global Industrial Motors Market Volume K Units Forecast, by Country 2019 & 2032
- Table 101: Global Industrial Motors Market Revenue Million Forecast, by Type of Motor 2019 & 2032
- Table 102: Global Industrial Motors Market Volume K Units Forecast, by Type of Motor 2019 & 2032
- Table 103: Global Industrial Motors Market Revenue Million Forecast, by Voltage 2019 & 2032
- Table 104: Global Industrial Motors Market Volume K Units Forecast, by Voltage 2019 & 2032
- Table 105: Global Industrial Motors Market Revenue Million Forecast, by End User 2019 & 2032
- Table 106: Global Industrial Motors Market Volume K Units Forecast, by End User 2019 & 2032
- Table 107: Global Industrial Motors Market Revenue Million Forecast, by Country 2019 & 2032
- Table 108: Global Industrial Motors Market Volume K Units Forecast, by Country 2019 & 2032
- Table 109: Global Industrial Motors Market Revenue Million Forecast, by Type of Motor 2019 & 2032
- Table 110: Global Industrial Motors Market Volume K Units Forecast, by Type of Motor 2019 & 2032
- Table 111: Global Industrial Motors Market Revenue Million Forecast, by Voltage 2019 & 2032
- Table 112: Global Industrial Motors Market Volume K Units Forecast, by Voltage 2019 & 2032
- Table 113: Global Industrial Motors Market Revenue Million Forecast, by End User 2019 & 2032
- Table 114: Global Industrial Motors Market Volume K Units Forecast, by End User 2019 & 2032
- Table 115: Global Industrial Motors Market Revenue Million Forecast, by Country 2019 & 2032
- Table 116: Global Industrial Motors Market Volume K Units Forecast, by Country 2019 & 2032
- Table 117: Global Industrial Motors Market Revenue Million Forecast, by Type of Motor 2019 & 2032
- Table 118: Global Industrial Motors Market Volume K Units Forecast, by Type of Motor 2019 & 2032
- Table 119: Global Industrial Motors Market Revenue Million Forecast, by Voltage 2019 & 2032
- Table 120: Global Industrial Motors Market Volume K Units Forecast, by Voltage 2019 & 2032
- Table 121: Global Industrial Motors Market Revenue Million Forecast, by End User 2019 & 2032
- Table 122: Global Industrial Motors Market Volume K Units Forecast, by End User 2019 & 2032
- Table 123: Global Industrial Motors Market Revenue Million Forecast, by Country 2019 & 2032
- Table 124: Global Industrial Motors Market Volume K Units Forecast, by Country 2019 & 2032
- Table 125: Global Industrial Motors Market Revenue Million Forecast, by Type of Motor 2019 & 2032
- Table 126: Global Industrial Motors Market Volume K Units Forecast, by Type of Motor 2019 & 2032
- Table 127: Global Industrial Motors Market Revenue Million Forecast, by Voltage 2019 & 2032
- Table 128: Global Industrial Motors Market Volume K Units Forecast, by Voltage 2019 & 2032
- Table 129: Global Industrial Motors Market Revenue Million Forecast, by End User 2019 & 2032
- Table 130: Global Industrial Motors Market Volume K Units Forecast, by End User 2019 & 2032
- Table 131: Global Industrial Motors Market Revenue Million Forecast, by Country 2019 & 2032
- Table 132: Global Industrial Motors Market Volume K Units Forecast, by Country 2019 & 2032
- Table 133: Global Industrial Motors Market Revenue Million Forecast, by Type of Motor 2019 & 2032
- Table 134: Global Industrial Motors Market Volume K Units Forecast, by Type of Motor 2019 & 2032
- Table 135: Global Industrial Motors Market Revenue Million Forecast, by Voltage 2019 & 2032
- Table 136: Global Industrial Motors Market Volume K Units Forecast, by Voltage 2019 & 2032
- Table 137: Global Industrial Motors Market Revenue Million Forecast, by End User 2019 & 2032
- Table 138: Global Industrial Motors Market Volume K Units Forecast, by End User 2019 & 2032
- Table 139: Global Industrial Motors Market Revenue Million Forecast, by Country 2019 & 2032
- Table 140: Global Industrial Motors Market Volume K Units Forecast, by Country 2019 & 2032
Frequently Asked Questions
1. What is the projected Compound Annual Growth Rate (CAGR) of the Industrial Motors Market?
The projected CAGR is approximately 4.77%.
2. Which companies are prominent players in the Industrial Motors Market?
Key companies in the market include ABB Ltd, Allen - Bradly Co LLC (Rockwell Automation Inc), Maxon Motor AG, Toshiba Electronic Devices and Storage Corporation, Fuji Electric Co Ltd, ATB Austria Antriebstechnik AG, Siemens, Nidec Industrial Solutions, Johnson Electric Holdings Limited, Arc Systems Inc, Emerson Electric Co, Franklin Electric Co Inc, Ametek Inc, Menzel Elektromotoren Gmb, Wolong Industrial Motors.
3. What are the main segments of the Industrial Motors Market?
The market segments include Type of Motor, Voltage, End User.
4. Can you provide details about the market size?
The market size is estimated to be USD 21.29 Million as of 2022.
5. What are some drivers contributing to market growth?
Demand for Energy Efficiency Owing to Government Regulations; Growing Shift towards Smart Motors.
6. What are the notable trends driving market growth?
Low Voltage to Hold Significant Market Share.
7. Are there any restraints impacting market growth?
High Switching Costs May Act as a Restraint.
8. Can you provide examples of recent developments in the market?
May 2023: ABB announced the completion of its acquisition of the Siemens low voltage NEMA motor business. According to the company, the acquisition is part of ABB's Motion business area's growth strategy and strengthens ABB's position among the leading industrial NEMA motor manufacturers.
9. What pricing options are available for accessing the report?
Pricing options include single-user, multi-user, and enterprise licenses priced at USD 4750, USD 5250, and USD 8750 respectively.
10. Is the market size provided in terms of value or volume?
The market size is provided in terms of value, measured in Million and volume, measured in K Units.
11. Are there any specific market keywords associated with the report?
Yes, the market keyword associated with the report is "Industrial Motors Market," which aids in identifying and referencing the specific market segment covered.
12. How do I determine which pricing option suits my needs best?
The pricing options vary based on user requirements and access needs. Individual users may opt for single-user licenses, while businesses requiring broader access may choose multi-user or enterprise licenses for cost-effective access to the report.
13. Are there any additional resources or data provided in the Industrial Motors Market report?
While the report offers comprehensive insights, it's advisable to review the specific contents or supplementary materials provided to ascertain if additional resources or data are available.
14. How can I stay updated on further developments or reports in the Industrial Motors Market?
To stay informed about further developments, trends, and reports in the Industrial Motors Market, consider subscribing to industry newsletters, following relevant companies and organizations, or regularly checking reputable industry news sources and publications.
Methodology
Step 1 - Identification of Relevant Samples Size from Population Database


Step 2 - Approaches for Defining Global Market Size (Value, Volume* & Price*)

Note*: In applicable scenarios
Step 3 - Data Sources
Primary Research
- Web Analytics
- Survey Reports
- Research Institute
- Latest Research Reports
- Opinion Leaders
Secondary Research
- Annual Reports
- White Paper
- Latest Press Release
- Industry Association
- Paid Database
- Investor Presentations

Step 4 - Data Triangulation
Involves using different sources of information in order to increase the validity of a study
These sources are likely to be stakeholders in a program - participants, other researchers, program staff, other community members, and so on.
Then we put all data in single framework & apply various statistical tools to find out the dynamic on the market.
During the analysis stage, feedback from the stakeholder groups would be compared to determine areas of agreement as well as areas of divergence


