
Key Insights
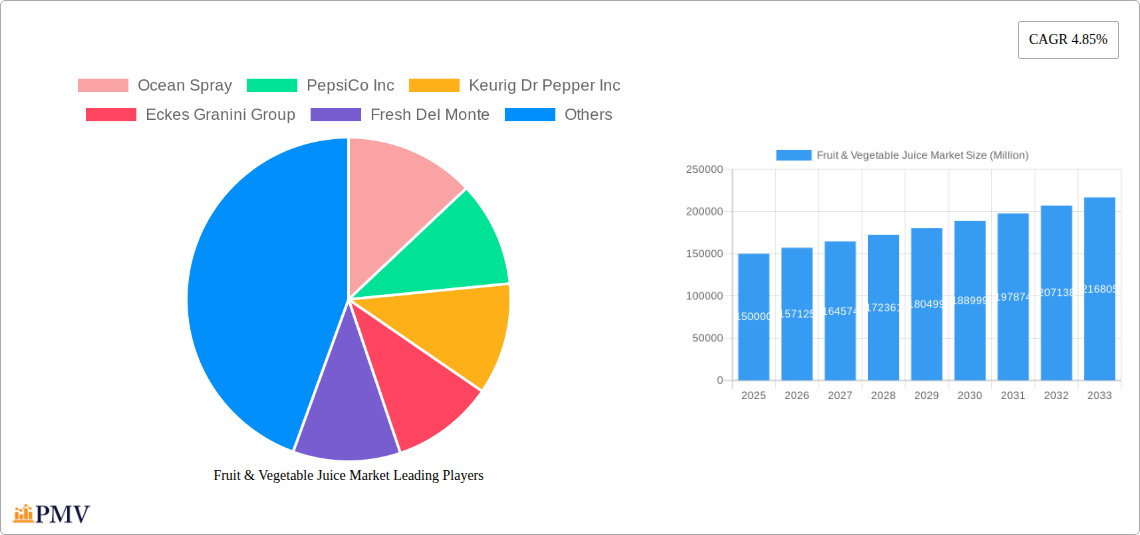
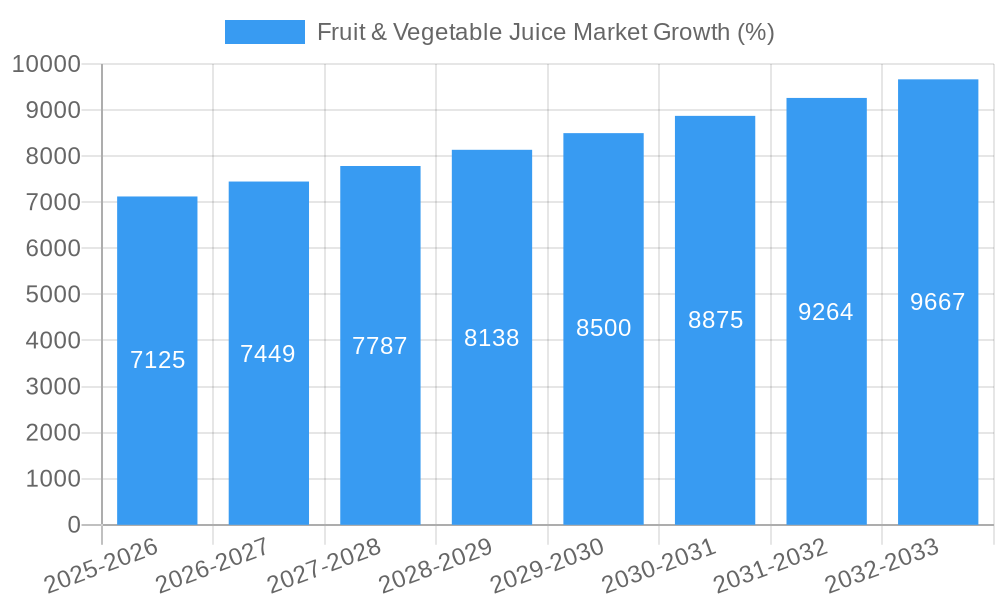
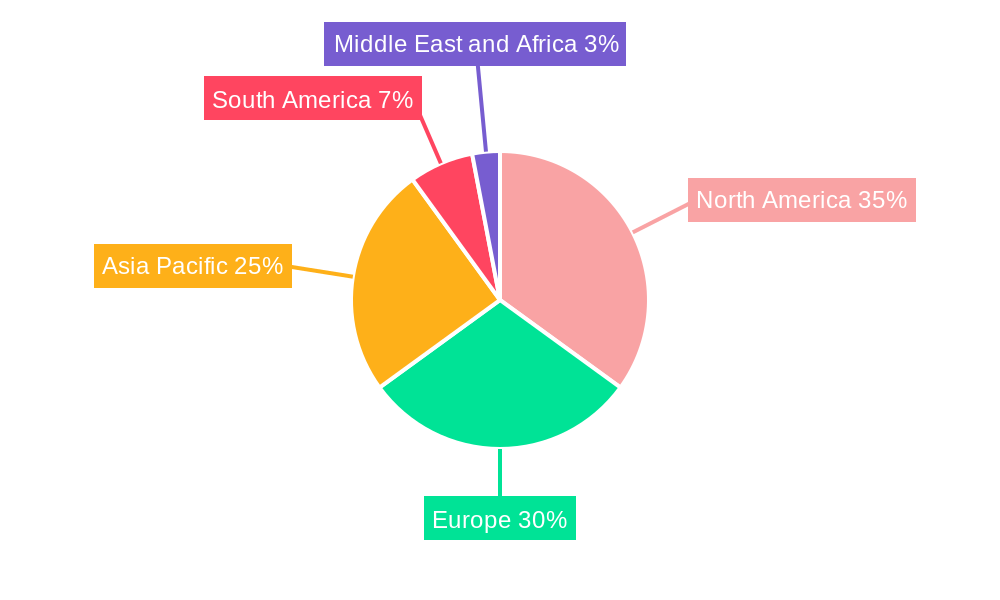
The global fruit and vegetable juice market, valued at approximately $150 billion in 2025, is projected to experience robust growth, exhibiting a Compound Annual Growth Rate (CAGR) of 4.85% from 2025 to 2033. This expansion is fueled by several key drivers. Increasing health consciousness among consumers is driving demand for healthier beverage options, with fruit and vegetable juices perceived as a convenient source of vitamins and antioxidants. The rising prevalence of health-related issues like obesity and diabetes is further bolstering this trend. Moreover, the proliferation of innovative product formats, such as functional juices with added benefits like probiotics or superfoods, is attracting new customer segments. The expansion of e-commerce channels also facilitates increased accessibility and convenience for consumers. However, the market faces certain challenges. Fluctuations in raw material prices, particularly fruits and vegetables, can impact profitability. Concerns regarding added sugars and preservatives in certain juice varieties also limit market growth, prompting manufacturers to focus on natural and minimally processed options. Furthermore, intense competition from other beverage categories, such as carbonated soft drinks and ready-to-drink teas, necessitates strategic marketing and product diversification. Segmentation analysis reveals that fruit juices currently hold the largest market share among product types, followed by vegetable juices and nectars. Supermarkets and hypermarkets remain the dominant distribution channel, but online retail stores are witnessing rapid growth, indicating a shift towards e-commerce platforms. Key players like Ocean Spray, PepsiCo, and Coca-Cola are actively shaping market dynamics through brand building, product innovation, and strategic acquisitions. Geographic analysis shows North America and Europe currently hold significant market shares, but the Asia-Pacific region demonstrates strong growth potential driven by rising disposable incomes and changing consumer preferences.
The future of the fruit and vegetable juice market hinges on manufacturers' ability to adapt to changing consumer demands. This includes a stronger focus on clean labels, natural ingredients, and innovative product formulations catering to health-conscious individuals. Sustainability initiatives, including ethical sourcing and eco-friendly packaging, are also gaining importance, impacting consumer choices and brand loyalty. Strategic partnerships with retailers to enhance distribution and brand visibility are also crucial. Furthermore, targeted marketing campaigns highlighting the health benefits and convenience of fruit and vegetable juices, along with addressing consumer concerns regarding added sugars, are essential for sustained market growth. The market’s evolution will likely involve a greater emphasis on premium, functional, and organic options, accompanied by a steady rise in online sales and a diverse geographic spread of consumption.
Fruit & Vegetable Juice Market: A Comprehensive Report (2019-2033)
This comprehensive report provides a detailed analysis of the Fruit & Vegetable Juice Market, offering invaluable insights for businesses, investors, and stakeholders. Covering the period from 2019 to 2033, with a base year of 2025, this study meticulously examines market dynamics, competitive landscapes, and future growth prospects. The report leverages extensive data analysis to forecast market trends, identifying key opportunities and challenges within the fruit and vegetable juice sector. This in-depth analysis will empower informed decision-making and strategic planning within this dynamic market. The global market value is estimated at xx Million in 2025 and is projected to reach xx Million by 2033, exhibiting a CAGR of xx% during the forecast period (2025-2033).
Fruit & Vegetable Juice Market Market Structure & Competitive Dynamics
The fruit and vegetable juice market exhibits a moderately consolidated structure, with key players holding significant market share. Ocean Spray, PepsiCo Inc, Keurig Dr Pepper Inc, Eckes Granini Group, and other major players compete intensely, leveraging brand recognition, extensive distribution networks, and product innovation. The market's competitive landscape is characterized by both organic growth strategies, such as product diversification and expansion into new markets, and inorganic growth strategies, including mergers and acquisitions (M&A). Recent M&A activity has been driven by a desire to expand product portfolios and geographic reach. The total value of M&A deals in the sector between 2019 and 2024 was estimated at xx Million. Market concentration is further analyzed through the Herfindahl-Hirschman Index (HHI), with the data suggesting a moderate level of competition. The regulatory framework varies across geographies, impacting labeling requirements, health claims, and ingredient standards. Growing consumer preference for healthy and functional beverages drives innovation in areas such as organic, functional, and premium juice segments. Substitute products include carbonated soft drinks, sports drinks, and other beverage alternatives. The industry is constantly adapting to changing consumer trends, influencing product development and marketing strategies.
- Market Share: PepsiCo Inc. and The Coca-Cola Company hold a substantial share, followed by Ocean Spray and smaller regional players. Exact figures are provided within the full report.
- M&A Activity: A detailed breakdown of significant M&A deals (value and participants) from 2019 to 2024 is included in the full report.
- Innovation Ecosystems: Collaboration between beverage manufacturers, ingredient suppliers, and technology providers is driving innovation in packaging and product formulation.
- Regulatory Frameworks: Analysis of key regulations influencing the fruit and vegetable juice industry in major markets are detailed in the report.
Fruit & Vegetable Juice Market Industry Trends & Insights
The fruit and vegetable juice market is experiencing significant growth, fueled by several key trends. The increasing consumer awareness of health and wellness is a primary driver, leading to heightened demand for juices perceived as healthier alternatives to sugary drinks. The growing popularity of functional beverages, fortified with vitamins, minerals, and antioxidants, further enhances market expansion. Technological advancements in processing and packaging have improved product quality, shelf life, and convenience, contributing to market growth. Consumer preferences are shifting towards natural, organic, and less processed juices, impacting product development strategies. Competitive dynamics are shaped by pricing strategies, branding initiatives, and product differentiation. The market demonstrates a high degree of product differentiation, reflecting the wide variety of flavors, ingredients, and health benefits offered by different brands. The market penetration rate for fruit and vegetable juices varies across regions, depending on factors such as consumer income levels, dietary habits, and the availability of healthier beverage options. The CAGR for the global fruit and vegetable juice market during the historical period (2019-2024) was estimated at xx%, with further projections available in the full report.
Dominant Markets & Segments in Fruit & Vegetable Juice Market
The North American market holds a dominant position in the global fruit and vegetable juice market, driven by high per capita consumption rates and the presence of major beverage manufacturers. Within the product types, fruit juice commands the largest market share followed by nectar and vegetable juices. The supermarkets/hypermarkets channel is the most significant distribution channel, reflecting the convenience and accessibility of these stores for consumers. The online retail segment is witnessing robust growth driven by increasing e-commerce adoption and changing consumer buying habits.
Key Drivers for North American Dominance:
- High per capita disposable income
- Strong established distribution networks
- High consumer awareness of health and wellness
- Preference for convenience
Segment Dominance Analysis: Detailed breakdowns of market size and growth projections for each product type (fruit juice, vegetable juices, nectar) and distribution channel (supermarkets/hypermarkets, convenience stores, specialty stores, online retail stores, other distribution channels) are provided in the full report.
Fruit & Vegetable Juice Market Product Innovations
Recent innovations in the fruit and vegetable juice market center around enhanced functionality, convenience, and sustainability. Manufacturers are focusing on incorporating health-boosting ingredients like probiotics, superfoods, and herbal extracts. The use of innovative packaging materials, such as aseptic cartons and recyclable bottles, addresses environmental concerns. Technological advancements in high-pressure processing (HPP) and cold-pressed extraction preserve nutritional value and extend shelf life.
Report Segmentation & Scope
This report segments the fruit and vegetable juice market based on product type (Fruit Juice, Vegetable Juices, Nectar) and distribution channel (Supermarkets/Hypermarkets, Convenience Stores, Specialty Stores, Online Retail Stores, Other Distribution Channels). Each segment is analyzed individually to assess its market size, growth projections, and competitive dynamics. The growth projections are based on a detailed analysis of market drivers, consumer trends, and technological advancements. The competitive landscape within each segment is described, highlighting key players and their market strategies.
Key Drivers of Fruit & Vegetable Juice Market Growth
The fruit and vegetable juice market is propelled by several key growth drivers. The increasing consumer awareness of health benefits associated with fruit and vegetable consumption fuels the demand for these juices. Rising disposable incomes in developing economies expand the market's addressable population. Government initiatives promoting healthy lifestyles also stimulate demand. Moreover, technological advancements in processing and packaging techniques enhance product quality and shelf life, enabling wider availability and distribution.
Challenges in the Fruit & Vegetable Juice Market Sector
The fruit and vegetable juice market faces several challenges. Fluctuating raw material prices and supply chain disruptions impact production costs and profitability. Stringent regulatory frameworks regarding labeling, health claims, and food safety necessitate compliance costs. Intense competition from other beverage categories and the rising popularity of alternative healthy drinks pose a continuous challenge for market players. Maintaining product quality and freshness while extending shelf life is also a significant operational hurdle.
Leading Players in the Fruit & Vegetable Juice Market Market
- Ocean Spray
- PepsiCo Inc
- Keurig Dr Pepper Inc
- Eckes Granini Group
- Fresh Del Monte
- The Kraft Heinz Company
- The Coca-Cola Company
- Campbell Soup Company
- Citrus World Inc
- Welch's
Key Developments in Fruit & Vegetable Juice Market Sector
- July 2022: Tipco launches vegetable and herb-infused drinks in Southeast Asia and the Middle East.
- May 2022: Bidco introduces joOz Boost+ fruit juice in Kenya.
- November 2021: Star launches the UAE's first naturally sweetened fruit drink using Stevia.
Strategic Fruit & Vegetable Juice Market Market Outlook
The fruit and vegetable juice market presents significant growth potential, driven by sustained consumer demand for healthy beverages and continuous innovation in product offerings. Opportunities exist in expanding into emerging markets, developing functional and premium juice variants, and adopting sustainable packaging solutions. Strategic partnerships with ingredient suppliers and technology providers can enhance product development and market competitiveness. Investing in research and development to create innovative and healthier juice products will be crucial for capturing market share.
Fruit & Vegetable Juice Market Segmentation
-
1. Category
- 1.1. Fruit
- 1.2. Vegetable
-
2. Type
- 2.1. Still Juice Drinks
- 2.2. 100% juice
- 2.3. Nectar
-
3. Distribution Channel
- 3.1. Supermarkets/Hypermarkets
- 3.2. Convenience Stores
- 3.3. Specialty Stores
- 3.4. Online Retail Stores
- 3.5. Other Distribution Channels
Fruit & Vegetable Juice Market Segmentation By Geography
-
1. North America
- 1.1. United States
- 1.2. Canada
- 1.3. Mexico
- 1.4. Rest of North America
-
2. Europe
- 2.1. United Kingdom
- 2.2. Germany
- 2.3. Spain
- 2.4. France
- 2.5. Italy
- 2.6. Russia
- 2.7. Rest of Europe
-
3. Asia Pacific
- 3.1. China
- 3.2. Japan
- 3.3. India
- 3.4. Australia
- 3.5. Rest of Asia Pacific
-
4. South America
- 4.1. Brazil
- 4.2. Argentina
- 4.3. Rest of South America
-
5. Middle East and Africa
- 5.1. Saudi Arabia
- 5.2. South Africa
- 5.3. Rest of Middle East and Africa
Fruit & Vegetable Juice Market REPORT HIGHLIGHTS
| Aspects | Details |
|---|---|
| Study Period | 2019-2033 |
| Base Year | 2024 |
| Estimated Year | 2025 |
| Forecast Period | 2025-2033 |
| Historical Period | 2019-2024 |
| Growth Rate | CAGR of 4.85% from 2019-2033 |
| Segmentation |
|
Table of Contents
- 1. Introduction
- 1.1. Research Scope
- 1.2. Market Segmentation
- 1.3. Research Methodology
- 1.4. Definitions and Assumptions
- 2. Executive Summary
- 2.1. Introduction
- 3. Market Dynamics
- 3.1. Introduction
- 3.2. Market Drivers
- 3.2.1. Growing consumer awareness about health and wellness has increased the demand for nutritious beverages
- 3.3. Market Restrains
- 3.3.1. Adverse Effects of Overconsumption of Products
- 3.4. Market Trends
- 3.4.1. Rising demand for organic and natural juices free from additives and preservatives
- 4. Market Factor Analysis
- 4.1. Porters Five Forces
- 4.2. Supply/Value Chain
- 4.3. PESTEL analysis
- 4.4. Market Entropy
- 4.5. Patent/Trademark Analysis
- 5. Global Fruit & Vegetable Juice Market Analysis, Insights and Forecast, 2019-2031
- 5.1. Market Analysis, Insights and Forecast - by Category
- 5.1.1. Fruit
- 5.1.2. Vegetable
- 5.2. Market Analysis, Insights and Forecast - by Type
- 5.2.1. Still Juice Drinks
- 5.2.2. 100% juice
- 5.2.3. Nectar
- 5.3. Market Analysis, Insights and Forecast - by Distribution Channel
- 5.3.1. Supermarkets/Hypermarkets
- 5.3.2. Convenience Stores
- 5.3.3. Specialty Stores
- 5.3.4. Online Retail Stores
- 5.3.5. Other Distribution Channels
- 5.4. Market Analysis, Insights and Forecast - by Region
- 5.4.1. North America
- 5.4.2. Europe
- 5.4.3. Asia Pacific
- 5.4.4. South America
- 5.4.5. Middle East and Africa
- 5.1. Market Analysis, Insights and Forecast - by Category
- 6. North America Fruit & Vegetable Juice Market Analysis, Insights and Forecast, 2019-2031
- 6.1. Market Analysis, Insights and Forecast - by Category
- 6.1.1. Fruit
- 6.1.2. Vegetable
- 6.2. Market Analysis, Insights and Forecast - by Type
- 6.2.1. Still Juice Drinks
- 6.2.2. 100% juice
- 6.2.3. Nectar
- 6.3. Market Analysis, Insights and Forecast - by Distribution Channel
- 6.3.1. Supermarkets/Hypermarkets
- 6.3.2. Convenience Stores
- 6.3.3. Specialty Stores
- 6.3.4. Online Retail Stores
- 6.3.5. Other Distribution Channels
- 6.1. Market Analysis, Insights and Forecast - by Category
- 7. Europe Fruit & Vegetable Juice Market Analysis, Insights and Forecast, 2019-2031
- 7.1. Market Analysis, Insights and Forecast - by Category
- 7.1.1. Fruit
- 7.1.2. Vegetable
- 7.2. Market Analysis, Insights and Forecast - by Type
- 7.2.1. Still Juice Drinks
- 7.2.2. 100% juice
- 7.2.3. Nectar
- 7.3. Market Analysis, Insights and Forecast - by Distribution Channel
- 7.3.1. Supermarkets/Hypermarkets
- 7.3.2. Convenience Stores
- 7.3.3. Specialty Stores
- 7.3.4. Online Retail Stores
- 7.3.5. Other Distribution Channels
- 7.1. Market Analysis, Insights and Forecast - by Category
- 8. Asia Pacific Fruit & Vegetable Juice Market Analysis, Insights and Forecast, 2019-2031
- 8.1. Market Analysis, Insights and Forecast - by Category
- 8.1.1. Fruit
- 8.1.2. Vegetable
- 8.2. Market Analysis, Insights and Forecast - by Type
- 8.2.1. Still Juice Drinks
- 8.2.2. 100% juice
- 8.2.3. Nectar
- 8.3. Market Analysis, Insights and Forecast - by Distribution Channel
- 8.3.1. Supermarkets/Hypermarkets
- 8.3.2. Convenience Stores
- 8.3.3. Specialty Stores
- 8.3.4. Online Retail Stores
- 8.3.5. Other Distribution Channels
- 8.1. Market Analysis, Insights and Forecast - by Category
- 9. South America Fruit & Vegetable Juice Market Analysis, Insights and Forecast, 2019-2031
- 9.1. Market Analysis, Insights and Forecast - by Category
- 9.1.1. Fruit
- 9.1.2. Vegetable
- 9.2. Market Analysis, Insights and Forecast - by Type
- 9.2.1. Still Juice Drinks
- 9.2.2. 100% juice
- 9.2.3. Nectar
- 9.3. Market Analysis, Insights and Forecast - by Distribution Channel
- 9.3.1. Supermarkets/Hypermarkets
- 9.3.2. Convenience Stores
- 9.3.3. Specialty Stores
- 9.3.4. Online Retail Stores
- 9.3.5. Other Distribution Channels
- 9.1. Market Analysis, Insights and Forecast - by Category
- 10. Middle East and Africa Fruit & Vegetable Juice Market Analysis, Insights and Forecast, 2019-2031
- 10.1. Market Analysis, Insights and Forecast - by Category
- 10.1.1. Fruit
- 10.1.2. Vegetable
- 10.2. Market Analysis, Insights and Forecast - by Type
- 10.2.1. Still Juice Drinks
- 10.2.2. 100% juice
- 10.2.3. Nectar
- 10.3. Market Analysis, Insights and Forecast - by Distribution Channel
- 10.3.1. Supermarkets/Hypermarkets
- 10.3.2. Convenience Stores
- 10.3.3. Specialty Stores
- 10.3.4. Online Retail Stores
- 10.3.5. Other Distribution Channels
- 10.1. Market Analysis, Insights and Forecast - by Category
- 11. North America Fruit & Vegetable Juice Market Analysis, Insights and Forecast, 2019-2031
- 11.1. Market Analysis, Insights and Forecast - By Country/Sub-region
- 11.1.1 United States
- 11.1.2 Canada
- 11.1.3 Mexico
- 11.1.4 Rest of North America
- 12. Europe Fruit & Vegetable Juice Market Analysis, Insights and Forecast, 2019-2031
- 12.1. Market Analysis, Insights and Forecast - By Country/Sub-region
- 12.1.1 United Kingdom
- 12.1.2 Germany
- 12.1.3 Spain
- 12.1.4 France
- 12.1.5 Italy
- 12.1.6 Russia
- 12.1.7 Rest of Europe
- 13. Asia Pacific Fruit & Vegetable Juice Market Analysis, Insights and Forecast, 2019-2031
- 13.1. Market Analysis, Insights and Forecast - By Country/Sub-region
- 13.1.1 China
- 13.1.2 Japan
- 13.1.3 India
- 13.1.4 Australia
- 13.1.5 Rest of Asia Pacific
- 14. South America Fruit & Vegetable Juice Market Analysis, Insights and Forecast, 2019-2031
- 14.1. Market Analysis, Insights and Forecast - By Country/Sub-region
- 14.1.1 Brazil
- 14.1.2 Argentina
- 14.1.3 Rest of South America
- 15. Middle East and Africa Fruit & Vegetable Juice Market Analysis, Insights and Forecast, 2019-2031
- 15.1. Market Analysis, Insights and Forecast - By Country/Sub-region
- 15.1.1 Saudi Arabia
- 15.1.2 South Africa
- 15.1.3 Rest of Middle East and Africa
- 16. Competitive Analysis
- 16.1. Global Market Share Analysis 2024
- 16.2. Company Profiles
- 16.2.1 Ocean Spray
- 16.2.1.1. Overview
- 16.2.1.2. Products
- 16.2.1.3. SWOT Analysis
- 16.2.1.4. Recent Developments
- 16.2.1.5. Financials (Based on Availability)
- 16.2.2 PepsiCo Inc
- 16.2.2.1. Overview
- 16.2.2.2. Products
- 16.2.2.3. SWOT Analysis
- 16.2.2.4. Recent Developments
- 16.2.2.5. Financials (Based on Availability)
- 16.2.3 Keurig Dr Pepper Inc
- 16.2.3.1. Overview
- 16.2.3.2. Products
- 16.2.3.3. SWOT Analysis
- 16.2.3.4. Recent Developments
- 16.2.3.5. Financials (Based on Availability)
- 16.2.4 Eckes Granini Group
- 16.2.4.1. Overview
- 16.2.4.2. Products
- 16.2.4.3. SWOT Analysis
- 16.2.4.4. Recent Developments
- 16.2.4.5. Financials (Based on Availability)
- 16.2.5 Fresh Del Monte
- 16.2.5.1. Overview
- 16.2.5.2. Products
- 16.2.5.3. SWOT Analysis
- 16.2.5.4. Recent Developments
- 16.2.5.5. Financials (Based on Availability)
- 16.2.6 The Kraft Heinz Company
- 16.2.6.1. Overview
- 16.2.6.2. Products
- 16.2.6.3. SWOT Analysis
- 16.2.6.4. Recent Developments
- 16.2.6.5. Financials (Based on Availability)
- 16.2.7 The Coca-Cola Company
- 16.2.7.1. Overview
- 16.2.7.2. Products
- 16.2.7.3. SWOT Analysis
- 16.2.7.4. Recent Developments
- 16.2.7.5. Financials (Based on Availability)
- 16.2.8 Campbell Soup Company
- 16.2.8.1. Overview
- 16.2.8.2. Products
- 16.2.8.3. SWOT Analysis
- 16.2.8.4. Recent Developments
- 16.2.8.5. Financials (Based on Availability)
- 16.2.9 Citrus World Inc
- 16.2.9.1. Overview
- 16.2.9.2. Products
- 16.2.9.3. SWOT Analysis
- 16.2.9.4. Recent Developments
- 16.2.9.5. Financials (Based on Availability)
- 16.2.10 Welch's
- 16.2.10.1. Overview
- 16.2.10.2. Products
- 16.2.10.3. SWOT Analysis
- 16.2.10.4. Recent Developments
- 16.2.10.5. Financials (Based on Availability)
- 16.2.1 Ocean Spray
List of Figures
- Figure 1: Global Fruit & Vegetable Juice Market Revenue Breakdown (Million, %) by Region 2024 & 2032
- Figure 2: Global Fruit & Vegetable Juice Market Volume Breakdown (K Litres, %) by Region 2024 & 2032
- Figure 3: North America Fruit & Vegetable Juice Market Revenue (Million), by Country 2024 & 2032
- Figure 4: North America Fruit & Vegetable Juice Market Volume (K Litres), by Country 2024 & 2032
- Figure 5: North America Fruit & Vegetable Juice Market Revenue Share (%), by Country 2024 & 2032
- Figure 6: North America Fruit & Vegetable Juice Market Volume Share (%), by Country 2024 & 2032
- Figure 7: Europe Fruit & Vegetable Juice Market Revenue (Million), by Country 2024 & 2032
- Figure 8: Europe Fruit & Vegetable Juice Market Volume (K Litres), by Country 2024 & 2032
- Figure 9: Europe Fruit & Vegetable Juice Market Revenue Share (%), by Country 2024 & 2032
- Figure 10: Europe Fruit & Vegetable Juice Market Volume Share (%), by Country 2024 & 2032
- Figure 11: Asia Pacific Fruit & Vegetable Juice Market Revenue (Million), by Country 2024 & 2032
- Figure 12: Asia Pacific Fruit & Vegetable Juice Market Volume (K Litres), by Country 2024 & 2032
- Figure 13: Asia Pacific Fruit & Vegetable Juice Market Revenue Share (%), by Country 2024 & 2032
- Figure 14: Asia Pacific Fruit & Vegetable Juice Market Volume Share (%), by Country 2024 & 2032
- Figure 15: South America Fruit & Vegetable Juice Market Revenue (Million), by Country 2024 & 2032
- Figure 16: South America Fruit & Vegetable Juice Market Volume (K Litres), by Country 2024 & 2032
- Figure 17: South America Fruit & Vegetable Juice Market Revenue Share (%), by Country 2024 & 2032
- Figure 18: South America Fruit & Vegetable Juice Market Volume Share (%), by Country 2024 & 2032
- Figure 19: Middle East and Africa Fruit & Vegetable Juice Market Revenue (Million), by Country 2024 & 2032
- Figure 20: Middle East and Africa Fruit & Vegetable Juice Market Volume (K Litres), by Country 2024 & 2032
- Figure 21: Middle East and Africa Fruit & Vegetable Juice Market Revenue Share (%), by Country 2024 & 2032
- Figure 22: Middle East and Africa Fruit & Vegetable Juice Market Volume Share (%), by Country 2024 & 2032
- Figure 23: North America Fruit & Vegetable Juice Market Revenue (Million), by Category 2024 & 2032
- Figure 24: North America Fruit & Vegetable Juice Market Volume (K Litres), by Category 2024 & 2032
- Figure 25: North America Fruit & Vegetable Juice Market Revenue Share (%), by Category 2024 & 2032
- Figure 26: North America Fruit & Vegetable Juice Market Volume Share (%), by Category 2024 & 2032
- Figure 27: North America Fruit & Vegetable Juice Market Revenue (Million), by Type 2024 & 2032
- Figure 28: North America Fruit & Vegetable Juice Market Volume (K Litres), by Type 2024 & 2032
- Figure 29: North America Fruit & Vegetable Juice Market Revenue Share (%), by Type 2024 & 2032
- Figure 30: North America Fruit & Vegetable Juice Market Volume Share (%), by Type 2024 & 2032
- Figure 31: North America Fruit & Vegetable Juice Market Revenue (Million), by Distribution Channel 2024 & 2032
- Figure 32: North America Fruit & Vegetable Juice Market Volume (K Litres), by Distribution Channel 2024 & 2032
- Figure 33: North America Fruit & Vegetable Juice Market Revenue Share (%), by Distribution Channel 2024 & 2032
- Figure 34: North America Fruit & Vegetable Juice Market Volume Share (%), by Distribution Channel 2024 & 2032
- Figure 35: North America Fruit & Vegetable Juice Market Revenue (Million), by Country 2024 & 2032
- Figure 36: North America Fruit & Vegetable Juice Market Volume (K Litres), by Country 2024 & 2032
- Figure 37: North America Fruit & Vegetable Juice Market Revenue Share (%), by Country 2024 & 2032
- Figure 38: North America Fruit & Vegetable Juice Market Volume Share (%), by Country 2024 & 2032
- Figure 39: Europe Fruit & Vegetable Juice Market Revenue (Million), by Category 2024 & 2032
- Figure 40: Europe Fruit & Vegetable Juice Market Volume (K Litres), by Category 2024 & 2032
- Figure 41: Europe Fruit & Vegetable Juice Market Revenue Share (%), by Category 2024 & 2032
- Figure 42: Europe Fruit & Vegetable Juice Market Volume Share (%), by Category 2024 & 2032
- Figure 43: Europe Fruit & Vegetable Juice Market Revenue (Million), by Type 2024 & 2032
- Figure 44: Europe Fruit & Vegetable Juice Market Volume (K Litres), by Type 2024 & 2032
- Figure 45: Europe Fruit & Vegetable Juice Market Revenue Share (%), by Type 2024 & 2032
- Figure 46: Europe Fruit & Vegetable Juice Market Volume Share (%), by Type 2024 & 2032
- Figure 47: Europe Fruit & Vegetable Juice Market Revenue (Million), by Distribution Channel 2024 & 2032
- Figure 48: Europe Fruit & Vegetable Juice Market Volume (K Litres), by Distribution Channel 2024 & 2032
- Figure 49: Europe Fruit & Vegetable Juice Market Revenue Share (%), by Distribution Channel 2024 & 2032
- Figure 50: Europe Fruit & Vegetable Juice Market Volume Share (%), by Distribution Channel 2024 & 2032
- Figure 51: Europe Fruit & Vegetable Juice Market Revenue (Million), by Country 2024 & 2032
- Figure 52: Europe Fruit & Vegetable Juice Market Volume (K Litres), by Country 2024 & 2032
- Figure 53: Europe Fruit & Vegetable Juice Market Revenue Share (%), by Country 2024 & 2032
- Figure 54: Europe Fruit & Vegetable Juice Market Volume Share (%), by Country 2024 & 2032
- Figure 55: Asia Pacific Fruit & Vegetable Juice Market Revenue (Million), by Category 2024 & 2032
- Figure 56: Asia Pacific Fruit & Vegetable Juice Market Volume (K Litres), by Category 2024 & 2032
- Figure 57: Asia Pacific Fruit & Vegetable Juice Market Revenue Share (%), by Category 2024 & 2032
- Figure 58: Asia Pacific Fruit & Vegetable Juice Market Volume Share (%), by Category 2024 & 2032
- Figure 59: Asia Pacific Fruit & Vegetable Juice Market Revenue (Million), by Type 2024 & 2032
- Figure 60: Asia Pacific Fruit & Vegetable Juice Market Volume (K Litres), by Type 2024 & 2032
- Figure 61: Asia Pacific Fruit & Vegetable Juice Market Revenue Share (%), by Type 2024 & 2032
- Figure 62: Asia Pacific Fruit & Vegetable Juice Market Volume Share (%), by Type 2024 & 2032
- Figure 63: Asia Pacific Fruit & Vegetable Juice Market Revenue (Million), by Distribution Channel 2024 & 2032
- Figure 64: Asia Pacific Fruit & Vegetable Juice Market Volume (K Litres), by Distribution Channel 2024 & 2032
- Figure 65: Asia Pacific Fruit & Vegetable Juice Market Revenue Share (%), by Distribution Channel 2024 & 2032
- Figure 66: Asia Pacific Fruit & Vegetable Juice Market Volume Share (%), by Distribution Channel 2024 & 2032
- Figure 67: Asia Pacific Fruit & Vegetable Juice Market Revenue (Million), by Country 2024 & 2032
- Figure 68: Asia Pacific Fruit & Vegetable Juice Market Volume (K Litres), by Country 2024 & 2032
- Figure 69: Asia Pacific Fruit & Vegetable Juice Market Revenue Share (%), by Country 2024 & 2032
- Figure 70: Asia Pacific Fruit & Vegetable Juice Market Volume Share (%), by Country 2024 & 2032
- Figure 71: South America Fruit & Vegetable Juice Market Revenue (Million), by Category 2024 & 2032
- Figure 72: South America Fruit & Vegetable Juice Market Volume (K Litres), by Category 2024 & 2032
- Figure 73: South America Fruit & Vegetable Juice Market Revenue Share (%), by Category 2024 & 2032
- Figure 74: South America Fruit & Vegetable Juice Market Volume Share (%), by Category 2024 & 2032
- Figure 75: South America Fruit & Vegetable Juice Market Revenue (Million), by Type 2024 & 2032
- Figure 76: South America Fruit & Vegetable Juice Market Volume (K Litres), by Type 2024 & 2032
- Figure 77: South America Fruit & Vegetable Juice Market Revenue Share (%), by Type 2024 & 2032
- Figure 78: South America Fruit & Vegetable Juice Market Volume Share (%), by Type 2024 & 2032
- Figure 79: South America Fruit & Vegetable Juice Market Revenue (Million), by Distribution Channel 2024 & 2032
- Figure 80: South America Fruit & Vegetable Juice Market Volume (K Litres), by Distribution Channel 2024 & 2032
- Figure 81: South America Fruit & Vegetable Juice Market Revenue Share (%), by Distribution Channel 2024 & 2032
- Figure 82: South America Fruit & Vegetable Juice Market Volume Share (%), by Distribution Channel 2024 & 2032
- Figure 83: South America Fruit & Vegetable Juice Market Revenue (Million), by Country 2024 & 2032
- Figure 84: South America Fruit & Vegetable Juice Market Volume (K Litres), by Country 2024 & 2032
- Figure 85: South America Fruit & Vegetable Juice Market Revenue Share (%), by Country 2024 & 2032
- Figure 86: South America Fruit & Vegetable Juice Market Volume Share (%), by Country 2024 & 2032
- Figure 87: Middle East and Africa Fruit & Vegetable Juice Market Revenue (Million), by Category 2024 & 2032
- Figure 88: Middle East and Africa Fruit & Vegetable Juice Market Volume (K Litres), by Category 2024 & 2032
- Figure 89: Middle East and Africa Fruit & Vegetable Juice Market Revenue Share (%), by Category 2024 & 2032
- Figure 90: Middle East and Africa Fruit & Vegetable Juice Market Volume Share (%), by Category 2024 & 2032
- Figure 91: Middle East and Africa Fruit & Vegetable Juice Market Revenue (Million), by Type 2024 & 2032
- Figure 92: Middle East and Africa Fruit & Vegetable Juice Market Volume (K Litres), by Type 2024 & 2032
- Figure 93: Middle East and Africa Fruit & Vegetable Juice Market Revenue Share (%), by Type 2024 & 2032
- Figure 94: Middle East and Africa Fruit & Vegetable Juice Market Volume Share (%), by Type 2024 & 2032
- Figure 95: Middle East and Africa Fruit & Vegetable Juice Market Revenue (Million), by Distribution Channel 2024 & 2032
- Figure 96: Middle East and Africa Fruit & Vegetable Juice Market Volume (K Litres), by Distribution Channel 2024 & 2032
- Figure 97: Middle East and Africa Fruit & Vegetable Juice Market Revenue Share (%), by Distribution Channel 2024 & 2032
- Figure 98: Middle East and Africa Fruit & Vegetable Juice Market Volume Share (%), by Distribution Channel 2024 & 2032
- Figure 99: Middle East and Africa Fruit & Vegetable Juice Market Revenue (Million), by Country 2024 & 2032
- Figure 100: Middle East and Africa Fruit & Vegetable Juice Market Volume (K Litres), by Country 2024 & 2032
- Figure 101: Middle East and Africa Fruit & Vegetable Juice Market Revenue Share (%), by Country 2024 & 2032
- Figure 102: Middle East and Africa Fruit & Vegetable Juice Market Volume Share (%), by Country 2024 & 2032
List of Tables
- Table 1: Global Fruit & Vegetable Juice Market Revenue Million Forecast, by Region 2019 & 2032
- Table 2: Global Fruit & Vegetable Juice Market Volume K Litres Forecast, by Region 2019 & 2032
- Table 3: Global Fruit & Vegetable Juice Market Revenue Million Forecast, by Category 2019 & 2032
- Table 4: Global Fruit & Vegetable Juice Market Volume K Litres Forecast, by Category 2019 & 2032
- Table 5: Global Fruit & Vegetable Juice Market Revenue Million Forecast, by Type 2019 & 2032
- Table 6: Global Fruit & Vegetable Juice Market Volume K Litres Forecast, by Type 2019 & 2032
- Table 7: Global Fruit & Vegetable Juice Market Revenue Million Forecast, by Distribution Channel 2019 & 2032
- Table 8: Global Fruit & Vegetable Juice Market Volume K Litres Forecast, by Distribution Channel 2019 & 2032
- Table 9: Global Fruit & Vegetable Juice Market Revenue Million Forecast, by Region 2019 & 2032
- Table 10: Global Fruit & Vegetable Juice Market Volume K Litres Forecast, by Region 2019 & 2032
- Table 11: Global Fruit & Vegetable Juice Market Revenue Million Forecast, by Country 2019 & 2032
- Table 12: Global Fruit & Vegetable Juice Market Volume K Litres Forecast, by Country 2019 & 2032
- Table 13: United States Fruit & Vegetable Juice Market Revenue (Million) Forecast, by Application 2019 & 2032
- Table 14: United States Fruit & Vegetable Juice Market Volume (K Litres) Forecast, by Application 2019 & 2032
- Table 15: Canada Fruit & Vegetable Juice Market Revenue (Million) Forecast, by Application 2019 & 2032
- Table 16: Canada Fruit & Vegetable Juice Market Volume (K Litres) Forecast, by Application 2019 & 2032
- Table 17: Mexico Fruit & Vegetable Juice Market Revenue (Million) Forecast, by Application 2019 & 2032
- Table 18: Mexico Fruit & Vegetable Juice Market Volume (K Litres) Forecast, by Application 2019 & 2032
- Table 19: Rest of North America Fruit & Vegetable Juice Market Revenue (Million) Forecast, by Application 2019 & 2032
- Table 20: Rest of North America Fruit & Vegetable Juice Market Volume (K Litres) Forecast, by Application 2019 & 2032
- Table 21: Global Fruit & Vegetable Juice Market Revenue Million Forecast, by Country 2019 & 2032
- Table 22: Global Fruit & Vegetable Juice Market Volume K Litres Forecast, by Country 2019 & 2032
- Table 23: United Kingdom Fruit & Vegetable Juice Market Revenue (Million) Forecast, by Application 2019 & 2032
- Table 24: United Kingdom Fruit & Vegetable Juice Market Volume (K Litres) Forecast, by Application 2019 & 2032
- Table 25: Germany Fruit & Vegetable Juice Market Revenue (Million) Forecast, by Application 2019 & 2032
- Table 26: Germany Fruit & Vegetable Juice Market Volume (K Litres) Forecast, by Application 2019 & 2032
- Table 27: Spain Fruit & Vegetable Juice Market Revenue (Million) Forecast, by Application 2019 & 2032
- Table 28: Spain Fruit & Vegetable Juice Market Volume (K Litres) Forecast, by Application 2019 & 2032
- Table 29: France Fruit & Vegetable Juice Market Revenue (Million) Forecast, by Application 2019 & 2032
- Table 30: France Fruit & Vegetable Juice Market Volume (K Litres) Forecast, by Application 2019 & 2032
- Table 31: Italy Fruit & Vegetable Juice Market Revenue (Million) Forecast, by Application 2019 & 2032
- Table 32: Italy Fruit & Vegetable Juice Market Volume (K Litres) Forecast, by Application 2019 & 2032
- Table 33: Russia Fruit & Vegetable Juice Market Revenue (Million) Forecast, by Application 2019 & 2032
- Table 34: Russia Fruit & Vegetable Juice Market Volume (K Litres) Forecast, by Application 2019 & 2032
- Table 35: Rest of Europe Fruit & Vegetable Juice Market Revenue (Million) Forecast, by Application 2019 & 2032
- Table 36: Rest of Europe Fruit & Vegetable Juice Market Volume (K Litres) Forecast, by Application 2019 & 2032
- Table 37: Global Fruit & Vegetable Juice Market Revenue Million Forecast, by Country 2019 & 2032
- Table 38: Global Fruit & Vegetable Juice Market Volume K Litres Forecast, by Country 2019 & 2032
- Table 39: China Fruit & Vegetable Juice Market Revenue (Million) Forecast, by Application 2019 & 2032
- Table 40: China Fruit & Vegetable Juice Market Volume (K Litres) Forecast, by Application 2019 & 2032
- Table 41: Japan Fruit & Vegetable Juice Market Revenue (Million) Forecast, by Application 2019 & 2032
- Table 42: Japan Fruit & Vegetable Juice Market Volume (K Litres) Forecast, by Application 2019 & 2032
- Table 43: India Fruit & Vegetable Juice Market Revenue (Million) Forecast, by Application 2019 & 2032
- Table 44: India Fruit & Vegetable Juice Market Volume (K Litres) Forecast, by Application 2019 & 2032
- Table 45: Australia Fruit & Vegetable Juice Market Revenue (Million) Forecast, by Application 2019 & 2032
- Table 46: Australia Fruit & Vegetable Juice Market Volume (K Litres) Forecast, by Application 2019 & 2032
- Table 47: Rest of Asia Pacific Fruit & Vegetable Juice Market Revenue (Million) Forecast, by Application 2019 & 2032
- Table 48: Rest of Asia Pacific Fruit & Vegetable Juice Market Volume (K Litres) Forecast, by Application 2019 & 2032
- Table 49: Global Fruit & Vegetable Juice Market Revenue Million Forecast, by Country 2019 & 2032
- Table 50: Global Fruit & Vegetable Juice Market Volume K Litres Forecast, by Country 2019 & 2032
- Table 51: Brazil Fruit & Vegetable Juice Market Revenue (Million) Forecast, by Application 2019 & 2032
- Table 52: Brazil Fruit & Vegetable Juice Market Volume (K Litres) Forecast, by Application 2019 & 2032
- Table 53: Argentina Fruit & Vegetable Juice Market Revenue (Million) Forecast, by Application 2019 & 2032
- Table 54: Argentina Fruit & Vegetable Juice Market Volume (K Litres) Forecast, by Application 2019 & 2032
- Table 55: Rest of South America Fruit & Vegetable Juice Market Revenue (Million) Forecast, by Application 2019 & 2032
- Table 56: Rest of South America Fruit & Vegetable Juice Market Volume (K Litres) Forecast, by Application 2019 & 2032
- Table 57: Global Fruit & Vegetable Juice Market Revenue Million Forecast, by Country 2019 & 2032
- Table 58: Global Fruit & Vegetable Juice Market Volume K Litres Forecast, by Country 2019 & 2032
- Table 59: Saudi Arabia Fruit & Vegetable Juice Market Revenue (Million) Forecast, by Application 2019 & 2032
- Table 60: Saudi Arabia Fruit & Vegetable Juice Market Volume (K Litres) Forecast, by Application 2019 & 2032
- Table 61: South Africa Fruit & Vegetable Juice Market Revenue (Million) Forecast, by Application 2019 & 2032
- Table 62: South Africa Fruit & Vegetable Juice Market Volume (K Litres) Forecast, by Application 2019 & 2032
- Table 63: Rest of Middle East and Africa Fruit & Vegetable Juice Market Revenue (Million) Forecast, by Application 2019 & 2032
- Table 64: Rest of Middle East and Africa Fruit & Vegetable Juice Market Volume (K Litres) Forecast, by Application 2019 & 2032
- Table 65: Global Fruit & Vegetable Juice Market Revenue Million Forecast, by Category 2019 & 2032
- Table 66: Global Fruit & Vegetable Juice Market Volume K Litres Forecast, by Category 2019 & 2032
- Table 67: Global Fruit & Vegetable Juice Market Revenue Million Forecast, by Type 2019 & 2032
- Table 68: Global Fruit & Vegetable Juice Market Volume K Litres Forecast, by Type 2019 & 2032
- Table 69: Global Fruit & Vegetable Juice Market Revenue Million Forecast, by Distribution Channel 2019 & 2032
- Table 70: Global Fruit & Vegetable Juice Market Volume K Litres Forecast, by Distribution Channel 2019 & 2032
- Table 71: Global Fruit & Vegetable Juice Market Revenue Million Forecast, by Country 2019 & 2032
- Table 72: Global Fruit & Vegetable Juice Market Volume K Litres Forecast, by Country 2019 & 2032
- Table 73: United States Fruit & Vegetable Juice Market Revenue (Million) Forecast, by Application 2019 & 2032
- Table 74: United States Fruit & Vegetable Juice Market Volume (K Litres) Forecast, by Application 2019 & 2032
- Table 75: Canada Fruit & Vegetable Juice Market Revenue (Million) Forecast, by Application 2019 & 2032
- Table 76: Canada Fruit & Vegetable Juice Market Volume (K Litres) Forecast, by Application 2019 & 2032
- Table 77: Mexico Fruit & Vegetable Juice Market Revenue (Million) Forecast, by Application 2019 & 2032
- Table 78: Mexico Fruit & Vegetable Juice Market Volume (K Litres) Forecast, by Application 2019 & 2032
- Table 79: Rest of North America Fruit & Vegetable Juice Market Revenue (Million) Forecast, by Application 2019 & 2032
- Table 80: Rest of North America Fruit & Vegetable Juice Market Volume (K Litres) Forecast, by Application 2019 & 2032
- Table 81: Global Fruit & Vegetable Juice Market Revenue Million Forecast, by Category 2019 & 2032
- Table 82: Global Fruit & Vegetable Juice Market Volume K Litres Forecast, by Category 2019 & 2032
- Table 83: Global Fruit & Vegetable Juice Market Revenue Million Forecast, by Type 2019 & 2032
- Table 84: Global Fruit & Vegetable Juice Market Volume K Litres Forecast, by Type 2019 & 2032
- Table 85: Global Fruit & Vegetable Juice Market Revenue Million Forecast, by Distribution Channel 2019 & 2032
- Table 86: Global Fruit & Vegetable Juice Market Volume K Litres Forecast, by Distribution Channel 2019 & 2032
- Table 87: Global Fruit & Vegetable Juice Market Revenue Million Forecast, by Country 2019 & 2032
- Table 88: Global Fruit & Vegetable Juice Market Volume K Litres Forecast, by Country 2019 & 2032
- Table 89: United Kingdom Fruit & Vegetable Juice Market Revenue (Million) Forecast, by Application 2019 & 2032
- Table 90: United Kingdom Fruit & Vegetable Juice Market Volume (K Litres) Forecast, by Application 2019 & 2032
- Table 91: Germany Fruit & Vegetable Juice Market Revenue (Million) Forecast, by Application 2019 & 2032
- Table 92: Germany Fruit & Vegetable Juice Market Volume (K Litres) Forecast, by Application 2019 & 2032
- Table 93: Spain Fruit & Vegetable Juice Market Revenue (Million) Forecast, by Application 2019 & 2032
- Table 94: Spain Fruit & Vegetable Juice Market Volume (K Litres) Forecast, by Application 2019 & 2032
- Table 95: France Fruit & Vegetable Juice Market Revenue (Million) Forecast, by Application 2019 & 2032
- Table 96: France Fruit & Vegetable Juice Market Volume (K Litres) Forecast, by Application 2019 & 2032
- Table 97: Italy Fruit & Vegetable Juice Market Revenue (Million) Forecast, by Application 2019 & 2032
- Table 98: Italy Fruit & Vegetable Juice Market Volume (K Litres) Forecast, by Application 2019 & 2032
- Table 99: Russia Fruit & Vegetable Juice Market Revenue (Million) Forecast, by Application 2019 & 2032
- Table 100: Russia Fruit & Vegetable Juice Market Volume (K Litres) Forecast, by Application 2019 & 2032
- Table 101: Rest of Europe Fruit & Vegetable Juice Market Revenue (Million) Forecast, by Application 2019 & 2032
- Table 102: Rest of Europe Fruit & Vegetable Juice Market Volume (K Litres) Forecast, by Application 2019 & 2032
- Table 103: Global Fruit & Vegetable Juice Market Revenue Million Forecast, by Category 2019 & 2032
- Table 104: Global Fruit & Vegetable Juice Market Volume K Litres Forecast, by Category 2019 & 2032
- Table 105: Global Fruit & Vegetable Juice Market Revenue Million Forecast, by Type 2019 & 2032
- Table 106: Global Fruit & Vegetable Juice Market Volume K Litres Forecast, by Type 2019 & 2032
- Table 107: Global Fruit & Vegetable Juice Market Revenue Million Forecast, by Distribution Channel 2019 & 2032
- Table 108: Global Fruit & Vegetable Juice Market Volume K Litres Forecast, by Distribution Channel 2019 & 2032
- Table 109: Global Fruit & Vegetable Juice Market Revenue Million Forecast, by Country 2019 & 2032
- Table 110: Global Fruit & Vegetable Juice Market Volume K Litres Forecast, by Country 2019 & 2032
- Table 111: China Fruit & Vegetable Juice Market Revenue (Million) Forecast, by Application 2019 & 2032
- Table 112: China Fruit & Vegetable Juice Market Volume (K Litres) Forecast, by Application 2019 & 2032
- Table 113: Japan Fruit & Vegetable Juice Market Revenue (Million) Forecast, by Application 2019 & 2032
- Table 114: Japan Fruit & Vegetable Juice Market Volume (K Litres) Forecast, by Application 2019 & 2032
- Table 115: India Fruit & Vegetable Juice Market Revenue (Million) Forecast, by Application 2019 & 2032
- Table 116: India Fruit & Vegetable Juice Market Volume (K Litres) Forecast, by Application 2019 & 2032
- Table 117: Australia Fruit & Vegetable Juice Market Revenue (Million) Forecast, by Application 2019 & 2032
- Table 118: Australia Fruit & Vegetable Juice Market Volume (K Litres) Forecast, by Application 2019 & 2032
- Table 119: Rest of Asia Pacific Fruit & Vegetable Juice Market Revenue (Million) Forecast, by Application 2019 & 2032
- Table 120: Rest of Asia Pacific Fruit & Vegetable Juice Market Volume (K Litres) Forecast, by Application 2019 & 2032
- Table 121: Global Fruit & Vegetable Juice Market Revenue Million Forecast, by Category 2019 & 2032
- Table 122: Global Fruit & Vegetable Juice Market Volume K Litres Forecast, by Category 2019 & 2032
- Table 123: Global Fruit & Vegetable Juice Market Revenue Million Forecast, by Type 2019 & 2032
- Table 124: Global Fruit & Vegetable Juice Market Volume K Litres Forecast, by Type 2019 & 2032
- Table 125: Global Fruit & Vegetable Juice Market Revenue Million Forecast, by Distribution Channel 2019 & 2032
- Table 126: Global Fruit & Vegetable Juice Market Volume K Litres Forecast, by Distribution Channel 2019 & 2032
- Table 127: Global Fruit & Vegetable Juice Market Revenue Million Forecast, by Country 2019 & 2032
- Table 128: Global Fruit & Vegetable Juice Market Volume K Litres Forecast, by Country 2019 & 2032
- Table 129: Brazil Fruit & Vegetable Juice Market Revenue (Million) Forecast, by Application 2019 & 2032
- Table 130: Brazil Fruit & Vegetable Juice Market Volume (K Litres) Forecast, by Application 2019 & 2032
- Table 131: Argentina Fruit & Vegetable Juice Market Revenue (Million) Forecast, by Application 2019 & 2032
- Table 132: Argentina Fruit & Vegetable Juice Market Volume (K Litres) Forecast, by Application 2019 & 2032
- Table 133: Rest of South America Fruit & Vegetable Juice Market Revenue (Million) Forecast, by Application 2019 & 2032
- Table 134: Rest of South America Fruit & Vegetable Juice Market Volume (K Litres) Forecast, by Application 2019 & 2032
- Table 135: Global Fruit & Vegetable Juice Market Revenue Million Forecast, by Category 2019 & 2032
- Table 136: Global Fruit & Vegetable Juice Market Volume K Litres Forecast, by Category 2019 & 2032
- Table 137: Global Fruit & Vegetable Juice Market Revenue Million Forecast, by Type 2019 & 2032
- Table 138: Global Fruit & Vegetable Juice Market Volume K Litres Forecast, by Type 2019 & 2032
- Table 139: Global Fruit & Vegetable Juice Market Revenue Million Forecast, by Distribution Channel 2019 & 2032
- Table 140: Global Fruit & Vegetable Juice Market Volume K Litres Forecast, by Distribution Channel 2019 & 2032
- Table 141: Global Fruit & Vegetable Juice Market Revenue Million Forecast, by Country 2019 & 2032
- Table 142: Global Fruit & Vegetable Juice Market Volume K Litres Forecast, by Country 2019 & 2032
- Table 143: Saudi Arabia Fruit & Vegetable Juice Market Revenue (Million) Forecast, by Application 2019 & 2032
- Table 144: Saudi Arabia Fruit & Vegetable Juice Market Volume (K Litres) Forecast, by Application 2019 & 2032
- Table 145: South Africa Fruit & Vegetable Juice Market Revenue (Million) Forecast, by Application 2019 & 2032
- Table 146: South Africa Fruit & Vegetable Juice Market Volume (K Litres) Forecast, by Application 2019 & 2032
- Table 147: Rest of Middle East and Africa Fruit & Vegetable Juice Market Revenue (Million) Forecast, by Application 2019 & 2032
- Table 148: Rest of Middle East and Africa Fruit & Vegetable Juice Market Volume (K Litres) Forecast, by Application 2019 & 2032
Frequently Asked Questions
1. What is the projected Compound Annual Growth Rate (CAGR) of the Fruit & Vegetable Juice Market?
The projected CAGR is approximately 4.85%.
2. Which companies are prominent players in the Fruit & Vegetable Juice Market?
Key companies in the market include Ocean Spray, PepsiCo Inc, Keurig Dr Pepper Inc, Eckes Granini Group, Fresh Del Monte, The Kraft Heinz Company, The Coca-Cola Company, Campbell Soup Company, Citrus World Inc, Welch's.
3. What are the main segments of the Fruit & Vegetable Juice Market?
The market segments include Category, Type, Distribution Channel.
4. Can you provide details about the market size?
The market size is estimated to be USD XX Million as of 2022.
5. What are some drivers contributing to market growth?
Growing consumer awareness about health and wellness has increased the demand for nutritious beverages.
6. What are the notable trends driving market growth?
Rising demand for organic and natural juices free from additives and preservatives.
7. Are there any restraints impacting market growth?
Adverse Effects of Overconsumption of Products.
8. Can you provide examples of recent developments in the market?
In July 2022, Tipco, a Thailand-based juice company, launched a variety of vegetable juice and herb-infused drinks in the South East Asian and Middle-Eastern markets. The different flavors of herb-infused drinks include curcumin and finger root.
9. What pricing options are available for accessing the report?
Pricing options include single-user, multi-user, and enterprise licenses priced at USD 4750, USD 5250, and USD 8750 respectively.
10. Is the market size provided in terms of value or volume?
The market size is provided in terms of value, measured in Million and volume, measured in K Litres.
11. Are there any specific market keywords associated with the report?
Yes, the market keyword associated with the report is "Fruit & Vegetable Juice Market," which aids in identifying and referencing the specific market segment covered.
12. How do I determine which pricing option suits my needs best?
The pricing options vary based on user requirements and access needs. Individual users may opt for single-user licenses, while businesses requiring broader access may choose multi-user or enterprise licenses for cost-effective access to the report.
13. Are there any additional resources or data provided in the Fruit & Vegetable Juice Market report?
While the report offers comprehensive insights, it's advisable to review the specific contents or supplementary materials provided to ascertain if additional resources or data are available.
14. How can I stay updated on further developments or reports in the Fruit & Vegetable Juice Market?
To stay informed about further developments, trends, and reports in the Fruit & Vegetable Juice Market, consider subscribing to industry newsletters, following relevant companies and organizations, or regularly checking reputable industry news sources and publications.
Methodology
Step 1 - Identification of Relevant Samples Size from Population Database


Step 2 - Approaches for Defining Global Market Size (Value, Volume* & Price*)

Note*: In applicable scenarios
Step 3 - Data Sources
Primary Research
- Web Analytics
- Survey Reports
- Research Institute
- Latest Research Reports
- Opinion Leaders
Secondary Research
- Annual Reports
- White Paper
- Latest Press Release
- Industry Association
- Paid Database
- Investor Presentations

Step 4 - Data Triangulation
Involves using different sources of information in order to increase the validity of a study
These sources are likely to be stakeholders in a program - participants, other researchers, program staff, other community members, and so on.
Then we put all data in single framework & apply various statistical tools to find out the dynamic on the market.
During the analysis stage, feedback from the stakeholder groups would be compared to determine areas of agreement as well as areas of divergence


