Key Insights
The global gin market, projected for substantial expansion, is anticipated to reach $24.4 billion by 2025, with a Compound Annual Growth Rate (CAGR) of 3.8% from 2025 to 2033. Key growth drivers include the escalating popularity of craft gins, renowned for their distinctive flavors and premium appeal, and a growing consumer inclination towards sophisticated alcoholic beverages, particularly among younger demographics. The market is segmented by gin type, with London Dry Gin holding a commanding position, and by distribution channel (On-Trade and Off-Trade). Geographically, North America and Europe are established consumer hubs, while the Asia-Pacific region presents significant growth opportunities, fueled by rising disposable incomes and evolving consumer tastes. Despite challenges like increasing excise duties and volatile raw material costs, innovation within the gin sector and prevailing consumer trends are expected to sustain positive market momentum.
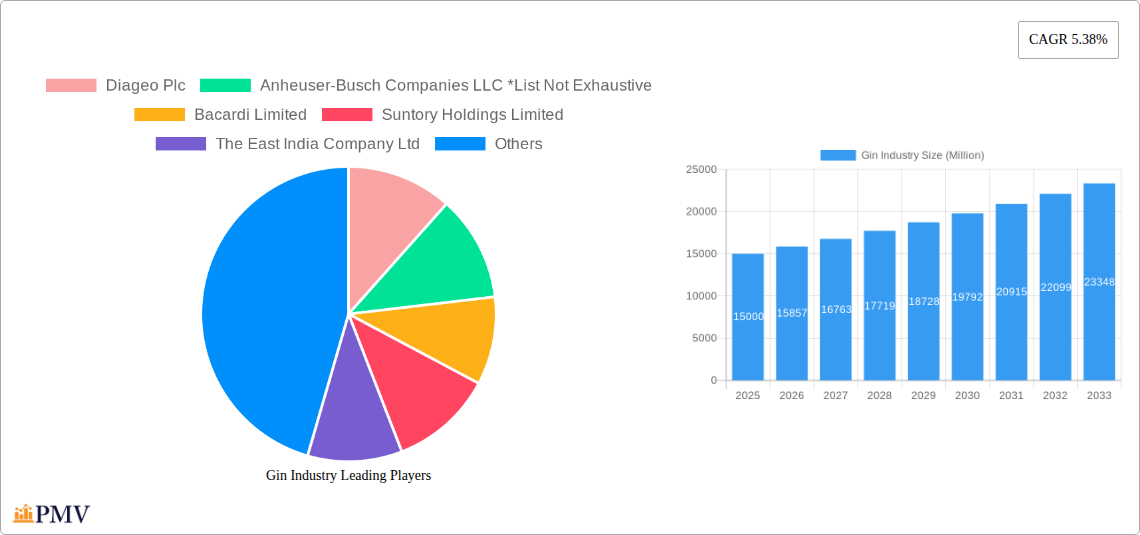
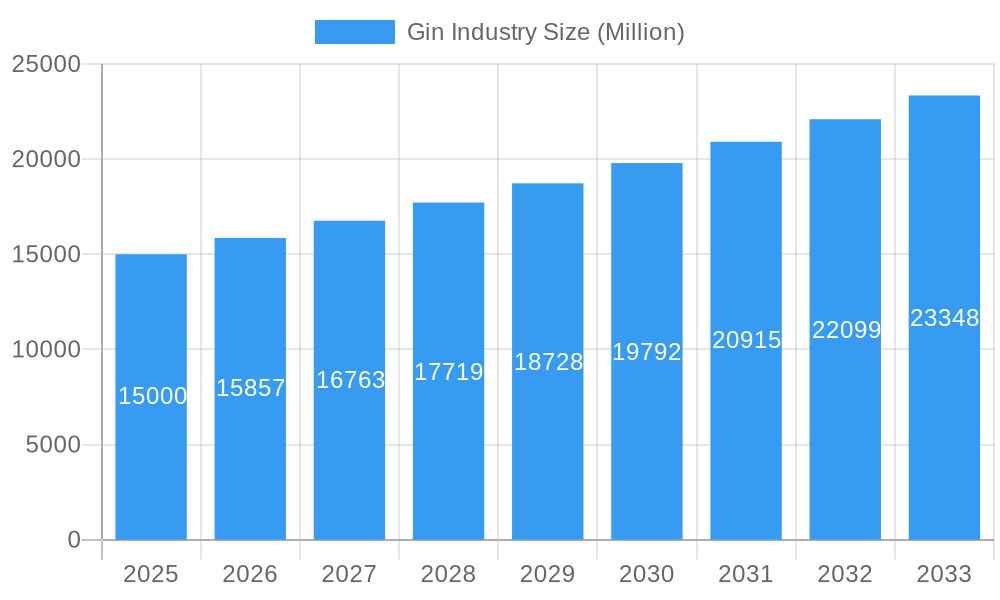
Gin Industry Market Size (In Billion)
The competitive environment features a mix of major multinational corporations and agile craft distilleries. Companies are deploying varied strategies, from broad market distribution of established brands to focused marketing of artisanal products, fostering a dynamic market with diverse offerings. Future growth hinges on ongoing flavor innovation, expansion into emerging markets, especially in Asia-Pacific and South America, and strategic marketing emphasizing premiumization and craft trends. Sustained market development requires balancing premium brand appeal with accessible pricing to ensure widespread consumer engagement.
Gin Industry Company Market Share
Gin Industry: A Comprehensive Market Report (2019-2033)
This comprehensive report provides a detailed analysis of the global gin industry, offering invaluable insights for industry stakeholders, investors, and market researchers. With a study period spanning 2019-2033, a base year of 2025, and an estimated and forecast period of 2025-2033, this report delivers a robust understanding of historical trends and future growth projections. The report's meticulous analysis covers key market segments, leading players, and emerging industry developments, projecting a market valued at xx Million by 2033.
Gin Industry Market Structure & Competitive Dynamics
The global gin market exhibits a moderately concentrated structure, dominated by a few multinational players like Diageo Plc, Bacardi Limited, Suntory Holdings Limited, Pernod Ricard, and William Grant & Sons Ltd, alongside several regional and niche players. These companies account for approximately xx Million in revenue, holding a combined market share of xx%. The industry is characterized by intense competition driven by innovation in product offerings, brand building, and strategic acquisitions and mergers.
Market Concentration: The Herfindahl-Hirschman Index (HHI) for the gin market stands at xx, indicating a moderately concentrated market.
Innovation Ecosystem: Companies are actively investing in R&D to develop new flavor profiles, packaging, and distribution models. This includes the expansion of ready-to-drink (RTD) options and premium offerings targeting specific consumer segments.
Regulatory Frameworks: Varying regulations across countries affect pricing, labeling, and distribution, leading to varying market access opportunities.
Product Substitutes: The market faces competition from other alcoholic beverages, such as vodka, whiskey, and rum.
End-User Trends: Growing consumer preference for premium and craft gins, coupled with increasing demand for RTDs are key drivers.
M&A Activities: Significant M&A activity has been observed, exemplified by Diageo's investment in Nao Spirits in 2022. While precise deal values are not publicly available for all transactions, significant investments in the range of xx Million have been observed over the last five years.
Gin Industry Industry Trends & Insights
The global gin market is witnessing robust growth, driven by several factors. The compound annual growth rate (CAGR) during the historical period (2019-2024) was xx%, and the forecast period (2025-2033) projects a CAGR of xx%. This growth is fueled by several key trends:
- Premiumization: Consumers are increasingly seeking premium and artisanal gins, leading to higher average selling prices.
- Flavor Innovation: The introduction of new and exciting flavor profiles, such as Bombay Sapphire Citron Presse gin, appeals to a broader consumer base.
- Ready-to-Drink (RTD) Growth: The popularity of RTD gins is significantly expanding the market's accessibility and convenience.
- Craft Gin Boom: The emergence of smaller, independent distilleries offering unique and locally-sourced gins is contributing to market diversity.
- E-commerce Expansion: Online sales channels are creating new market opportunities and reaching a wider customer base.
- Health & Wellness: While not directly related to the product itself, an increase in mindful consumption is impacting the overall alcoholic beverage market, including gin. Consumers are focusing on responsible consumption and high-quality products.
- Changing Consumer Preferences: Younger consumers show a preference for flavorful and unique experiences, driving innovation in this space. There's also a trend towards more eco-conscious brands and sustainable practices within the industry.
- Geographical Expansion: Gin's popularity continues to rise in emerging markets, leading to increased market penetration.
Dominant Markets & Segments in Gin Industry
The global gin market is diverse, with strong regional variations. However, specific data on regional dominance requires further analysis. The European Union region (xx%) and the United States (xx%) currently account for the lion's share of global gin consumption. While precise figures remain unavailable without accessing specialized market databases, these regions are consistently reported as dominant. The Asia-Pacific region, notably India, is projected for significant future growth, fuelled by increasing disposable incomes and changing drinking habits.
Type: The London Dry Gin segment holds the largest market share, driven by its classic profile and widespread appeal. However, “Other Types” including flavored gins are witnessing robust growth fueled by innovation.
Distribution Channel: The off-trade channel (retail) currently holds a larger market share compared to the on-trade (bars, restaurants) channel, reflecting changing consumer preferences.
Key Drivers (Examples):
- Economic Policies: Tax policies and import/export regulations influence market access and pricing.
- Infrastructure: Well-established distribution networks in mature markets support higher market penetration.
Gin Industry Product Innovations
Recent innovations include the launch of flavored gins (e.g., Bombay Sapphire Citron Presse), premium gins targeting specific consumer demographics (e.g., Hendrick's Neptunia), and the expansion of RTD gin-based cocktails. These developments capitalize on consumer preference for diverse flavors, convenience, and premium experiences. Technological advancements, such as improved distillation techniques and advanced flavor extraction methods, are driving product quality and innovation.
Report Segmentation & Scope
This report segments the gin market based on type (London Dry Gin, Old Tom Gin, Plymouth Gin, Other Types) and distribution channel (On-Trade, Off-Trade). Each segment’s market size, growth projections, and competitive dynamics are assessed, providing detailed insights into the market’s structure and future potential. For instance, the "Other Types" segment demonstrates consistent year-on-year growth exceeding xx%, while the "London Dry Gin" segment maintains the largest share, yet showcases a more moderate growth rate due to higher market saturation. The "On-Trade" segment is predicted to experience a slower recovery after pandemic-related restrictions, though future growth potential is there, especially with the increasing popularity of premium cocktails.
Key Drivers of Gin Industry Growth
Several factors are driving gin industry growth:
- Rising Disposable Incomes: Increased purchasing power in emerging markets fuels demand for premium alcoholic beverages.
- Changing Consumer Preferences: A preference for unique flavors and experiences is driving innovation.
- Strategic Marketing and Branding: Effective marketing campaigns create brand loyalty and drive consumer demand.
- Technological Advancements: Modern distillation techniques improve product quality and efficiency.
Challenges in the Gin Industry Sector
The gin industry faces several challenges:
- Intense Competition: The market is crowded, requiring brands to differentiate themselves effectively.
- Economic Downturns: Recessions can impact consumer spending on premium alcoholic beverages.
- Regulatory Changes: Varying alcohol regulations across countries create compliance complexities.
- Supply Chain Disruptions: Global supply chain challenges can impact the availability of raw materials. These disruptions have led to approximately xx Million in lost revenue for the industry over the past year.
Leading Players in the Gin Industry Market
- Diageo Plc
- Anheuser-Busch Companies LLC
- Bacardi Limited
- Suntory Holdings Limited
- The East India Company Ltd
- Remy Cointreau
- William Grant & Sons Ltd
- Radico Khaitan Ltd
- San Miguel Corporation
- Davide Campari-Milano N V
- Pernod Ricard
Key Developments in Gin Industry Sector
- April 2022: Bombay Sapphire (Bacardi) launched Citron Presse gin.
- March 2022: Diageo India invested in Nao Spirits.
- March 2022: William Grant & Sons launched Hendrick's Neptunia Gin.
- April 2021: Pernod Ricard introduced Beefeater RTD drinks in the UK.
Strategic Gin Industry Market Outlook
The gin industry is poised for continued growth, driven by premiumization, flavor innovation, and the expansion of RTD offerings. Strategic opportunities lie in leveraging emerging markets, adopting sustainable practices, and focusing on targeted marketing campaigns. The forecast suggests substantial growth potential over the next decade, offering significant opportunities for both established players and new entrants. Further research into emerging markets like Africa and South America will paint a clearer picture of future industry growth.
Gin Industry Segmentation
-
1. Type
- 1.1. London Dry Gin
- 1.2. Old Tom Gin
- 1.3. Plymouth Gin
- 1.4. Other Types
-
2. Distribution Channel
- 2.1. On -Trade
- 2.2. Off - Trade
Gin Industry Segmentation By Geography
-
1. North America
- 1.1. United States
- 1.2. Canada
- 1.3. Mexico
- 1.4. Rest of North America
-
2. Europe
- 2.1. United Kingdom
- 2.2. Germany
- 2.3. Spain
- 2.4. France
- 2.5. Italy
- 2.6. Russia
- 2.7. Rest of Europe
-
3. Asia Pacific
- 3.1. China
- 3.2. Japan
- 3.3. India
- 3.4. Australia
- 3.5. Rest of Asia Pacific
-
4. South America
- 4.1. Brazil
- 4.2. Argentina
- 4.3. Rest of South America
- 5. Middle East
-
6. Saudi Arabia
- 6.1. South Africa
- 6.2. Rest of Middle East
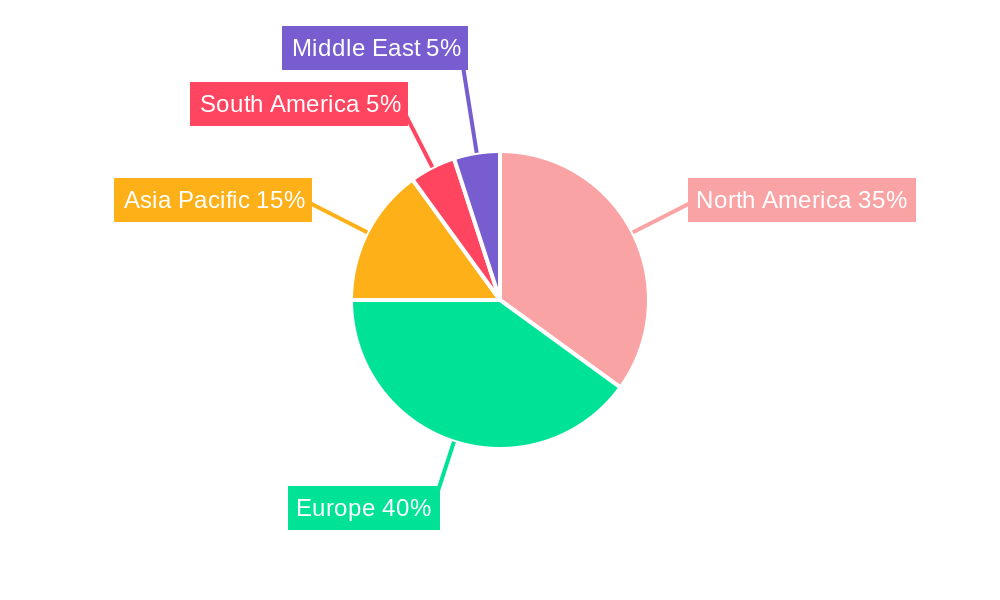
Gin Industry Regional Market Share
Geographic Coverage of Gin Industry
Gin Industry REPORT HIGHLIGHTS
| Aspects | Details |
|---|---|
| Study Period | 2020-2034 |
| Base Year | 2025 |
| Estimated Year | 2026 |
| Forecast Period | 2026-2034 |
| Historical Period | 2020-2025 |
| Growth Rate | CAGR of 3.8% from 2020-2034 |
| Segmentation |
|
Table of Contents
- 1. Introduction
- 1.1. Research Scope
- 1.2. Market Segmentation
- 1.3. Research Objective
- 1.4. Definitions and Assumptions
- 2. Executive Summary
- 2.1. Market Snapshot
- 3. Market Dynamics
- 3.1. Market Drivers
- 3.2. Market Restrains
- 3.3. Market Trends
- 3.4. Market Opportunities
- 4. Market Factor Analysis
- 4.1. Porters Five Forces
- 4.1.1. Bargaining Power of Suppliers
- 4.1.2. Bargaining Power of Buyers
- 4.1.3. Threat of New Entrants
- 4.1.4. Threat of Substitutes
- 4.1.5. Competitive Rivalry
- 4.2. PESTEL analysis
- 4.3. BCG Analysis
- 4.3.1. Stars (High Growth, High Market Share)
- 4.3.2. Cash Cows (Low Growth, High Market Share)
- 4.3.3. Question Mark (High Growth, Low Market Share)
- 4.3.4. Dogs (Low Growth, Low Market Share)
- 4.4. Ansoff Matrix Analysis
- 4.5. Supply Chain Analysis
- 4.6. Regulatory Landscape
- 4.7. Current Market Potential and Opportunity Assessment (TAM–SAM–SOM Framework)
- 4.8. PMV Analyst Note
- 4.1. Porters Five Forces
- 5. Market Analysis, Insights and Forecast 2021-2033
- 5.1. Market Analysis, Insights and Forecast - by Type
- 5.1.1. London Dry Gin
- 5.1.2. Old Tom Gin
- 5.1.3. Plymouth Gin
- 5.1.4. Other Types
- 5.2. Market Analysis, Insights and Forecast - by Distribution Channel
- 5.2.1. On -Trade
- 5.2.2. Off - Trade
- 5.3. Market Analysis, Insights and Forecast - by Region
- 5.3.1. North America
- 5.3.2. Europe
- 5.3.3. Asia Pacific
- 5.3.4. South America
- 5.3.5. Middle East
- 5.3.6. Saudi Arabia
- 5.1. Market Analysis, Insights and Forecast - by Type
- 6. Global Gin Industry Analysis, Insights and Forecast, 2021-2033
- 6.1. Market Analysis, Insights and Forecast - by Type
- 6.1.1. London Dry Gin
- 6.1.2. Old Tom Gin
- 6.1.3. Plymouth Gin
- 6.1.4. Other Types
- 6.2. Market Analysis, Insights and Forecast - by Distribution Channel
- 6.2.1. On -Trade
- 6.2.2. Off - Trade
- 6.1. Market Analysis, Insights and Forecast - by Type
- 7. North America Gin Industry Analysis, Insights and Forecast, 2020-2032
- 7.1. Market Analysis, Insights and Forecast - by Type
- 7.1.1. London Dry Gin
- 7.1.2. Old Tom Gin
- 7.1.3. Plymouth Gin
- 7.1.4. Other Types
- 7.2. Market Analysis, Insights and Forecast - by Distribution Channel
- 7.2.1. On -Trade
- 7.2.2. Off - Trade
- 7.1. Market Analysis, Insights and Forecast - by Type
- 8. Europe Gin Industry Analysis, Insights and Forecast, 2020-2032
- 8.1. Market Analysis, Insights and Forecast - by Type
- 8.1.1. London Dry Gin
- 8.1.2. Old Tom Gin
- 8.1.3. Plymouth Gin
- 8.1.4. Other Types
- 8.2. Market Analysis, Insights and Forecast - by Distribution Channel
- 8.2.1. On -Trade
- 8.2.2. Off - Trade
- 8.1. Market Analysis, Insights and Forecast - by Type
- 9. Asia Pacific Gin Industry Analysis, Insights and Forecast, 2020-2032
- 9.1. Market Analysis, Insights and Forecast - by Type
- 9.1.1. London Dry Gin
- 9.1.2. Old Tom Gin
- 9.1.3. Plymouth Gin
- 9.1.4. Other Types
- 9.2. Market Analysis, Insights and Forecast - by Distribution Channel
- 9.2.1. On -Trade
- 9.2.2. Off - Trade
- 9.1. Market Analysis, Insights and Forecast - by Type
- 10. South America Gin Industry Analysis, Insights and Forecast, 2020-2032
- 10.1. Market Analysis, Insights and Forecast - by Type
- 10.1.1. London Dry Gin
- 10.1.2. Old Tom Gin
- 10.1.3. Plymouth Gin
- 10.1.4. Other Types
- 10.2. Market Analysis, Insights and Forecast - by Distribution Channel
- 10.2.1. On -Trade
- 10.2.2. Off - Trade
- 10.1. Market Analysis, Insights and Forecast - by Type
- 11. Middle East Gin Industry Analysis, Insights and Forecast, 2020-2032
- 11.1. Market Analysis, Insights and Forecast - by Type
- 11.1.1. London Dry Gin
- 11.1.2. Old Tom Gin
- 11.1.3. Plymouth Gin
- 11.1.4. Other Types
- 11.2. Market Analysis, Insights and Forecast - by Distribution Channel
- 11.2.1. On -Trade
- 11.2.2. Off - Trade
- 11.1. Market Analysis, Insights and Forecast - by Type
- 12. Saudi Arabia Gin Industry Analysis, Insights and Forecast, 2020-2032
- 12.1. Market Analysis, Insights and Forecast - by Type
- 12.1.1. London Dry Gin
- 12.1.2. Old Tom Gin
- 12.1.3. Plymouth Gin
- 12.1.4. Other Types
- 12.2. Market Analysis, Insights and Forecast - by Distribution Channel
- 12.2.1. On -Trade
- 12.2.2. Off - Trade
- 12.1. Market Analysis, Insights and Forecast - by Type
- 13. Competitive Analysis
- 13.1. Company Profiles
- 13.1.1 Diageo Plc
- 13.1.1.1. Company Overview
- 13.1.1.2. Products
- 13.1.1.3. Company Financials
- 13.1.1.4. SWOT Analysis
- 13.1.2 Anheuser-Busch Companies LLC *List Not Exhaustive
- 13.1.2.1. Company Overview
- 13.1.2.2. Products
- 13.1.2.3. Company Financials
- 13.1.2.4. SWOT Analysis
- 13.1.3 Bacardi Limited
- 13.1.3.1. Company Overview
- 13.1.3.2. Products
- 13.1.3.3. Company Financials
- 13.1.3.4. SWOT Analysis
- 13.1.4 Suntory Holdings Limited
- 13.1.4.1. Company Overview
- 13.1.4.2. Products
- 13.1.4.3. Company Financials
- 13.1.4.4. SWOT Analysis
- 13.1.5 The East India Company Ltd
- 13.1.5.1. Company Overview
- 13.1.5.2. Products
- 13.1.5.3. Company Financials
- 13.1.5.4. SWOT Analysis
- 13.1.6 Remy Cointreau
- 13.1.6.1. Company Overview
- 13.1.6.2. Products
- 13.1.6.3. Company Financials
- 13.1.6.4. SWOT Analysis
- 13.1.7 William Grant & Sons Ltd
- 13.1.7.1. Company Overview
- 13.1.7.2. Products
- 13.1.7.3. Company Financials
- 13.1.7.4. SWOT Analysis
- 13.1.8 Radico Khaitan Ltd
- 13.1.8.1. Company Overview
- 13.1.8.2. Products
- 13.1.8.3. Company Financials
- 13.1.8.4. SWOT Analysis
- 13.1.9 San Miguel Corporation
- 13.1.9.1. Company Overview
- 13.1.9.2. Products
- 13.1.9.3. Company Financials
- 13.1.9.4. SWOT Analysis
- 13.1.10 Davide Campari-Milano N V
- 13.1.10.1. Company Overview
- 13.1.10.2. Products
- 13.1.10.3. Company Financials
- 13.1.10.4. SWOT Analysis
- 13.1.11 Pernod Ricard
- 13.1.11.1. Company Overview
- 13.1.11.2. Products
- 13.1.11.3. Company Financials
- 13.1.11.4. SWOT Analysis
- 13.1.1 Diageo Plc
- 13.2. Market Entropy
- 13.2.1 Company's Key Areas Served
- 13.2.2 Recent Developments
- 13.3. Company Market Share Analysis 2025
- 13.3.1 Top 5 Companies Market Share Analysis
- 13.3.2 Top 3 Companies Market Share Analysis
- 13.4. List of Potential Customers
- 14. Research Methodology
List of Figures
- Figure 1: Global Gin Industry Revenue Breakdown (billion, %) by Region 2025 & 2033
- Figure 2: Global Gin Industry Volume Breakdown (Billion, %) by Region 2025 & 2033
- Figure 3: North America Gin Industry Revenue (billion), by Type 2025 & 2033
- Figure 4: North America Gin Industry Volume (Billion), by Type 2025 & 2033
- Figure 5: North America Gin Industry Revenue Share (%), by Type 2025 & 2033
- Figure 6: North America Gin Industry Volume Share (%), by Type 2025 & 2033
- Figure 7: North America Gin Industry Revenue (billion), by Distribution Channel 2025 & 2033
- Figure 8: North America Gin Industry Volume (Billion), by Distribution Channel 2025 & 2033
- Figure 9: North America Gin Industry Revenue Share (%), by Distribution Channel 2025 & 2033
- Figure 10: North America Gin Industry Volume Share (%), by Distribution Channel 2025 & 2033
- Figure 11: North America Gin Industry Revenue (billion), by Country 2025 & 2033
- Figure 12: North America Gin Industry Volume (Billion), by Country 2025 & 2033
- Figure 13: North America Gin Industry Revenue Share (%), by Country 2025 & 2033
- Figure 14: North America Gin Industry Volume Share (%), by Country 2025 & 2033
- Figure 15: Europe Gin Industry Revenue (billion), by Type 2025 & 2033
- Figure 16: Europe Gin Industry Volume (Billion), by Type 2025 & 2033
- Figure 17: Europe Gin Industry Revenue Share (%), by Type 2025 & 2033
- Figure 18: Europe Gin Industry Volume Share (%), by Type 2025 & 2033
- Figure 19: Europe Gin Industry Revenue (billion), by Distribution Channel 2025 & 2033
- Figure 20: Europe Gin Industry Volume (Billion), by Distribution Channel 2025 & 2033
- Figure 21: Europe Gin Industry Revenue Share (%), by Distribution Channel 2025 & 2033
- Figure 22: Europe Gin Industry Volume Share (%), by Distribution Channel 2025 & 2033
- Figure 23: Europe Gin Industry Revenue (billion), by Country 2025 & 2033
- Figure 24: Europe Gin Industry Volume (Billion), by Country 2025 & 2033
- Figure 25: Europe Gin Industry Revenue Share (%), by Country 2025 & 2033
- Figure 26: Europe Gin Industry Volume Share (%), by Country 2025 & 2033
- Figure 27: Asia Pacific Gin Industry Revenue (billion), by Type 2025 & 2033
- Figure 28: Asia Pacific Gin Industry Volume (Billion), by Type 2025 & 2033
- Figure 29: Asia Pacific Gin Industry Revenue Share (%), by Type 2025 & 2033
- Figure 30: Asia Pacific Gin Industry Volume Share (%), by Type 2025 & 2033
- Figure 31: Asia Pacific Gin Industry Revenue (billion), by Distribution Channel 2025 & 2033
- Figure 32: Asia Pacific Gin Industry Volume (Billion), by Distribution Channel 2025 & 2033
- Figure 33: Asia Pacific Gin Industry Revenue Share (%), by Distribution Channel 2025 & 2033
- Figure 34: Asia Pacific Gin Industry Volume Share (%), by Distribution Channel 2025 & 2033
- Figure 35: Asia Pacific Gin Industry Revenue (billion), by Country 2025 & 2033
- Figure 36: Asia Pacific Gin Industry Volume (Billion), by Country 2025 & 2033
- Figure 37: Asia Pacific Gin Industry Revenue Share (%), by Country 2025 & 2033
- Figure 38: Asia Pacific Gin Industry Volume Share (%), by Country 2025 & 2033
- Figure 39: South America Gin Industry Revenue (billion), by Type 2025 & 2033
- Figure 40: South America Gin Industry Volume (Billion), by Type 2025 & 2033
- Figure 41: South America Gin Industry Revenue Share (%), by Type 2025 & 2033
- Figure 42: South America Gin Industry Volume Share (%), by Type 2025 & 2033
- Figure 43: South America Gin Industry Revenue (billion), by Distribution Channel 2025 & 2033
- Figure 44: South America Gin Industry Volume (Billion), by Distribution Channel 2025 & 2033
- Figure 45: South America Gin Industry Revenue Share (%), by Distribution Channel 2025 & 2033
- Figure 46: South America Gin Industry Volume Share (%), by Distribution Channel 2025 & 2033
- Figure 47: South America Gin Industry Revenue (billion), by Country 2025 & 2033
- Figure 48: South America Gin Industry Volume (Billion), by Country 2025 & 2033
- Figure 49: South America Gin Industry Revenue Share (%), by Country 2025 & 2033
- Figure 50: South America Gin Industry Volume Share (%), by Country 2025 & 2033
- Figure 51: Middle East Gin Industry Revenue (billion), by Type 2025 & 2033
- Figure 52: Middle East Gin Industry Volume (Billion), by Type 2025 & 2033
- Figure 53: Middle East Gin Industry Revenue Share (%), by Type 2025 & 2033
- Figure 54: Middle East Gin Industry Volume Share (%), by Type 2025 & 2033
- Figure 55: Middle East Gin Industry Revenue (billion), by Distribution Channel 2025 & 2033
- Figure 56: Middle East Gin Industry Volume (Billion), by Distribution Channel 2025 & 2033
- Figure 57: Middle East Gin Industry Revenue Share (%), by Distribution Channel 2025 & 2033
- Figure 58: Middle East Gin Industry Volume Share (%), by Distribution Channel 2025 & 2033
- Figure 59: Middle East Gin Industry Revenue (billion), by Country 2025 & 2033
- Figure 60: Middle East Gin Industry Volume (Billion), by Country 2025 & 2033
- Figure 61: Middle East Gin Industry Revenue Share (%), by Country 2025 & 2033
- Figure 62: Middle East Gin Industry Volume Share (%), by Country 2025 & 2033
- Figure 63: Saudi Arabia Gin Industry Revenue (billion), by Type 2025 & 2033
- Figure 64: Saudi Arabia Gin Industry Volume (Billion), by Type 2025 & 2033
- Figure 65: Saudi Arabia Gin Industry Revenue Share (%), by Type 2025 & 2033
- Figure 66: Saudi Arabia Gin Industry Volume Share (%), by Type 2025 & 2033
- Figure 67: Saudi Arabia Gin Industry Revenue (billion), by Distribution Channel 2025 & 2033
- Figure 68: Saudi Arabia Gin Industry Volume (Billion), by Distribution Channel 2025 & 2033
- Figure 69: Saudi Arabia Gin Industry Revenue Share (%), by Distribution Channel 2025 & 2033
- Figure 70: Saudi Arabia Gin Industry Volume Share (%), by Distribution Channel 2025 & 2033
- Figure 71: Saudi Arabia Gin Industry Revenue (billion), by Country 2025 & 2033
- Figure 72: Saudi Arabia Gin Industry Volume (Billion), by Country 2025 & 2033
- Figure 73: Saudi Arabia Gin Industry Revenue Share (%), by Country 2025 & 2033
- Figure 74: Saudi Arabia Gin Industry Volume Share (%), by Country 2025 & 2033
List of Tables
- Table 1: Global Gin Industry Revenue billion Forecast, by Type 2020 & 2033
- Table 2: Global Gin Industry Volume Billion Forecast, by Type 2020 & 2033
- Table 3: Global Gin Industry Revenue billion Forecast, by Distribution Channel 2020 & 2033
- Table 4: Global Gin Industry Volume Billion Forecast, by Distribution Channel 2020 & 2033
- Table 5: Global Gin Industry Revenue billion Forecast, by Region 2020 & 2033
- Table 6: Global Gin Industry Volume Billion Forecast, by Region 2020 & 2033
- Table 7: Global Gin Industry Revenue billion Forecast, by Type 2020 & 2033
- Table 8: Global Gin Industry Volume Billion Forecast, by Type 2020 & 2033
- Table 9: Global Gin Industry Revenue billion Forecast, by Distribution Channel 2020 & 2033
- Table 10: Global Gin Industry Volume Billion Forecast, by Distribution Channel 2020 & 2033
- Table 11: Global Gin Industry Revenue billion Forecast, by Country 2020 & 2033
- Table 12: Global Gin Industry Volume Billion Forecast, by Country 2020 & 2033
- Table 13: United States Gin Industry Revenue (billion) Forecast, by Application 2020 & 2033
- Table 14: United States Gin Industry Volume (Billion) Forecast, by Application 2020 & 2033
- Table 15: Canada Gin Industry Revenue (billion) Forecast, by Application 2020 & 2033
- Table 16: Canada Gin Industry Volume (Billion) Forecast, by Application 2020 & 2033
- Table 17: Mexico Gin Industry Revenue (billion) Forecast, by Application 2020 & 2033
- Table 18: Mexico Gin Industry Volume (Billion) Forecast, by Application 2020 & 2033
- Table 19: Rest of North America Gin Industry Revenue (billion) Forecast, by Application 2020 & 2033
- Table 20: Rest of North America Gin Industry Volume (Billion) Forecast, by Application 2020 & 2033
- Table 21: Global Gin Industry Revenue billion Forecast, by Type 2020 & 2033
- Table 22: Global Gin Industry Volume Billion Forecast, by Type 2020 & 2033
- Table 23: Global Gin Industry Revenue billion Forecast, by Distribution Channel 2020 & 2033
- Table 24: Global Gin Industry Volume Billion Forecast, by Distribution Channel 2020 & 2033
- Table 25: Global Gin Industry Revenue billion Forecast, by Country 2020 & 2033
- Table 26: Global Gin Industry Volume Billion Forecast, by Country 2020 & 2033
- Table 27: United Kingdom Gin Industry Revenue (billion) Forecast, by Application 2020 & 2033
- Table 28: United Kingdom Gin Industry Volume (Billion) Forecast, by Application 2020 & 2033
- Table 29: Germany Gin Industry Revenue (billion) Forecast, by Application 2020 & 2033
- Table 30: Germany Gin Industry Volume (Billion) Forecast, by Application 2020 & 2033
- Table 31: Spain Gin Industry Revenue (billion) Forecast, by Application 2020 & 2033
- Table 32: Spain Gin Industry Volume (Billion) Forecast, by Application 2020 & 2033
- Table 33: France Gin Industry Revenue (billion) Forecast, by Application 2020 & 2033
- Table 34: France Gin Industry Volume (Billion) Forecast, by Application 2020 & 2033
- Table 35: Italy Gin Industry Revenue (billion) Forecast, by Application 2020 & 2033
- Table 36: Italy Gin Industry Volume (Billion) Forecast, by Application 2020 & 2033
- Table 37: Russia Gin Industry Revenue (billion) Forecast, by Application 2020 & 2033
- Table 38: Russia Gin Industry Volume (Billion) Forecast, by Application 2020 & 2033
- Table 39: Rest of Europe Gin Industry Revenue (billion) Forecast, by Application 2020 & 2033
- Table 40: Rest of Europe Gin Industry Volume (Billion) Forecast, by Application 2020 & 2033
- Table 41: Global Gin Industry Revenue billion Forecast, by Type 2020 & 2033
- Table 42: Global Gin Industry Volume Billion Forecast, by Type 2020 & 2033
- Table 43: Global Gin Industry Revenue billion Forecast, by Distribution Channel 2020 & 2033
- Table 44: Global Gin Industry Volume Billion Forecast, by Distribution Channel 2020 & 2033
- Table 45: Global Gin Industry Revenue billion Forecast, by Country 2020 & 2033
- Table 46: Global Gin Industry Volume Billion Forecast, by Country 2020 & 2033
- Table 47: China Gin Industry Revenue (billion) Forecast, by Application 2020 & 2033
- Table 48: China Gin Industry Volume (Billion) Forecast, by Application 2020 & 2033
- Table 49: Japan Gin Industry Revenue (billion) Forecast, by Application 2020 & 2033
- Table 50: Japan Gin Industry Volume (Billion) Forecast, by Application 2020 & 2033
- Table 51: India Gin Industry Revenue (billion) Forecast, by Application 2020 & 2033
- Table 52: India Gin Industry Volume (Billion) Forecast, by Application 2020 & 2033
- Table 53: Australia Gin Industry Revenue (billion) Forecast, by Application 2020 & 2033
- Table 54: Australia Gin Industry Volume (Billion) Forecast, by Application 2020 & 2033
- Table 55: Rest of Asia Pacific Gin Industry Revenue (billion) Forecast, by Application 2020 & 2033
- Table 56: Rest of Asia Pacific Gin Industry Volume (Billion) Forecast, by Application 2020 & 2033
- Table 57: Global Gin Industry Revenue billion Forecast, by Type 2020 & 2033
- Table 58: Global Gin Industry Volume Billion Forecast, by Type 2020 & 2033
- Table 59: Global Gin Industry Revenue billion Forecast, by Distribution Channel 2020 & 2033
- Table 60: Global Gin Industry Volume Billion Forecast, by Distribution Channel 2020 & 2033
- Table 61: Global Gin Industry Revenue billion Forecast, by Country 2020 & 2033
- Table 62: Global Gin Industry Volume Billion Forecast, by Country 2020 & 2033
- Table 63: Brazil Gin Industry Revenue (billion) Forecast, by Application 2020 & 2033
- Table 64: Brazil Gin Industry Volume (Billion) Forecast, by Application 2020 & 2033
- Table 65: Argentina Gin Industry Revenue (billion) Forecast, by Application 2020 & 2033
- Table 66: Argentina Gin Industry Volume (Billion) Forecast, by Application 2020 & 2033
- Table 67: Rest of South America Gin Industry Revenue (billion) Forecast, by Application 2020 & 2033
- Table 68: Rest of South America Gin Industry Volume (Billion) Forecast, by Application 2020 & 2033
- Table 69: Global Gin Industry Revenue billion Forecast, by Type 2020 & 2033
- Table 70: Global Gin Industry Volume Billion Forecast, by Type 2020 & 2033
- Table 71: Global Gin Industry Revenue billion Forecast, by Distribution Channel 2020 & 2033
- Table 72: Global Gin Industry Volume Billion Forecast, by Distribution Channel 2020 & 2033
- Table 73: Global Gin Industry Revenue billion Forecast, by Country 2020 & 2033
- Table 74: Global Gin Industry Volume Billion Forecast, by Country 2020 & 2033
- Table 75: Global Gin Industry Revenue billion Forecast, by Type 2020 & 2033
- Table 76: Global Gin Industry Volume Billion Forecast, by Type 2020 & 2033
- Table 77: Global Gin Industry Revenue billion Forecast, by Distribution Channel 2020 & 2033
- Table 78: Global Gin Industry Volume Billion Forecast, by Distribution Channel 2020 & 2033
- Table 79: Global Gin Industry Revenue billion Forecast, by Country 2020 & 2033
- Table 80: Global Gin Industry Volume Billion Forecast, by Country 2020 & 2033
- Table 81: South Africa Gin Industry Revenue (billion) Forecast, by Application 2020 & 2033
- Table 82: South Africa Gin Industry Volume (Billion) Forecast, by Application 2020 & 2033
- Table 83: Rest of Middle East Gin Industry Revenue (billion) Forecast, by Application 2020 & 2033
- Table 84: Rest of Middle East Gin Industry Volume (Billion) Forecast, by Application 2020 & 2033
Frequently Asked Questions
1. What is the projected Compound Annual Growth Rate (CAGR) of the Gin Industry?
The projected CAGR is approximately 3.8%.
2. Which companies are prominent players in the Gin Industry?
Key companies in the market include Diageo Plc, Anheuser-Busch Companies LLC *List Not Exhaustive, Bacardi Limited, Suntory Holdings Limited, The East India Company Ltd, Remy Cointreau, William Grant & Sons Ltd, Radico Khaitan Ltd, San Miguel Corporation, Davide Campari-Milano N V, Pernod Ricard.
3. What are the main segments of the Gin Industry?
The market segments include Type, Distribution Channel.
4. Can you provide details about the market size?
The market size is estimated to be USD 24.4 billion as of 2022.
5. What are some drivers contributing to market growth?
Increasing Demand for Functional and Fortified Food; Multi-functionality and Wide Application of Riboflavin.
6. What are the notable trends driving market growth?
Infusion of Gin in Premium Cocktails.
7. Are there any restraints impacting market growth?
Low Stability of Riboflavin on Exposure to Light and Heat.
8. Can you provide examples of recent developments in the market?
In April 2022, Bombay Sapphire, a brand owned by Bacardi launched a lemon-flavored gin called Citron Presse gin, made with Mediterranean lemons. The company has planned to roll out new products across significant countries including Australia, Germany, Ireland Andorra, Belgium, France, Switzerland, Denmark, Austria, Spain, and Portugal.
9. What pricing options are available for accessing the report?
Pricing options include single-user, multi-user, and enterprise licenses priced at USD 4750, USD 5250, and USD 8750 respectively.
10. Is the market size provided in terms of value or volume?
The market size is provided in terms of value, measured in billion and volume, measured in Billion.
11. Are there any specific market keywords associated with the report?
Yes, the market keyword associated with the report is "Gin Industry," which aids in identifying and referencing the specific market segment covered.
12. How do I determine which pricing option suits my needs best?
The pricing options vary based on user requirements and access needs. Individual users may opt for single-user licenses, while businesses requiring broader access may choose multi-user or enterprise licenses for cost-effective access to the report.
13. Are there any additional resources or data provided in the Gin Industry report?
While the report offers comprehensive insights, it's advisable to review the specific contents or supplementary materials provided to ascertain if additional resources or data are available.
14. How can I stay updated on further developments or reports in the Gin Industry?
To stay informed about further developments, trends, and reports in the Gin Industry, consider subscribing to industry newsletters, following relevant companies and organizations, or regularly checking reputable industry news sources and publications.
Methodology
Step 1 - Identification of Relevant Samples Size from Population Database


Step 2 - Approaches for Defining Global Market Size (Value, Volume* & Price*)

Note*: In applicable scenarios
Step 3 - Data Sources
Primary Research
- Web Analytics
- Survey Reports
- Research Institute
- Latest Research Reports
- Opinion Leaders
Secondary Research
- Annual Reports
- White Paper
- Latest Press Release
- Industry Association
- Paid Database
- Investor Presentations

Step 4 - Data Triangulation
Involves using different sources of information in order to increase the validity of a study
These sources are likely to be stakeholders in a program - participants, other researchers, program staff, other community members, and so on.
Then we put all data in single framework & apply various statistical tools to find out the dynamic on the market.
During the analysis stage, feedback from the stakeholder groups would be compared to determine areas of agreement as well as areas of divergence

