
Key Insights
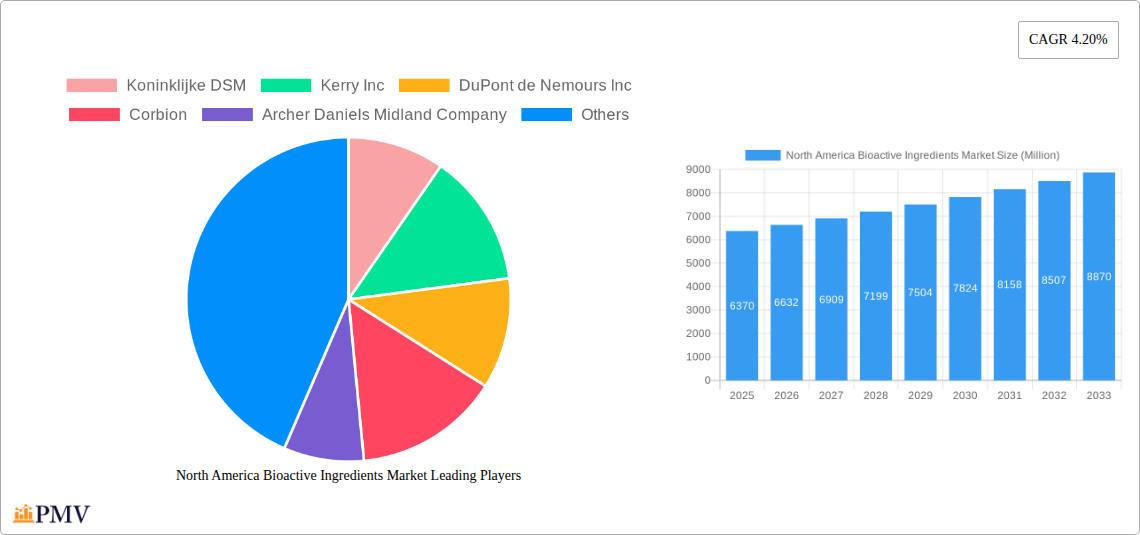
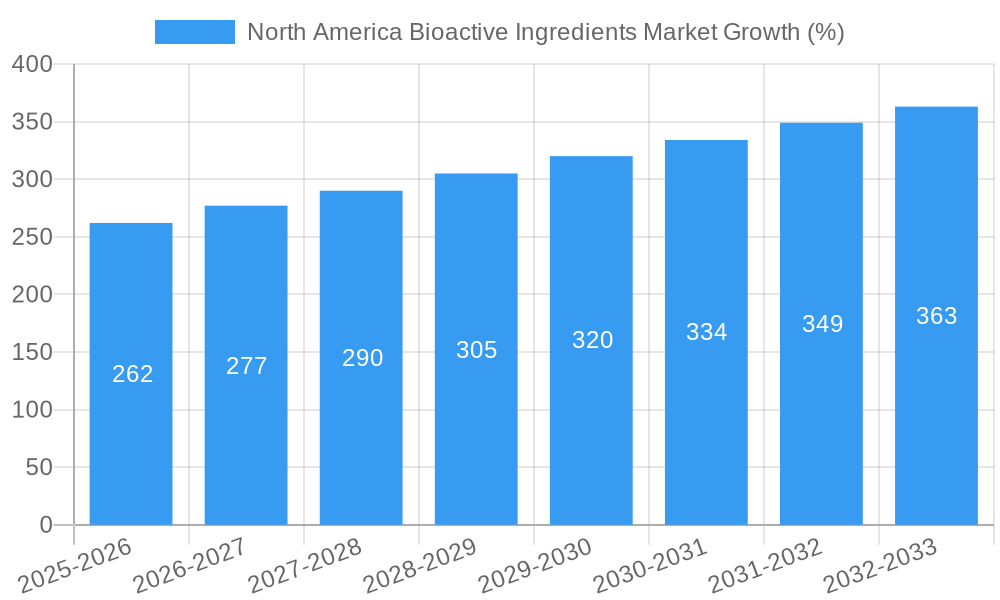
The North America bioactive ingredients market, valued at $6.37 billion in 2025, is projected to experience robust growth, driven by increasing consumer awareness of health and wellness, a rising prevalence of chronic diseases, and the growing demand for functional foods and dietary supplements. The market's compound annual growth rate (CAGR) of 4.20% from 2025 to 2033 indicates a significant expansion, with projected market value exceeding $9 billion by 2033. Key drivers include the rising popularity of probiotics and prebiotics for gut health, the incorporation of omega-3 fatty acids in various food and beverage products, and the increasing demand for vitamins and antioxidants to support immune function. The segment comprising food and beverages holds the largest market share, followed by dietary supplements. Growth within the dietary supplement segment is fueled by the convenience and targeted health benefits offered. While the animal nutrition segment showcases steady growth, personal and beauty care applications are expected to gain significant traction over the forecast period, reflecting the integration of bioactive ingredients into cosmetics and skincare products. Leading companies such as DSM, Kerry, DuPont, and Cargill are strategically investing in research and development to enhance product innovation and expand their market presence, further contributing to the market’s expansion.
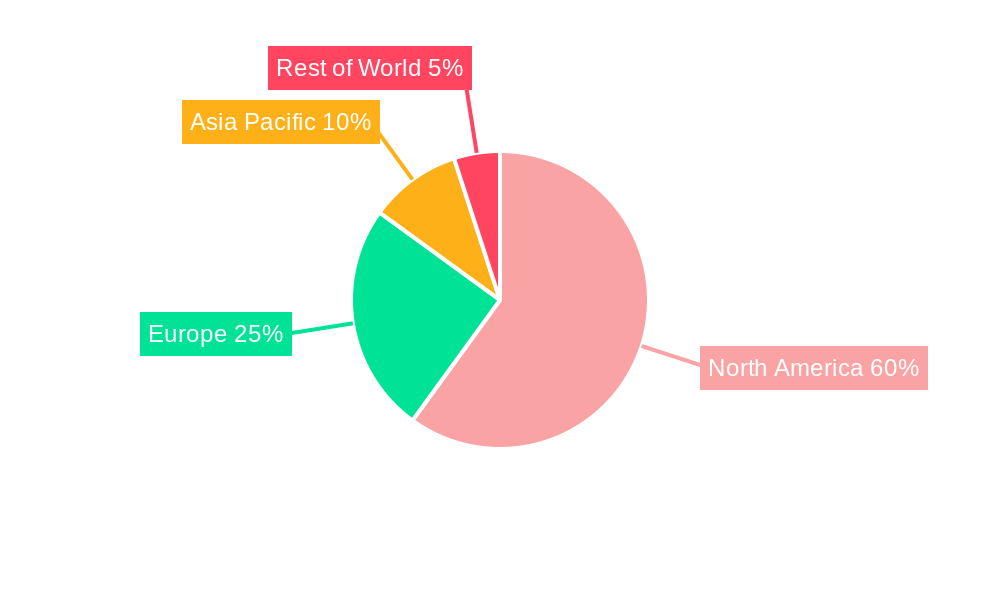
The North American region dominates the market, driven by high disposable incomes, a focus on preventive healthcare, and the readily available infrastructure for research and development. However, regulatory changes and fluctuations in raw material prices pose challenges to market growth. The increasing use of bioactive ingredients across various applications is prompting companies to diversify their product portfolios, leading to an influx of innovative and customized products. The competitive landscape is characterized by a mix of established multinational corporations and smaller specialized companies, creating a dynamic and evolving market. Future growth will be heavily influenced by consumer preferences, technological advancements in ingredient extraction and formulation, and continued governmental support for research in the health and wellness sector.
North America Bioactive Ingredients Market: A Comprehensive Market Analysis (2019-2033)
This comprehensive report provides a detailed analysis of the North America bioactive ingredients market, offering valuable insights for industry stakeholders, investors, and researchers. The study covers the period 2019-2033, with 2025 as the base year and a forecast period of 2025-2033. The report segments the market by ingredient type (Probiotics and Prebiotics, Omega-3 Fatty Acids, Vitamins, Vitamin K, Carotenoids and Antioxidants, Plant Extracts, Minerals, Amino Acids, Proteins, and Peptides) and application (Food and Beverages, Dietary Supplements, Animal Nutrition, Personal and Beauty Care, Pharmaceutical). The market is valued at xx Million in 2025 and is projected to reach xx Million by 2033, exhibiting a CAGR of xx% during the forecast period. Key players analyzed include Koninklijke DSM, Kerry Inc, DuPont de Nemours Inc, Corbion, Archer Daniels Midland Company, BASF SE, Cargill Inc, Ingredion Incorporated, DSM Nutritional Products, and Nutraceutical Corporation.
North America Bioactive Ingredients Market Structure & Competitive Dynamics
The North America bioactive ingredients market is characterized by a moderately concentrated structure, with several large multinational corporations holding significant market share. The market exhibits a dynamic competitive landscape driven by continuous innovation, strategic mergers and acquisitions (M&A), and evolving regulatory frameworks. Key players are focusing on expanding their product portfolios through R&D and strategic partnerships to cater to the growing demand for natural and functional ingredients.
- Market Concentration: The top five players account for approximately xx% of the market share in 2025.
- Innovation Ecosystems: Significant investments in R&D are fueling the development of novel bioactive ingredients with enhanced efficacy and functionality. Open innovation models and collaborations between industry players and research institutions are gaining traction.
- Regulatory Frameworks: Stringent regulations regarding food safety, labeling, and ingredient approvals influence the market dynamics. Compliance costs and complexities pose challenges, particularly for smaller players.
- Product Substitutes: The availability of synthetic alternatives and the increasing consumer preference for natural ingredients create competitive pressures within the market.
- End-User Trends: The growing consumer awareness of health and wellness benefits is driving the demand for bioactive ingredients in various applications. The increasing prevalence of chronic diseases further fuels this trend.
- M&A Activities: The market has witnessed several significant M&A deals in recent years, with deal values ranging from xx Million to xx Million, aimed at expanding market reach, enhancing product portfolios, and gaining technological advantages.
North America Bioactive Ingredients Market Industry Trends & Insights
The North America bioactive ingredients market is experiencing robust growth driven by several key factors. The rising consumer awareness regarding health and wellness, coupled with the increasing prevalence of chronic diseases, is fueling the demand for functional foods and dietary supplements. Technological advancements are enabling the development of novel bioactive ingredients with improved efficacy and bioavailability.
The market growth is further propelled by the increasing adoption of bioactive ingredients in various applications, including food and beverages, animal nutrition, personal care, and pharmaceuticals. The shift towards natural and clean-label products is also driving market growth, pushing manufacturers to adopt sustainable sourcing practices and develop innovative extraction and processing technologies. The market is also witnessing significant investments in research and development, leading to the introduction of novel products with improved functionalities and health benefits. Consumer preferences are increasingly favoring natural and organic ingredients, creating opportunities for players focused on sustainable and ethically sourced materials. The competitive landscape is dynamic, characterized by both intense rivalry among established players and the emergence of new market entrants. The overall market is expected to grow at a CAGR of xx% during the forecast period, driven by these factors and a continued consumer focus on health and wellness. Market penetration is particularly high in the dietary supplements and food and beverage sectors.
Dominant Markets & Segments in North America Bioactive Ingredients Market
The United States dominates the North America bioactive ingredients market, owing to its large population, high disposable incomes, and advanced healthcare infrastructure. The dietary supplements segment holds the largest market share across all application segments, followed by the food and beverage industry. Within ingredient types, probiotics and prebiotics, vitamins, and omega-3 fatty acids represent the largest segments, driven by their established health benefits and widespread consumer acceptance.
- Key Drivers for the US Market:
- High disposable income and health-conscious population.
- Well-developed healthcare infrastructure and robust regulatory framework.
- Strong presence of key players and significant investments in research and development.
- Key Drivers for the Dietary Supplements Segment:
- Growing consumer awareness of health and wellness benefits.
- Increasing prevalence of chronic diseases and lifestyle-related health issues.
- Convenient and accessible format for targeted health benefits.
- Key Drivers for Probiotics and Prebiotics, Vitamins, and Omega-3 Fatty Acids Segments:
- Scientifically proven health benefits and widespread consumer acceptance.
- Strong demand from food, beverage, and dietary supplement manufacturers.
- Increasing awareness of the role of gut health in overall well-being.
North America Bioactive Ingredients Market Product Innovations
Recent years have witnessed significant innovations in the bioactive ingredient space, including the development of novel delivery systems for improved bioavailability, enhanced extraction technologies for preserving the quality and efficacy of ingredients, and the emergence of personalized nutrition solutions based on individual genetic and metabolic profiles. These innovations aim to cater to evolving consumer preferences, enhance product efficacy, and improve the overall market appeal of bioactive ingredients. Emphasis is placed on sustainable sourcing practices and environmentally friendly production methods.
Report Segmentation & Scope
This report segments the North America bioactive ingredients market by both ingredient type and application. The ingredient type segment includes probiotics and prebiotics, omega-3 fatty acids, vitamins (including Vitamin K), carotenoids and antioxidants, plant extracts, minerals, amino acids, proteins, and peptides. Each segment's market size, growth projections, and competitive dynamics are analyzed in detail. The application segment includes food and beverages, dietary supplements, animal nutrition, personal and beauty care, and pharmaceuticals. Each application segment's growth drivers, challenges, and opportunities are also thoroughly evaluated. Growth projections for each segment vary depending on market dynamics and consumer demand.
Key Drivers of North America Bioactive Ingredients Market Growth
The growth of the North America bioactive ingredients market is driven by several key factors, including the growing consumer awareness of health and wellness, increasing prevalence of chronic diseases, rising demand for functional foods and dietary supplements, technological advancements leading to enhanced product efficacy, and supportive government regulations. Furthermore, the shift toward natural and clean-label products is a major driver. Specific examples include the growing popularity of probiotics for gut health and the increasing demand for plant-based protein sources.
Challenges in the North America Bioactive Ingredients Market Sector
Challenges in the North America bioactive ingredients market include stringent regulations and compliance costs, fluctuations in raw material prices and supply chain disruptions, intense competition among established players and new entrants, and consumer concerns regarding ingredient safety and authenticity. These challenges can significantly impact the profitability and sustainability of businesses within this sector. For example, supply chain disruptions due to geopolitical events can lead to significant price increases.
Leading Players in the North America Bioactive Ingredients Market Market
- Koninklijke DSM
- Kerry Inc
- DuPont de Nemours Inc
- Corbion
- Archer Daniels Midland Company
- BASF SE
- Cargill Inc
- Ingredion Incorporated
- DSM Nutritional Products
- Nutraceutical Corporation
Key Developments in North America Bioactive Ingredients Market Sector
- January 2023: Company X launches a new line of plant-based omega-3 supplements.
- March 2023: Company Y announces a strategic partnership to expand its distribution network.
- June 2024: Company Z acquires a smaller competitor, strengthening its market position. (Further specific developments and dates should be added here based on actual market data.)
Strategic North America Bioactive Ingredients Market Outlook
The future of the North America bioactive ingredients market appears promising, with continued growth driven by the increasing consumer focus on health and wellness, advancements in ingredient technology, and the expansion of applications across various industries. Strategic opportunities exist for companies focused on developing innovative, sustainable, and ethically sourced products that meet the evolving demands of consumers and address specific health needs. This presents significant potential for market expansion and industry consolidation.
North America Bioactive Ingredients Market Segmentation
-
1. Ingredinet Type
- 1.1. Probiotics and Prebiotics
- 1.2. Omega3 Fatty Acids
-
1.3. Vitamins
- 1.3.1. Vitamin A
- 1.3.2. Vitamin B
- 1.3.3. Vitamin C
- 1.3.4. Vitamin D
- 1.3.5. Vitamin E
- 1.3.6. Vitamin K
- 1.4. Carotenoids and Antioxidants
- 1.5. Plant Extracts
- 1.6. Minerals
- 1.7. Amino Acids, Proteins, and Peptides
-
2. Application
- 2.1. Food and Beverages
- 2.2. Dietary Supplements
- 2.3. Animal Nutrition
- 2.4. Personal and Beauty Care
- 2.5. Pharmaceutical
-
3. Geography
- 3.1. United States
- 3.2. Canada
- 3.3. Mexico
- 3.4. Rest of North America
North America Bioactive Ingredients Market Segmentation By Geography
- 1. United States
- 2. Canada
- 3. Mexico
- 4. Rest of North America
North America Bioactive Ingredients Market REPORT HIGHLIGHTS
| Aspects | Details |
|---|---|
| Study Period | 2019-2033 |
| Base Year | 2024 |
| Estimated Year | 2025 |
| Forecast Period | 2025-2033 |
| Historical Period | 2019-2024 |
| Growth Rate | CAGR of 4.20% from 2019-2033 |
| Segmentation |
|
Table of Contents
- 1. Introduction
- 1.1. Research Scope
- 1.2. Market Segmentation
- 1.3. Research Methodology
- 1.4. Definitions and Assumptions
- 2. Executive Summary
- 2.1. Introduction
- 3. Market Dynamics
- 3.1. Introduction
- 3.2. Market Drivers
- 3.2.1. Increasing Demand For Convenience & Processed Food
- 3.3. Market Restrains
- 3.3.1. Increased Consumer Awareness On Side-Effects Of Chemical Additives
- 3.4. Market Trends
- 3.4.1. Rising Awareness about the Role of Probiotics and Prebiotics in Gut Health
- 4. Market Factor Analysis
- 4.1. Porters Five Forces
- 4.2. Supply/Value Chain
- 4.3. PESTEL analysis
- 4.4. Market Entropy
- 4.5. Patent/Trademark Analysis
- 5. North America Bioactive Ingredients Market Analysis, Insights and Forecast, 2019-2031
- 5.1. Market Analysis, Insights and Forecast - by Ingredinet Type
- 5.1.1. Probiotics and Prebiotics
- 5.1.2. Omega3 Fatty Acids
- 5.1.3. Vitamins
- 5.1.3.1. Vitamin A
- 5.1.3.2. Vitamin B
- 5.1.3.3. Vitamin C
- 5.1.3.4. Vitamin D
- 5.1.3.5. Vitamin E
- 5.1.3.6. Vitamin K
- 5.1.4. Carotenoids and Antioxidants
- 5.1.5. Plant Extracts
- 5.1.6. Minerals
- 5.1.7. Amino Acids, Proteins, and Peptides
- 5.2. Market Analysis, Insights and Forecast - by Application
- 5.2.1. Food and Beverages
- 5.2.2. Dietary Supplements
- 5.2.3. Animal Nutrition
- 5.2.4. Personal and Beauty Care
- 5.2.5. Pharmaceutical
- 5.3. Market Analysis, Insights and Forecast - by Geography
- 5.3.1. United States
- 5.3.2. Canada
- 5.3.3. Mexico
- 5.3.4. Rest of North America
- 5.4. Market Analysis, Insights and Forecast - by Region
- 5.4.1. United States
- 5.4.2. Canada
- 5.4.3. Mexico
- 5.4.4. Rest of North America
- 5.1. Market Analysis, Insights and Forecast - by Ingredinet Type
- 6. United States North America Bioactive Ingredients Market Analysis, Insights and Forecast, 2019-2031
- 6.1. Market Analysis, Insights and Forecast - by Ingredinet Type
- 6.1.1. Probiotics and Prebiotics
- 6.1.2. Omega3 Fatty Acids
- 6.1.3. Vitamins
- 6.1.3.1. Vitamin A
- 6.1.3.2. Vitamin B
- 6.1.3.3. Vitamin C
- 6.1.3.4. Vitamin D
- 6.1.3.5. Vitamin E
- 6.1.3.6. Vitamin K
- 6.1.4. Carotenoids and Antioxidants
- 6.1.5. Plant Extracts
- 6.1.6. Minerals
- 6.1.7. Amino Acids, Proteins, and Peptides
- 6.2. Market Analysis, Insights and Forecast - by Application
- 6.2.1. Food and Beverages
- 6.2.2. Dietary Supplements
- 6.2.3. Animal Nutrition
- 6.2.4. Personal and Beauty Care
- 6.2.5. Pharmaceutical
- 6.3. Market Analysis, Insights and Forecast - by Geography
- 6.3.1. United States
- 6.3.2. Canada
- 6.3.3. Mexico
- 6.3.4. Rest of North America
- 6.1. Market Analysis, Insights and Forecast - by Ingredinet Type
- 7. Canada North America Bioactive Ingredients Market Analysis, Insights and Forecast, 2019-2031
- 7.1. Market Analysis, Insights and Forecast - by Ingredinet Type
- 7.1.1. Probiotics and Prebiotics
- 7.1.2. Omega3 Fatty Acids
- 7.1.3. Vitamins
- 7.1.3.1. Vitamin A
- 7.1.3.2. Vitamin B
- 7.1.3.3. Vitamin C
- 7.1.3.4. Vitamin D
- 7.1.3.5. Vitamin E
- 7.1.3.6. Vitamin K
- 7.1.4. Carotenoids and Antioxidants
- 7.1.5. Plant Extracts
- 7.1.6. Minerals
- 7.1.7. Amino Acids, Proteins, and Peptides
- 7.2. Market Analysis, Insights and Forecast - by Application
- 7.2.1. Food and Beverages
- 7.2.2. Dietary Supplements
- 7.2.3. Animal Nutrition
- 7.2.4. Personal and Beauty Care
- 7.2.5. Pharmaceutical
- 7.3. Market Analysis, Insights and Forecast - by Geography
- 7.3.1. United States
- 7.3.2. Canada
- 7.3.3. Mexico
- 7.3.4. Rest of North America
- 7.1. Market Analysis, Insights and Forecast - by Ingredinet Type
- 8. Mexico North America Bioactive Ingredients Market Analysis, Insights and Forecast, 2019-2031
- 8.1. Market Analysis, Insights and Forecast - by Ingredinet Type
- 8.1.1. Probiotics and Prebiotics
- 8.1.2. Omega3 Fatty Acids
- 8.1.3. Vitamins
- 8.1.3.1. Vitamin A
- 8.1.3.2. Vitamin B
- 8.1.3.3. Vitamin C
- 8.1.3.4. Vitamin D
- 8.1.3.5. Vitamin E
- 8.1.3.6. Vitamin K
- 8.1.4. Carotenoids and Antioxidants
- 8.1.5. Plant Extracts
- 8.1.6. Minerals
- 8.1.7. Amino Acids, Proteins, and Peptides
- 8.2. Market Analysis, Insights and Forecast - by Application
- 8.2.1. Food and Beverages
- 8.2.2. Dietary Supplements
- 8.2.3. Animal Nutrition
- 8.2.4. Personal and Beauty Care
- 8.2.5. Pharmaceutical
- 8.3. Market Analysis, Insights and Forecast - by Geography
- 8.3.1. United States
- 8.3.2. Canada
- 8.3.3. Mexico
- 8.3.4. Rest of North America
- 8.1. Market Analysis, Insights and Forecast - by Ingredinet Type
- 9. Rest of North America North America Bioactive Ingredients Market Analysis, Insights and Forecast, 2019-2031
- 9.1. Market Analysis, Insights and Forecast - by Ingredinet Type
- 9.1.1. Probiotics and Prebiotics
- 9.1.2. Omega3 Fatty Acids
- 9.1.3. Vitamins
- 9.1.3.1. Vitamin A
- 9.1.3.2. Vitamin B
- 9.1.3.3. Vitamin C
- 9.1.3.4. Vitamin D
- 9.1.3.5. Vitamin E
- 9.1.3.6. Vitamin K
- 9.1.4. Carotenoids and Antioxidants
- 9.1.5. Plant Extracts
- 9.1.6. Minerals
- 9.1.7. Amino Acids, Proteins, and Peptides
- 9.2. Market Analysis, Insights and Forecast - by Application
- 9.2.1. Food and Beverages
- 9.2.2. Dietary Supplements
- 9.2.3. Animal Nutrition
- 9.2.4. Personal and Beauty Care
- 9.2.5. Pharmaceutical
- 9.3. Market Analysis, Insights and Forecast - by Geography
- 9.3.1. United States
- 9.3.2. Canada
- 9.3.3. Mexico
- 9.3.4. Rest of North America
- 9.1. Market Analysis, Insights and Forecast - by Ingredinet Type
- 10. United States North America Bioactive Ingredients Market Analysis, Insights and Forecast, 2019-2031
- 11. Canada North America Bioactive Ingredients Market Analysis, Insights and Forecast, 2019-2031
- 12. Mexico North America Bioactive Ingredients Market Analysis, Insights and Forecast, 2019-2031
- 13. Rest of North America North America Bioactive Ingredients Market Analysis, Insights and Forecast, 2019-2031
- 14. Competitive Analysis
- 14.1. Market Share Analysis 2024
- 14.2. Company Profiles
- 14.2.1 Koninklijke DSM
- 14.2.1.1. Overview
- 14.2.1.2. Products
- 14.2.1.3. SWOT Analysis
- 14.2.1.4. Recent Developments
- 14.2.1.5. Financials (Based on Availability)
- 14.2.2 Kerry Inc
- 14.2.2.1. Overview
- 14.2.2.2. Products
- 14.2.2.3. SWOT Analysis
- 14.2.2.4. Recent Developments
- 14.2.2.5. Financials (Based on Availability)
- 14.2.3 DuPont de Nemours Inc
- 14.2.3.1. Overview
- 14.2.3.2. Products
- 14.2.3.3. SWOT Analysis
- 14.2.3.4. Recent Developments
- 14.2.3.5. Financials (Based on Availability)
- 14.2.4 Corbion
- 14.2.4.1. Overview
- 14.2.4.2. Products
- 14.2.4.3. SWOT Analysis
- 14.2.4.4. Recent Developments
- 14.2.4.5. Financials (Based on Availability)
- 14.2.5 Archer Daniels Midland Company
- 14.2.5.1. Overview
- 14.2.5.2. Products
- 14.2.5.3. SWOT Analysis
- 14.2.5.4. Recent Developments
- 14.2.5.5. Financials (Based on Availability)
- 14.2.6 BASF SE*List Not Exhaustive
- 14.2.6.1. Overview
- 14.2.6.2. Products
- 14.2.6.3. SWOT Analysis
- 14.2.6.4. Recent Developments
- 14.2.6.5. Financials (Based on Availability)
- 14.2.7 Cargill Inc
- 14.2.7.1. Overview
- 14.2.7.2. Products
- 14.2.7.3. SWOT Analysis
- 14.2.7.4. Recent Developments
- 14.2.7.5. Financials (Based on Availability)
- 14.2.8 Ingredion Incorporated
- 14.2.8.1. Overview
- 14.2.8.2. Products
- 14.2.8.3. SWOT Analysis
- 14.2.8.4. Recent Developments
- 14.2.8.5. Financials (Based on Availability)
- 14.2.9 DSM Nutritional Products
- 14.2.9.1. Overview
- 14.2.9.2. Products
- 14.2.9.3. SWOT Analysis
- 14.2.9.4. Recent Developments
- 14.2.9.5. Financials (Based on Availability)
- 14.2.10 Nutraceutical Corporation
- 14.2.10.1. Overview
- 14.2.10.2. Products
- 14.2.10.3. SWOT Analysis
- 14.2.10.4. Recent Developments
- 14.2.10.5. Financials (Based on Availability)
- 14.2.1 Koninklijke DSM
List of Figures
- Figure 1: North America Bioactive Ingredients Market Revenue Breakdown (Million, %) by Product 2024 & 2032
- Figure 2: North America Bioactive Ingredients Market Share (%) by Company 2024
List of Tables
- Table 1: North America Bioactive Ingredients Market Revenue Million Forecast, by Region 2019 & 2032
- Table 2: North America Bioactive Ingredients Market Volume K Tons Forecast, by Region 2019 & 2032
- Table 3: North America Bioactive Ingredients Market Revenue Million Forecast, by Ingredinet Type 2019 & 2032
- Table 4: North America Bioactive Ingredients Market Volume K Tons Forecast, by Ingredinet Type 2019 & 2032
- Table 5: North America Bioactive Ingredients Market Revenue Million Forecast, by Application 2019 & 2032
- Table 6: North America Bioactive Ingredients Market Volume K Tons Forecast, by Application 2019 & 2032
- Table 7: North America Bioactive Ingredients Market Revenue Million Forecast, by Geography 2019 & 2032
- Table 8: North America Bioactive Ingredients Market Volume K Tons Forecast, by Geography 2019 & 2032
- Table 9: North America Bioactive Ingredients Market Revenue Million Forecast, by Region 2019 & 2032
- Table 10: North America Bioactive Ingredients Market Volume K Tons Forecast, by Region 2019 & 2032
- Table 11: North America Bioactive Ingredients Market Revenue Million Forecast, by Country 2019 & 2032
- Table 12: North America Bioactive Ingredients Market Volume K Tons Forecast, by Country 2019 & 2032
- Table 13: United States North America Bioactive Ingredients Market Revenue (Million) Forecast, by Application 2019 & 2032
- Table 14: United States North America Bioactive Ingredients Market Volume (K Tons) Forecast, by Application 2019 & 2032
- Table 15: Canada North America Bioactive Ingredients Market Revenue (Million) Forecast, by Application 2019 & 2032
- Table 16: Canada North America Bioactive Ingredients Market Volume (K Tons) Forecast, by Application 2019 & 2032
- Table 17: Mexico North America Bioactive Ingredients Market Revenue (Million) Forecast, by Application 2019 & 2032
- Table 18: Mexico North America Bioactive Ingredients Market Volume (K Tons) Forecast, by Application 2019 & 2032
- Table 19: Rest of North America North America Bioactive Ingredients Market Revenue (Million) Forecast, by Application 2019 & 2032
- Table 20: Rest of North America North America Bioactive Ingredients Market Volume (K Tons) Forecast, by Application 2019 & 2032
- Table 21: North America Bioactive Ingredients Market Revenue Million Forecast, by Ingredinet Type 2019 & 2032
- Table 22: North America Bioactive Ingredients Market Volume K Tons Forecast, by Ingredinet Type 2019 & 2032
- Table 23: North America Bioactive Ingredients Market Revenue Million Forecast, by Application 2019 & 2032
- Table 24: North America Bioactive Ingredients Market Volume K Tons Forecast, by Application 2019 & 2032
- Table 25: North America Bioactive Ingredients Market Revenue Million Forecast, by Geography 2019 & 2032
- Table 26: North America Bioactive Ingredients Market Volume K Tons Forecast, by Geography 2019 & 2032
- Table 27: North America Bioactive Ingredients Market Revenue Million Forecast, by Country 2019 & 2032
- Table 28: North America Bioactive Ingredients Market Volume K Tons Forecast, by Country 2019 & 2032
- Table 29: North America Bioactive Ingredients Market Revenue Million Forecast, by Ingredinet Type 2019 & 2032
- Table 30: North America Bioactive Ingredients Market Volume K Tons Forecast, by Ingredinet Type 2019 & 2032
- Table 31: North America Bioactive Ingredients Market Revenue Million Forecast, by Application 2019 & 2032
- Table 32: North America Bioactive Ingredients Market Volume K Tons Forecast, by Application 2019 & 2032
- Table 33: North America Bioactive Ingredients Market Revenue Million Forecast, by Geography 2019 & 2032
- Table 34: North America Bioactive Ingredients Market Volume K Tons Forecast, by Geography 2019 & 2032
- Table 35: North America Bioactive Ingredients Market Revenue Million Forecast, by Country 2019 & 2032
- Table 36: North America Bioactive Ingredients Market Volume K Tons Forecast, by Country 2019 & 2032
- Table 37: North America Bioactive Ingredients Market Revenue Million Forecast, by Ingredinet Type 2019 & 2032
- Table 38: North America Bioactive Ingredients Market Volume K Tons Forecast, by Ingredinet Type 2019 & 2032
- Table 39: North America Bioactive Ingredients Market Revenue Million Forecast, by Application 2019 & 2032
- Table 40: North America Bioactive Ingredients Market Volume K Tons Forecast, by Application 2019 & 2032
- Table 41: North America Bioactive Ingredients Market Revenue Million Forecast, by Geography 2019 & 2032
- Table 42: North America Bioactive Ingredients Market Volume K Tons Forecast, by Geography 2019 & 2032
- Table 43: North America Bioactive Ingredients Market Revenue Million Forecast, by Country 2019 & 2032
- Table 44: North America Bioactive Ingredients Market Volume K Tons Forecast, by Country 2019 & 2032
- Table 45: North America Bioactive Ingredients Market Revenue Million Forecast, by Ingredinet Type 2019 & 2032
- Table 46: North America Bioactive Ingredients Market Volume K Tons Forecast, by Ingredinet Type 2019 & 2032
- Table 47: North America Bioactive Ingredients Market Revenue Million Forecast, by Application 2019 & 2032
- Table 48: North America Bioactive Ingredients Market Volume K Tons Forecast, by Application 2019 & 2032
- Table 49: North America Bioactive Ingredients Market Revenue Million Forecast, by Geography 2019 & 2032
- Table 50: North America Bioactive Ingredients Market Volume K Tons Forecast, by Geography 2019 & 2032
- Table 51: North America Bioactive Ingredients Market Revenue Million Forecast, by Country 2019 & 2032
- Table 52: North America Bioactive Ingredients Market Volume K Tons Forecast, by Country 2019 & 2032
Frequently Asked Questions
1. What is the projected Compound Annual Growth Rate (CAGR) of the North America Bioactive Ingredients Market?
The projected CAGR is approximately 4.20%.
2. Which companies are prominent players in the North America Bioactive Ingredients Market?
Key companies in the market include Koninklijke DSM, Kerry Inc, DuPont de Nemours Inc, Corbion, Archer Daniels Midland Company, BASF SE*List Not Exhaustive, Cargill Inc, Ingredion Incorporated, DSM Nutritional Products , Nutraceutical Corporation.
3. What are the main segments of the North America Bioactive Ingredients Market?
The market segments include Ingredinet Type, Application, Geography .
4. Can you provide details about the market size?
The market size is estimated to be USD 6370 Million as of 2022.
5. What are some drivers contributing to market growth?
Increasing Demand For Convenience & Processed Food.
6. What are the notable trends driving market growth?
Rising Awareness about the Role of Probiotics and Prebiotics in Gut Health.
7. Are there any restraints impacting market growth?
Increased Consumer Awareness On Side-Effects Of Chemical Additives.
8. Can you provide examples of recent developments in the market?
N/A
9. What pricing options are available for accessing the report?
Pricing options include single-user, multi-user, and enterprise licenses priced at USD 4750, USD 4950, and USD 6800 respectively.
10. Is the market size provided in terms of value or volume?
The market size is provided in terms of value, measured in Million and volume, measured in K Tons.
11. Are there any specific market keywords associated with the report?
Yes, the market keyword associated with the report is "North America Bioactive Ingredients Market," which aids in identifying and referencing the specific market segment covered.
12. How do I determine which pricing option suits my needs best?
The pricing options vary based on user requirements and access needs. Individual users may opt for single-user licenses, while businesses requiring broader access may choose multi-user or enterprise licenses for cost-effective access to the report.
13. Are there any additional resources or data provided in the North America Bioactive Ingredients Market report?
While the report offers comprehensive insights, it's advisable to review the specific contents or supplementary materials provided to ascertain if additional resources or data are available.
14. How can I stay updated on further developments or reports in the North America Bioactive Ingredients Market?
To stay informed about further developments, trends, and reports in the North America Bioactive Ingredients Market, consider subscribing to industry newsletters, following relevant companies and organizations, or regularly checking reputable industry news sources and publications.
Methodology
Step 1 - Identification of Relevant Samples Size from Population Database


Step 2 - Approaches for Defining Global Market Size (Value, Volume* & Price*)

Note*: In applicable scenarios
Step 3 - Data Sources
Primary Research
- Web Analytics
- Survey Reports
- Research Institute
- Latest Research Reports
- Opinion Leaders
Secondary Research
- Annual Reports
- White Paper
- Latest Press Release
- Industry Association
- Paid Database
- Investor Presentations

Step 4 - Data Triangulation
Involves using different sources of information in order to increase the validity of a study
These sources are likely to be stakeholders in a program - participants, other researchers, program staff, other community members, and so on.
Then we put all data in single framework & apply various statistical tools to find out the dynamic on the market.
During the analysis stage, feedback from the stakeholder groups would be compared to determine areas of agreement as well as areas of divergence


