
Key Insights
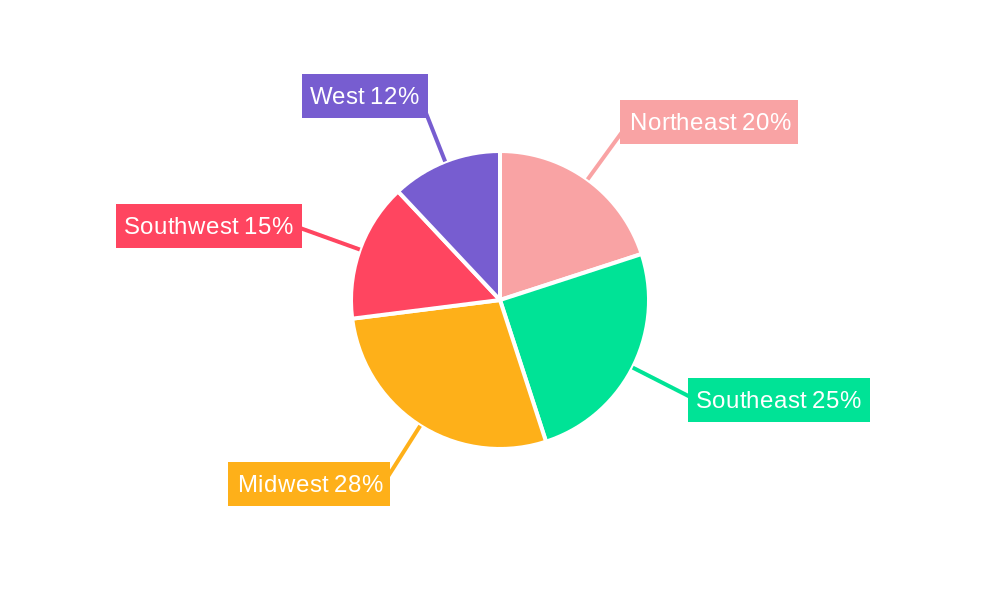
The US meat market, a substantial sector within the broader food industry, is projected to experience steady growth over the forecast period (2025-2033). While precise market size figures for 2025 are unavailable, based on a CAGR of 6.42% and considering historical data, we can estimate a 2025 market value in the range of $100-150 billion (USD). This growth is driven by several key factors. Increasing consumer demand for protein-rich diets, particularly in the expanding middle class, fuels market expansion. Further, the rise in convenience food consumption, coupled with the increasing popularity of processed meat products, such as sausages, deli meats, and ready-to-eat options, significantly contributes to market volume. Innovation in meat processing technologies, enhancing efficiency and product quality, also plays a vital role. However, the market faces challenges including fluctuating livestock prices, concerns over animal welfare and environmental sustainability in meat production, and the growing popularity of plant-based meat alternatives. The market segmentation reveals a diverse landscape with significant proportions in beef, pork, and poultry. The fresh/chilled segment maintains dominance, but frozen and processed meat categories are exhibiting notable growth driven by long shelf life and convenient preparation. The off-trade channel (grocery stores, supermarkets) holds the largest market share, but the on-trade sector (restaurants, food service) remains a considerable segment with opportunities for expansion. Regional variations exist, with the Midwest, Southeast, and West likely representing the largest consumption areas.
The competitive landscape is characterized by a mix of large multinational corporations and regional players. Major players like Tyson Foods, JBS SA, and Cargill Inc. leverage their extensive distribution networks and branding power to capture significant market share. However, smaller, niche players, potentially focusing on organic or specialty meats, are also capitalizing on growing consumer preferences for high-quality, ethically sourced products. Strategies aimed at improving supply chain efficiency, exploring innovative packaging solutions, and enhancing product diversity (e.g., value-added products, organic options) are crucial for market success. Furthermore, proactive responses to consumer concerns regarding sustainability, traceability, and animal welfare will be increasingly critical for building brand reputation and securing future market share. The long-term outlook remains positive, contingent on sustained consumer demand and efficient navigation of the identified market challenges.
US Meat Market: A Comprehensive Market Report (2019-2033)
This in-depth report provides a comprehensive analysis of the US meat market, offering invaluable insights for industry stakeholders. With a study period spanning 2019-2033, a base year of 2025, and a forecast period of 2025-2033, this report delivers critical data and actionable intelligence to navigate the dynamic landscape of the US meat industry. The report covers a market valued at $XX Million in 2024, projected to reach $XX Million by 2033, exhibiting a robust CAGR of XX%.
US Meat Market Market Structure & Competitive Dynamics
This section dissects the competitive landscape of the US meat market, analyzing market concentration, innovation, regulatory frameworks, product substitutes, end-user trends, and M&A activities. The market is characterized by a mix of large multinational corporations and smaller regional players. Market share is concentrated among the top players, with companies like Tyson Foods, JBS SA, and Cargill holding significant portions. However, smaller niche players also thrive by focusing on specialized products or regional markets.
The regulatory landscape plays a crucial role, impacting food safety standards, labeling regulations, and environmental concerns. Innovation within the sector focuses on improving production efficiency, enhancing product quality, and extending shelf life. Increased consumer demand for sustainably produced meat is driving innovation in areas such as alternative protein sources and reduced environmental impact farming practices.
M&A activity has been significant, with several large acquisitions reshaping the market structure in recent years. Deal values have fluctuated but generally remain substantial, reflecting the high stakes of competition in the US meat sector. Examples include JBS's acquisition of certain assets from TriOak Foods (December 2022), significantly strengthening their supply chain.
- Market Concentration: High, with top players controlling a significant market share.
- Innovation Ecosystem: Focus on efficiency, quality, sustainability, and alternative protein sources.
- Regulatory Framework: Stringent food safety and labeling regulations.
- M&A Activity: Significant activity reshaping the market landscape with deal values in the hundreds of Millions.
US Meat Market Industry Trends & Insights
The US meat market is experiencing a period of significant transformation. Key growth drivers include increasing consumer demand, particularly for convenient and value-added meat products. Technological advancements are enhancing production efficiency, improving food safety, and creating new product opportunities. Changing consumer preferences towards healthier options, such as leaner cuts and organic meats, are also influencing market trends. The competitive landscape remains intensely competitive, with established players and new entrants vying for market share.
The market's growth is also affected by macroeconomic factors such as disposable income, consumer confidence, and economic fluctuations. The sector faces challenges including rising production costs, labor shortages, and increasing concerns about animal welfare and environmental sustainability. These trends are reflected in the market's CAGR and market penetration rates for various meat types and forms.
Dominant Markets & Segments in US Meat Market
The US beef market dominates in terms of volume and value, driven by strong consumer preference and the versatility of beef in various cuisines. Within the beef segment, fresh/chilled beef enjoys the largest market share due to its perceived freshness and higher quality. The off-trade distribution channel (supermarkets, grocery stores) remains the most dominant, although the on-trade (restaurants, food service) sector contributes significantly. Geographical dominance is spread across the country, with higher consumption in regions with strong agricultural and livestock industries.
- Key Drivers for Beef Dominance: Strong consumer preference, versatility, readily available supply.
- Key Drivers for Fresh/Chilled Segment: Perceived freshness and superior quality.
- Key Drivers for Off-Trade Channel: Convenience, wide accessibility, established infrastructure.
Other meat segments like pork and poultry also hold substantial market share, driven by their affordability and diverse applications. The frozen segment exhibits high growth driven by its extended shelf life and convenience.
US Meat Market Product Innovations
Recent innovations focus on value-added products, such as ready-to-eat meals and marinated meats, catering to the growing demand for convenience. Technological advancements in processing and packaging enhance product quality, extend shelf life, and improve food safety. The increasing popularity of organic and sustainably raised meats is driving the development of new product lines that appeal to health-conscious consumers. These innovations, coupled with strategic partnerships and acquisitions, are shaping the competitive landscape and driving market growth.
Report Segmentation & Scope
This report segments the US meat market by type (Beef, Mutton, Pork, Other Meat), form (Canned, Fresh/Chilled, Frozen, Processed), and distribution channel (Off-Trade, On-Trade). Each segment’s growth trajectory, market size, and competitive dynamics are analyzed in detail. For example, the fresh/chilled segment is anticipated to witness substantial growth, driven by increasing health consciousness among consumers. Similarly, the processed meat segment is expected to exhibit high growth due to the rising demand for convenient and ready-to-eat products. The off-trade channel continues to be the dominant distribution channel, while the on-trade segment shows steady growth driven by the expansion of the food service sector.
Key Drivers of US Meat Market Growth
Several key factors propel the growth of the US meat market. These include increasing consumer demand, particularly for convenient and ready-to-eat options. Technological advancements in processing and packaging contribute to higher efficiency and improved product quality. Government policies supporting the agricultural sector and favorable economic conditions further contribute to market expansion. The rise of health-conscious consumers is also driving demand for healthier meat options.
Challenges in the US Meat Market Sector
The US meat market faces challenges including fluctuating raw material prices, increased labor costs, and stringent regulations related to food safety and environmental sustainability. Supply chain disruptions caused by factors such as climate change and geopolitical instability impact market stability. Intense competition among established and emerging players creates pressure on profit margins.
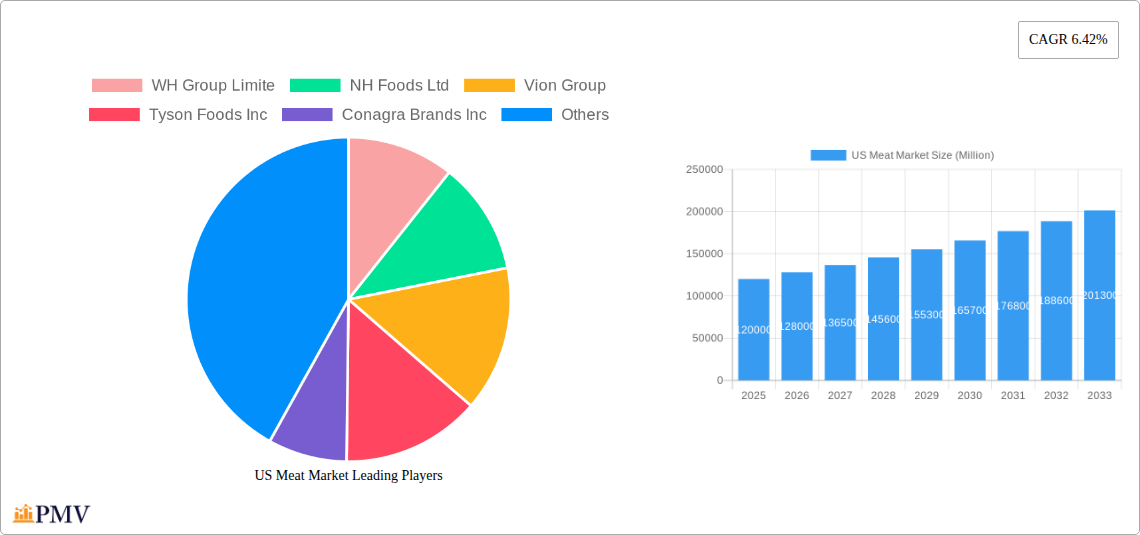
Leading Players in the US Meat Market Market
- WH Group Limited
- NH Foods Ltd
- Vion Group
- Tyson Foods Inc
- Conagra Brands Inc
- Sysco Corporation
- The Kraft Heinz Company
- Hormel Foods Corporation
- Cargill Inc
- Marfrig Global Foods S.A.
- The Clemens Family Corporation
- JBS S.A.
- OSI Group
Key Developments in US Meat Market Sector
- November 2022: Conagra Brands, Inc. announced a USD 60 Million investment to expand its Troy, Ohio facility, increasing production capacity for Slim Jim products.
- December 2022: JBS acquired certain assets from TriOak Foods, strengthening its pork supply chain control.
- April 2023: JBS USA's Swift Prepared Food launched Principe Foods, a producer of high-quality Italian meats and charcuterie.
Strategic US Meat Market Market Outlook
The US meat market is poised for continued growth, driven by evolving consumer preferences and technological innovations. Opportunities exist in developing value-added products, expanding into new distribution channels, and leveraging sustainable and ethical sourcing practices. Strategic partnerships and investments in research and development will be crucial for companies to maintain a competitive edge in this dynamic market. Focus on sustainability and health-conscious options presents a significant area of growth and differentiation for meat producers.
US Meat Market Segmentation
-
1. Type
- 1.1. Beef
- 1.2. Mutton
- 1.3. Pork
- 1.4. Other Meat
-
2. Form
- 2.1. Canned
- 2.2. Fresh / Chilled
- 2.3. Frozen
- 2.4. Processed
-
3. Distribution Channel
-
3.1. Off-Trade
- 3.1.1. Convenience Stores
- 3.1.2. Online Channel
- 3.1.3. Supermarkets and Hypermarkets
- 3.1.4. Others
- 3.2. On-Trade
-
3.1. Off-Trade
US Meat Market Segmentation By Geography
-
1. North America
- 1.1. United States
- 1.2. Canada
- 1.3. Mexico
-
2. South America
- 2.1. Brazil
- 2.2. Argentina
- 2.3. Rest of South America
-
3. Europe
- 3.1. United Kingdom
- 3.2. Germany
- 3.3. France
- 3.4. Italy
- 3.5. Spain
- 3.6. Russia
- 3.7. Benelux
- 3.8. Nordics
- 3.9. Rest of Europe
-
4. Middle East & Africa
- 4.1. Turkey
- 4.2. Israel
- 4.3. GCC
- 4.4. North Africa
- 4.5. South Africa
- 4.6. Rest of Middle East & Africa
-
5. Asia Pacific
- 5.1. China
- 5.2. India
- 5.3. Japan
- 5.4. South Korea
- 5.5. ASEAN
- 5.6. Oceania
- 5.7. Rest of Asia Pacific
US Meat Market REPORT HIGHLIGHTS
| Aspects | Details |
|---|---|
| Study Period | 2019-2033 |
| Base Year | 2024 |
| Estimated Year | 2025 |
| Forecast Period | 2025-2033 |
| Historical Period | 2019-2024 |
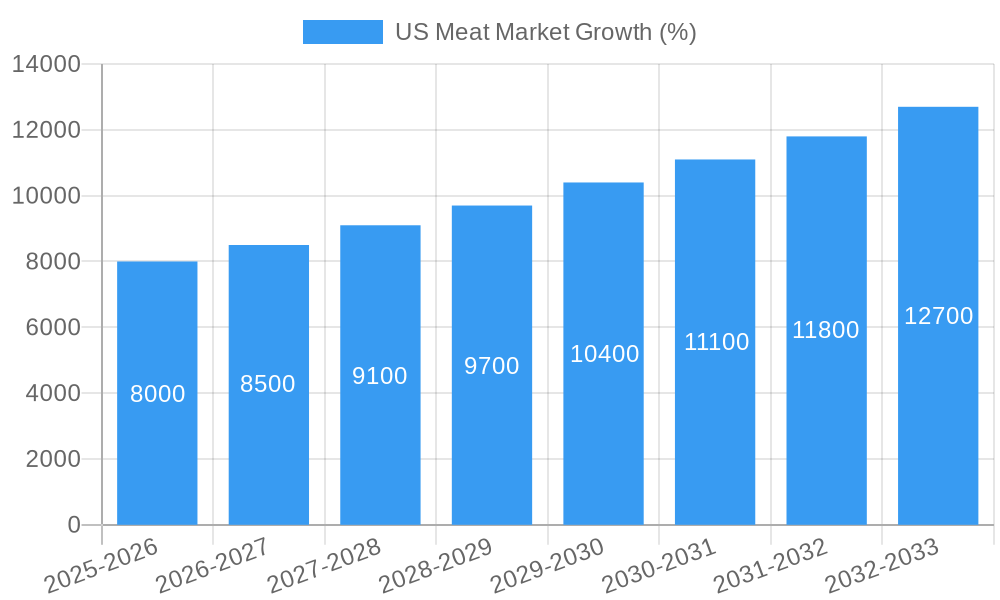
| Growth Rate | CAGR of 6.42% from 2019-2033 |
| Segmentation |
|
Table of Contents
- 1. Introduction
- 1.1. Research Scope
- 1.2. Market Segmentation
- 1.3. Research Methodology
- 1.4. Definitions and Assumptions
- 2. Executive Summary
- 2.1. Introduction
- 3. Market Dynamics
- 3.1. Introduction
- 3.2. Market Drivers
- 3.2.1. Increasing Demand for Low-Fat and Low-Calorie Food; Increasing Product Innovation
- 3.3. Market Restrains
- 3.3.1. ; Threat of New Entrants; Bargaining Power of Buyers/Consumers; Bargaining Power of Suppliers; Threat of Substitute Products; Degree Of Competition
- 3.4. Market Trends
- 3.4.1. OTHER KEY INDUSTRY TRENDS COVERED IN THE REPORT
- 4. Market Factor Analysis
- 4.1. Porters Five Forces
- 4.2. Supply/Value Chain
- 4.3. PESTEL analysis
- 4.4. Market Entropy
- 4.5. Patent/Trademark Analysis
- 5. Global US Meat Market Analysis, Insights and Forecast, 2019-2031
- 5.1. Market Analysis, Insights and Forecast - by Type
- 5.1.1. Beef
- 5.1.2. Mutton
- 5.1.3. Pork
- 5.1.4. Other Meat
- 5.2. Market Analysis, Insights and Forecast - by Form
- 5.2.1. Canned
- 5.2.2. Fresh / Chilled
- 5.2.3. Frozen
- 5.2.4. Processed
- 5.3. Market Analysis, Insights and Forecast - by Distribution Channel
- 5.3.1. Off-Trade
- 5.3.1.1. Convenience Stores
- 5.3.1.2. Online Channel
- 5.3.1.3. Supermarkets and Hypermarkets
- 5.3.1.4. Others
- 5.3.2. On-Trade
- 5.3.1. Off-Trade
- 5.4. Market Analysis, Insights and Forecast - by Region
- 5.4.1. North America
- 5.4.2. South America
- 5.4.3. Europe
- 5.4.4. Middle East & Africa
- 5.4.5. Asia Pacific
- 5.1. Market Analysis, Insights and Forecast - by Type
- 6. North America US Meat Market Analysis, Insights and Forecast, 2019-2031
- 6.1. Market Analysis, Insights and Forecast - by Type
- 6.1.1. Beef
- 6.1.2. Mutton
- 6.1.3. Pork
- 6.1.4. Other Meat
- 6.2. Market Analysis, Insights and Forecast - by Form
- 6.2.1. Canned
- 6.2.2. Fresh / Chilled
- 6.2.3. Frozen
- 6.2.4. Processed
- 6.3. Market Analysis, Insights and Forecast - by Distribution Channel
- 6.3.1. Off-Trade
- 6.3.1.1. Convenience Stores
- 6.3.1.2. Online Channel
- 6.3.1.3. Supermarkets and Hypermarkets
- 6.3.1.4. Others
- 6.3.2. On-Trade
- 6.3.1. Off-Trade
- 6.1. Market Analysis, Insights and Forecast - by Type
- 7. South America US Meat Market Analysis, Insights and Forecast, 2019-2031
- 7.1. Market Analysis, Insights and Forecast - by Type
- 7.1.1. Beef
- 7.1.2. Mutton
- 7.1.3. Pork
- 7.1.4. Other Meat
- 7.2. Market Analysis, Insights and Forecast - by Form
- 7.2.1. Canned
- 7.2.2. Fresh / Chilled
- 7.2.3. Frozen
- 7.2.4. Processed
- 7.3. Market Analysis, Insights and Forecast - by Distribution Channel
- 7.3.1. Off-Trade
- 7.3.1.1. Convenience Stores
- 7.3.1.2. Online Channel
- 7.3.1.3. Supermarkets and Hypermarkets
- 7.3.1.4. Others
- 7.3.2. On-Trade
- 7.3.1. Off-Trade
- 7.1. Market Analysis, Insights and Forecast - by Type
- 8. Europe US Meat Market Analysis, Insights and Forecast, 2019-2031
- 8.1. Market Analysis, Insights and Forecast - by Type
- 8.1.1. Beef
- 8.1.2. Mutton
- 8.1.3. Pork
- 8.1.4. Other Meat
- 8.2. Market Analysis, Insights and Forecast - by Form
- 8.2.1. Canned
- 8.2.2. Fresh / Chilled
- 8.2.3. Frozen
- 8.2.4. Processed
- 8.3. Market Analysis, Insights and Forecast - by Distribution Channel
- 8.3.1. Off-Trade
- 8.3.1.1. Convenience Stores
- 8.3.1.2. Online Channel
- 8.3.1.3. Supermarkets and Hypermarkets
- 8.3.1.4. Others
- 8.3.2. On-Trade
- 8.3.1. Off-Trade
- 8.1. Market Analysis, Insights and Forecast - by Type
- 9. Middle East & Africa US Meat Market Analysis, Insights and Forecast, 2019-2031
- 9.1. Market Analysis, Insights and Forecast - by Type
- 9.1.1. Beef
- 9.1.2. Mutton
- 9.1.3. Pork
- 9.1.4. Other Meat
- 9.2. Market Analysis, Insights and Forecast - by Form
- 9.2.1. Canned
- 9.2.2. Fresh / Chilled
- 9.2.3. Frozen
- 9.2.4. Processed
- 9.3. Market Analysis, Insights and Forecast - by Distribution Channel
- 9.3.1. Off-Trade
- 9.3.1.1. Convenience Stores
- 9.3.1.2. Online Channel
- 9.3.1.3. Supermarkets and Hypermarkets
- 9.3.1.4. Others
- 9.3.2. On-Trade
- 9.3.1. Off-Trade
- 9.1. Market Analysis, Insights and Forecast - by Type
- 10. Asia Pacific US Meat Market Analysis, Insights and Forecast, 2019-2031
- 10.1. Market Analysis, Insights and Forecast - by Type
- 10.1.1. Beef
- 10.1.2. Mutton
- 10.1.3. Pork
- 10.1.4. Other Meat
- 10.2. Market Analysis, Insights and Forecast - by Form
- 10.2.1. Canned
- 10.2.2. Fresh / Chilled
- 10.2.3. Frozen
- 10.2.4. Processed
- 10.3. Market Analysis, Insights and Forecast - by Distribution Channel
- 10.3.1. Off-Trade
- 10.3.1.1. Convenience Stores
- 10.3.1.2. Online Channel
- 10.3.1.3. Supermarkets and Hypermarkets
- 10.3.1.4. Others
- 10.3.2. On-Trade
- 10.3.1. Off-Trade
- 10.1. Market Analysis, Insights and Forecast - by Type
- 11. Northeast US Meat Market Analysis, Insights and Forecast, 2019-2031
- 12. Southeast US Meat Market Analysis, Insights and Forecast, 2019-2031
- 13. Midwest US Meat Market Analysis, Insights and Forecast, 2019-2031
- 14. Southwest US Meat Market Analysis, Insights and Forecast, 2019-2031
- 15. West US Meat Market Analysis, Insights and Forecast, 2019-2031
- 16. Competitive Analysis
- 16.1. Global Market Share Analysis 2024
- 16.2. Company Profiles
- 16.2.1 WH Group Limite
- 16.2.1.1. Overview
- 16.2.1.2. Products
- 16.2.1.3. SWOT Analysis
- 16.2.1.4. Recent Developments
- 16.2.1.5. Financials (Based on Availability)
- 16.2.2 NH Foods Ltd
- 16.2.2.1. Overview
- 16.2.2.2. Products
- 16.2.2.3. SWOT Analysis
- 16.2.2.4. Recent Developments
- 16.2.2.5. Financials (Based on Availability)
- 16.2.3 Vion Group
- 16.2.3.1. Overview
- 16.2.3.2. Products
- 16.2.3.3. SWOT Analysis
- 16.2.3.4. Recent Developments
- 16.2.3.5. Financials (Based on Availability)
- 16.2.4 Tyson Foods Inc
- 16.2.4.1. Overview
- 16.2.4.2. Products
- 16.2.4.3. SWOT Analysis
- 16.2.4.4. Recent Developments
- 16.2.4.5. Financials (Based on Availability)
- 16.2.5 Conagra Brands Inc
- 16.2.5.1. Overview
- 16.2.5.2. Products
- 16.2.5.3. SWOT Analysis
- 16.2.5.4. Recent Developments
- 16.2.5.5. Financials (Based on Availability)
- 16.2.6 Sysco Corporation
- 16.2.6.1. Overview
- 16.2.6.2. Products
- 16.2.6.3. SWOT Analysis
- 16.2.6.4. Recent Developments
- 16.2.6.5. Financials (Based on Availability)
- 16.2.7 The Kraft Heinz Company
- 16.2.7.1. Overview
- 16.2.7.2. Products
- 16.2.7.3. SWOT Analysis
- 16.2.7.4. Recent Developments
- 16.2.7.5. Financials (Based on Availability)
- 16.2.8 Hormel Foods Corporation
- 16.2.8.1. Overview
- 16.2.8.2. Products
- 16.2.8.3. SWOT Analysis
- 16.2.8.4. Recent Developments
- 16.2.8.5. Financials (Based on Availability)
- 16.2.9 Cargill Inc
- 16.2.9.1. Overview
- 16.2.9.2. Products
- 16.2.9.3. SWOT Analysis
- 16.2.9.4. Recent Developments
- 16.2.9.5. Financials (Based on Availability)
- 16.2.10 Marfrig Global Foods S A
- 16.2.10.1. Overview
- 16.2.10.2. Products
- 16.2.10.3. SWOT Analysis
- 16.2.10.4. Recent Developments
- 16.2.10.5. Financials (Based on Availability)
- 16.2.11 The Clemens Family Corporation
- 16.2.11.1. Overview
- 16.2.11.2. Products
- 16.2.11.3. SWOT Analysis
- 16.2.11.4. Recent Developments
- 16.2.11.5. Financials (Based on Availability)
- 16.2.12 JBS SA
- 16.2.12.1. Overview
- 16.2.12.2. Products
- 16.2.12.3. SWOT Analysis
- 16.2.12.4. Recent Developments
- 16.2.12.5. Financials (Based on Availability)
- 16.2.13 OSI Group
- 16.2.13.1. Overview
- 16.2.13.2. Products
- 16.2.13.3. SWOT Analysis
- 16.2.13.4. Recent Developments
- 16.2.13.5. Financials (Based on Availability)
- 16.2.1 WH Group Limite
List of Figures
- Figure 1: Global US Meat Market Revenue Breakdown (Million, %) by Region 2024 & 2032
- Figure 2: United states US Meat Market Revenue (Million), by Country 2024 & 2032
- Figure 3: United states US Meat Market Revenue Share (%), by Country 2024 & 2032
- Figure 4: North America US Meat Market Revenue (Million), by Type 2024 & 2032
- Figure 5: North America US Meat Market Revenue Share (%), by Type 2024 & 2032
- Figure 6: North America US Meat Market Revenue (Million), by Form 2024 & 2032
- Figure 7: North America US Meat Market Revenue Share (%), by Form 2024 & 2032
- Figure 8: North America US Meat Market Revenue (Million), by Distribution Channel 2024 & 2032
- Figure 9: North America US Meat Market Revenue Share (%), by Distribution Channel 2024 & 2032
- Figure 10: North America US Meat Market Revenue (Million), by Country 2024 & 2032
- Figure 11: North America US Meat Market Revenue Share (%), by Country 2024 & 2032
- Figure 12: South America US Meat Market Revenue (Million), by Type 2024 & 2032
- Figure 13: South America US Meat Market Revenue Share (%), by Type 2024 & 2032
- Figure 14: South America US Meat Market Revenue (Million), by Form 2024 & 2032
- Figure 15: South America US Meat Market Revenue Share (%), by Form 2024 & 2032
- Figure 16: South America US Meat Market Revenue (Million), by Distribution Channel 2024 & 2032
- Figure 17: South America US Meat Market Revenue Share (%), by Distribution Channel 2024 & 2032
- Figure 18: South America US Meat Market Revenue (Million), by Country 2024 & 2032
- Figure 19: South America US Meat Market Revenue Share (%), by Country 2024 & 2032
- Figure 20: Europe US Meat Market Revenue (Million), by Type 2024 & 2032
- Figure 21: Europe US Meat Market Revenue Share (%), by Type 2024 & 2032
- Figure 22: Europe US Meat Market Revenue (Million), by Form 2024 & 2032
- Figure 23: Europe US Meat Market Revenue Share (%), by Form 2024 & 2032
- Figure 24: Europe US Meat Market Revenue (Million), by Distribution Channel 2024 & 2032
- Figure 25: Europe US Meat Market Revenue Share (%), by Distribution Channel 2024 & 2032
- Figure 26: Europe US Meat Market Revenue (Million), by Country 2024 & 2032
- Figure 27: Europe US Meat Market Revenue Share (%), by Country 2024 & 2032
- Figure 28: Middle East & Africa US Meat Market Revenue (Million), by Type 2024 & 2032
- Figure 29: Middle East & Africa US Meat Market Revenue Share (%), by Type 2024 & 2032
- Figure 30: Middle East & Africa US Meat Market Revenue (Million), by Form 2024 & 2032
- Figure 31: Middle East & Africa US Meat Market Revenue Share (%), by Form 2024 & 2032
- Figure 32: Middle East & Africa US Meat Market Revenue (Million), by Distribution Channel 2024 & 2032
- Figure 33: Middle East & Africa US Meat Market Revenue Share (%), by Distribution Channel 2024 & 2032
- Figure 34: Middle East & Africa US Meat Market Revenue (Million), by Country 2024 & 2032
- Figure 35: Middle East & Africa US Meat Market Revenue Share (%), by Country 2024 & 2032
- Figure 36: Asia Pacific US Meat Market Revenue (Million), by Type 2024 & 2032
- Figure 37: Asia Pacific US Meat Market Revenue Share (%), by Type 2024 & 2032
- Figure 38: Asia Pacific US Meat Market Revenue (Million), by Form 2024 & 2032
- Figure 39: Asia Pacific US Meat Market Revenue Share (%), by Form 2024 & 2032
- Figure 40: Asia Pacific US Meat Market Revenue (Million), by Distribution Channel 2024 & 2032
- Figure 41: Asia Pacific US Meat Market Revenue Share (%), by Distribution Channel 2024 & 2032
- Figure 42: Asia Pacific US Meat Market Revenue (Million), by Country 2024 & 2032
- Figure 43: Asia Pacific US Meat Market Revenue Share (%), by Country 2024 & 2032
List of Tables
- Table 1: Global US Meat Market Revenue Million Forecast, by Region 2019 & 2032
- Table 2: Global US Meat Market Revenue Million Forecast, by Type 2019 & 2032
- Table 3: Global US Meat Market Revenue Million Forecast, by Form 2019 & 2032
- Table 4: Global US Meat Market Revenue Million Forecast, by Distribution Channel 2019 & 2032
- Table 5: Global US Meat Market Revenue Million Forecast, by Region 2019 & 2032
- Table 6: Global US Meat Market Revenue Million Forecast, by Country 2019 & 2032
- Table 7: Northeast US Meat Market Revenue (Million) Forecast, by Application 2019 & 2032
- Table 8: Southeast US Meat Market Revenue (Million) Forecast, by Application 2019 & 2032
- Table 9: Midwest US Meat Market Revenue (Million) Forecast, by Application 2019 & 2032
- Table 10: Southwest US Meat Market Revenue (Million) Forecast, by Application 2019 & 2032
- Table 11: West US Meat Market Revenue (Million) Forecast, by Application 2019 & 2032
- Table 12: Global US Meat Market Revenue Million Forecast, by Type 2019 & 2032
- Table 13: Global US Meat Market Revenue Million Forecast, by Form 2019 & 2032
- Table 14: Global US Meat Market Revenue Million Forecast, by Distribution Channel 2019 & 2032
- Table 15: Global US Meat Market Revenue Million Forecast, by Country 2019 & 2032
- Table 16: United States US Meat Market Revenue (Million) Forecast, by Application 2019 & 2032
- Table 17: Canada US Meat Market Revenue (Million) Forecast, by Application 2019 & 2032
- Table 18: Mexico US Meat Market Revenue (Million) Forecast, by Application 2019 & 2032
- Table 19: Global US Meat Market Revenue Million Forecast, by Type 2019 & 2032
- Table 20: Global US Meat Market Revenue Million Forecast, by Form 2019 & 2032
- Table 21: Global US Meat Market Revenue Million Forecast, by Distribution Channel 2019 & 2032
- Table 22: Global US Meat Market Revenue Million Forecast, by Country 2019 & 2032
- Table 23: Brazil US Meat Market Revenue (Million) Forecast, by Application 2019 & 2032
- Table 24: Argentina US Meat Market Revenue (Million) Forecast, by Application 2019 & 2032
- Table 25: Rest of South America US Meat Market Revenue (Million) Forecast, by Application 2019 & 2032
- Table 26: Global US Meat Market Revenue Million Forecast, by Type 2019 & 2032
- Table 27: Global US Meat Market Revenue Million Forecast, by Form 2019 & 2032
- Table 28: Global US Meat Market Revenue Million Forecast, by Distribution Channel 2019 & 2032
- Table 29: Global US Meat Market Revenue Million Forecast, by Country 2019 & 2032
- Table 30: United Kingdom US Meat Market Revenue (Million) Forecast, by Application 2019 & 2032
- Table 31: Germany US Meat Market Revenue (Million) Forecast, by Application 2019 & 2032
- Table 32: France US Meat Market Revenue (Million) Forecast, by Application 2019 & 2032
- Table 33: Italy US Meat Market Revenue (Million) Forecast, by Application 2019 & 2032
- Table 34: Spain US Meat Market Revenue (Million) Forecast, by Application 2019 & 2032
- Table 35: Russia US Meat Market Revenue (Million) Forecast, by Application 2019 & 2032
- Table 36: Benelux US Meat Market Revenue (Million) Forecast, by Application 2019 & 2032
- Table 37: Nordics US Meat Market Revenue (Million) Forecast, by Application 2019 & 2032
- Table 38: Rest of Europe US Meat Market Revenue (Million) Forecast, by Application 2019 & 2032
- Table 39: Global US Meat Market Revenue Million Forecast, by Type 2019 & 2032
- Table 40: Global US Meat Market Revenue Million Forecast, by Form 2019 & 2032
- Table 41: Global US Meat Market Revenue Million Forecast, by Distribution Channel 2019 & 2032
- Table 42: Global US Meat Market Revenue Million Forecast, by Country 2019 & 2032
- Table 43: Turkey US Meat Market Revenue (Million) Forecast, by Application 2019 & 2032
- Table 44: Israel US Meat Market Revenue (Million) Forecast, by Application 2019 & 2032
- Table 45: GCC US Meat Market Revenue (Million) Forecast, by Application 2019 & 2032
- Table 46: North Africa US Meat Market Revenue (Million) Forecast, by Application 2019 & 2032
- Table 47: South Africa US Meat Market Revenue (Million) Forecast, by Application 2019 & 2032
- Table 48: Rest of Middle East & Africa US Meat Market Revenue (Million) Forecast, by Application 2019 & 2032
- Table 49: Global US Meat Market Revenue Million Forecast, by Type 2019 & 2032
- Table 50: Global US Meat Market Revenue Million Forecast, by Form 2019 & 2032
- Table 51: Global US Meat Market Revenue Million Forecast, by Distribution Channel 2019 & 2032
- Table 52: Global US Meat Market Revenue Million Forecast, by Country 2019 & 2032
- Table 53: China US Meat Market Revenue (Million) Forecast, by Application 2019 & 2032
- Table 54: India US Meat Market Revenue (Million) Forecast, by Application 2019 & 2032
- Table 55: Japan US Meat Market Revenue (Million) Forecast, by Application 2019 & 2032
- Table 56: South Korea US Meat Market Revenue (Million) Forecast, by Application 2019 & 2032
- Table 57: ASEAN US Meat Market Revenue (Million) Forecast, by Application 2019 & 2032
- Table 58: Oceania US Meat Market Revenue (Million) Forecast, by Application 2019 & 2032
- Table 59: Rest of Asia Pacific US Meat Market Revenue (Million) Forecast, by Application 2019 & 2032
Frequently Asked Questions
1. What is the projected Compound Annual Growth Rate (CAGR) of the US Meat Market?
The projected CAGR is approximately 6.42%.
2. Which companies are prominent players in the US Meat Market?
Key companies in the market include WH Group Limite, NH Foods Ltd, Vion Group, Tyson Foods Inc, Conagra Brands Inc, Sysco Corporation, The Kraft Heinz Company, Hormel Foods Corporation, Cargill Inc, Marfrig Global Foods S A, The Clemens Family Corporation, JBS SA, OSI Group.
3. What are the main segments of the US Meat Market?
The market segments include Type, Form, Distribution Channel.
4. Can you provide details about the market size?
The market size is estimated to be USD XX Million as of 2022.
5. What are some drivers contributing to market growth?
Increasing Demand for Low-Fat and Low-Calorie Food; Increasing Product Innovation.
6. What are the notable trends driving market growth?
OTHER KEY INDUSTRY TRENDS COVERED IN THE REPORT.
7. Are there any restraints impacting market growth?
; Threat of New Entrants; Bargaining Power of Buyers/Consumers; Bargaining Power of Suppliers; Threat of Substitute Products; Degree Of Competition.
8. Can you provide examples of recent developments in the market?
April 2023: Swift Prepared Food, a subsidiary of JBS USA, launched Principe Foods, which produces high-quality Italian meats and charcuterie.December 2022: JBS has acquired “certain assets” from US-based pork supplier TriOak Foods, strengthening its control over the supply chain.November 2022: Conagra Brands, Inc. has announced plans to invest about USD 60 million to expand the Troy facility's production capacity in Ohio, United States. Slim Jim products are mainly manufactured in the facility. Conagra stated that the 389,000 square foot plant will gain around 15,000 square feet as part of the expansion.
9. What pricing options are available for accessing the report?
Pricing options include single-user, multi-user, and enterprise licenses priced at USD 3800, USD 4500, and USD 5800 respectively.
10. Is the market size provided in terms of value or volume?
The market size is provided in terms of value, measured in Million.
11. Are there any specific market keywords associated with the report?
Yes, the market keyword associated with the report is "US Meat Market," which aids in identifying and referencing the specific market segment covered.
12. How do I determine which pricing option suits my needs best?
The pricing options vary based on user requirements and access needs. Individual users may opt for single-user licenses, while businesses requiring broader access may choose multi-user or enterprise licenses for cost-effective access to the report.
13. Are there any additional resources or data provided in the US Meat Market report?
While the report offers comprehensive insights, it's advisable to review the specific contents or supplementary materials provided to ascertain if additional resources or data are available.
14. How can I stay updated on further developments or reports in the US Meat Market?
To stay informed about further developments, trends, and reports in the US Meat Market, consider subscribing to industry newsletters, following relevant companies and organizations, or regularly checking reputable industry news sources and publications.
Methodology
Step 1 - Identification of Relevant Samples Size from Population Database


Step 2 - Approaches for Defining Global Market Size (Value, Volume* & Price*)

Note*: In applicable scenarios
Step 3 - Data Sources
Primary Research
- Web Analytics
- Survey Reports
- Research Institute
- Latest Research Reports
- Opinion Leaders
Secondary Research
- Annual Reports
- White Paper
- Latest Press Release
- Industry Association
- Paid Database
- Investor Presentations

Step 4 - Data Triangulation
Involves using different sources of information in order to increase the validity of a study
These sources are likely to be stakeholders in a program - participants, other researchers, program staff, other community members, and so on.
Then we put all data in single framework & apply various statistical tools to find out the dynamic on the market.
During the analysis stage, feedback from the stakeholder groups would be compared to determine areas of agreement as well as areas of divergence


