
Key Insights
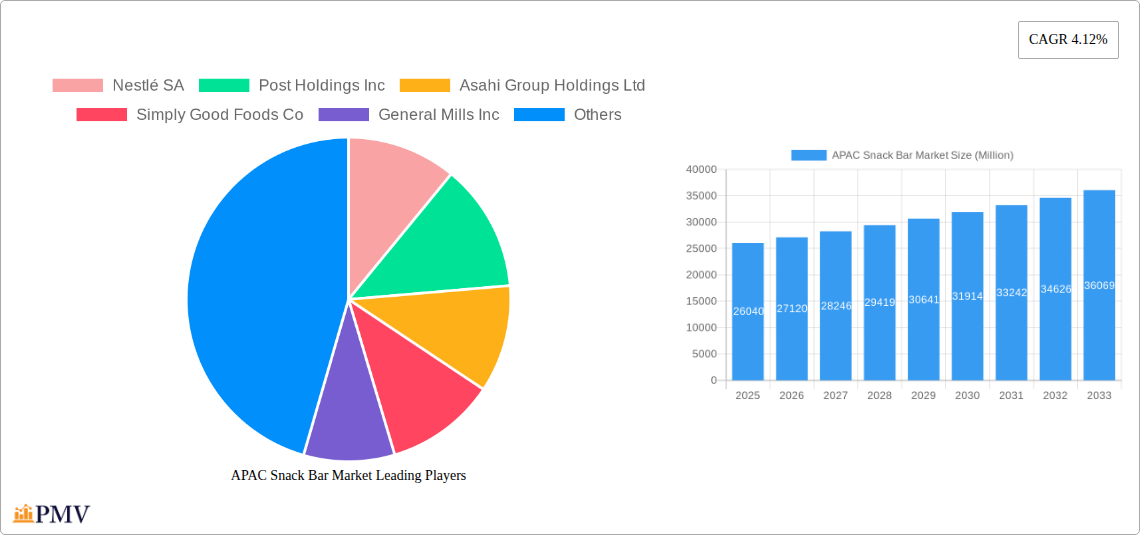
The Asia-Pacific (APAC) snack bar market, valued at $26,040 million in 2025, is projected to experience robust growth, driven by several key factors. The rising disposable incomes across the region, particularly in burgeoning economies like India and Indonesia, are fueling increased consumer spending on convenient and on-the-go food options. Health and wellness trends are also significantly impacting the market, with a surge in demand for protein bars and fruit & nut bars reflecting a growing focus on fitness and nutritious snacking. The diversification of distribution channels, including the rapid expansion of online retail and convenience stores, further contributes to market expansion. While factors like fluctuating raw material prices and intense competition among established players present challenges, the overall market outlook remains positive. Specific regional variations exist; for instance, Japan and South Korea showcase a preference for sophisticated, premium snack bars, while other markets exhibit higher demand for more affordable options. The increasing adoption of functional snack bars, incorporating ingredients like probiotics or superfoods, presents a significant opportunity for market growth in the coming years.
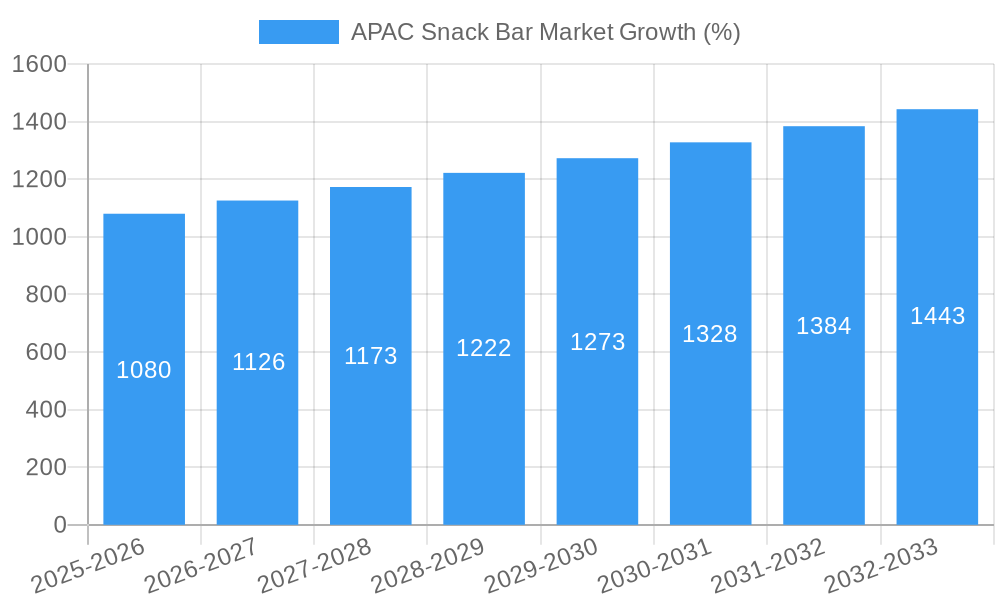
This growth is further fueled by changing lifestyles and increased urbanization across the APAC region. Consumers are increasingly seeking convenient and portable snack options that fit into busy schedules. The market is witnessing innovation in product offerings, with manufacturers focusing on catering to specific dietary needs and preferences, such as gluten-free, vegan, and organic snack bars. The strategic partnerships between snack bar manufacturers and retailers are improving product availability and market penetration. Furthermore, targeted marketing campaigns highlighting the health benefits and convenience of snack bars are driving consumption. While the competitive landscape is intense, companies are adopting various strategies, including product diversification, brand building, and strategic acquisitions, to maintain a competitive edge. The forecast period (2025-2033) promises continued expansion, with a projected CAGR of 4.12%, suggesting a substantial increase in market value by 2033.
APAC Snack Bar Market: A Comprehensive Report (2019-2033)
This comprehensive report provides an in-depth analysis of the Asia-Pacific (APAC) snack bar market, offering invaluable insights for businesses and investors seeking to navigate this dynamic sector. Covering the period from 2019 to 2033, with a focus on 2025, this report meticulously examines market size, growth drivers, competitive landscape, and future trends. The study includes detailed segmentations by confectionery variant (Cereal Bar, Fruit & Nut Bar, Protein Bar), distribution channel (Convenience Store, Online Retail Store, Supermarket/Hypermarket, Others), and key countries (Australia, China, India, Indonesia, Japan, Malaysia, New Zealand, South Korea, Rest of Asia-Pacific). The report values are in Millions.
APAC Snack Bar Market Market Structure & Competitive Dynamics
The APAC snack bar market exhibits a moderately concentrated structure, with a few multinational giants like Nestlé SA, PepsiCo Inc, and Mondelēz International Inc holding significant market share. However, smaller regional players and local brands are increasingly gaining traction, particularly in the health and wellness segment. The market is characterized by a dynamic innovation ecosystem, with continuous product launches, flavor variations, and functional enhancements. Regulatory frameworks concerning food labeling, ingredient standards, and health claims vary across countries, influencing product formulations and marketing strategies. Product substitutes, such as energy drinks and other confectionery items, pose a competitive challenge. Consumer preferences are shifting towards healthier options, driving demand for protein bars, fruit & nut bars, and bars with added functional ingredients. M&A activities are moderate, driven by established players seeking to expand their product portfolios and geographic reach. Recent M&A deal values have averaged xx Million, with a focus on smaller, niche brands. Market share data reveals a top three player share of approximately xx%, indicating the moderate concentration.
APAC Snack Bar Market Industry Trends & Insights
The APAC snack bar market is witnessing robust growth, driven by factors such as rising disposable incomes, changing lifestyles, and increasing health consciousness. The market is expected to experience a Compound Annual Growth Rate (CAGR) of xx% during the forecast period (2025-2033). Technological disruptions, such as improved production processes and innovative packaging solutions, are enhancing efficiency and expanding market reach. Consumer preferences are evolving towards healthier and more convenient snacking options, fueling demand for products with added protein, fiber, and other functional ingredients. Market penetration of online retail channels is increasing steadily, with a projected xx% market share by 2033. The competitive dynamics are intense, with established players focusing on innovation and brand building to maintain their market position. Premiumization is a key trend, with consumers willing to pay more for high-quality, functional snack bars.
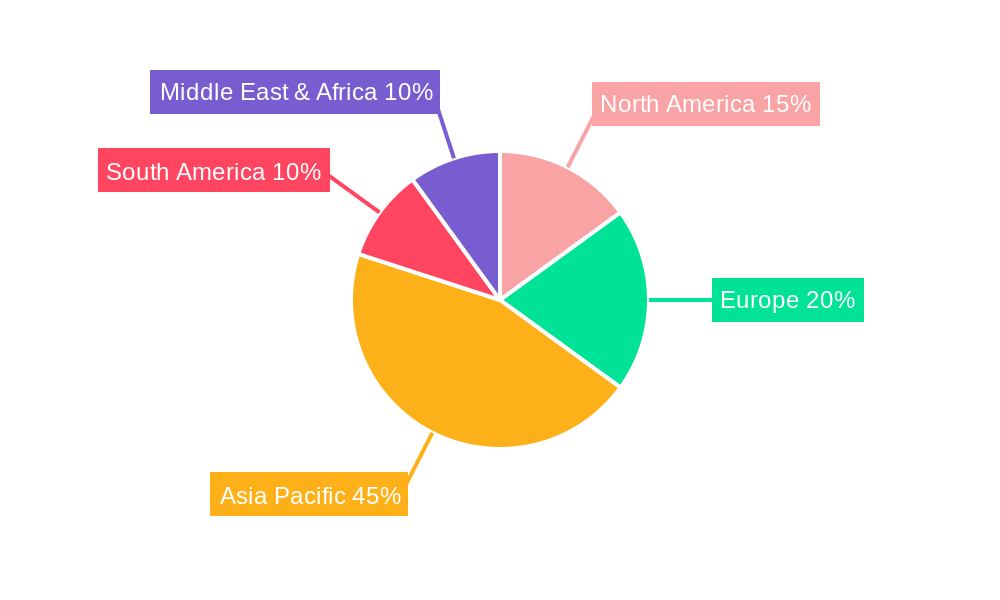
Dominant Markets & Segments in APAC Snack Bar Market
- Leading Region: China remains the dominant market, driven by its large population and rapidly expanding middle class.
- Leading Country: India is experiencing strong growth, fueled by increasing urbanization and a preference for convenient snacking options.
- Leading Segment (Confectionery Variant): The Protein Bar segment is exhibiting the highest growth, reflecting the growing health-conscious consumer base. This is closely followed by the Fruit & Nut Bar segment.
- Leading Segment (Distribution Channel): Supermarket/Hypermarkets remain the primary distribution channel, though online retail is rapidly gaining share.
China's dominance is fueled by several key drivers:
- Favorable economic policies that support food processing and retail sectors.
- Expanding infrastructure, leading to improved distribution networks.
- A growing preference for western-style snacks and convenience food.
India’s growth is propelled by:
- Rapid urbanization and increasing disposable incomes.
- A young population with a growing preference for convenient and healthy snacks.
- The emergence of organized retail outlets.
The Protein Bar segment’s popularity stems from:
- The growing emphasis on fitness and health in APAC.
- The increasing awareness of the importance of protein in maintaining an active lifestyle.
- Innovation in protein bar formulations, offering diverse flavors and textures.
APAC Snack Bar Market Product Innovations
Recent product innovations include the launch of protein-enhanced bars, gluten-free options, and bars with added functional ingredients such as probiotics and superfoods. These innovations cater to evolving consumer preferences for healthier and more functional snacking options. The adoption of sustainable packaging materials and eco-friendly manufacturing practices also represents a notable trend. Technological advances in bar formulation and manufacturing are leading to improved textures, longer shelf life, and enhanced nutritional profiles. This continuous innovation strengthens market competitiveness and drives overall market growth.
Report Segmentation & Scope
The report segments the APAC snack bar market comprehensively by confectionery variant (Cereal Bar, Fruit & Nut Bar, Protein Bar), distribution channel (Convenience Store, Online Retail Store, Supermarket/Hypermarket, Others), and country (Australia, China, India, Indonesia, Japan, Malaysia, New Zealand, South Korea, Rest of Asia-Pacific). Each segment's growth projections, market size, and competitive dynamics are thoroughly analyzed. For example, the Cereal Bar segment is anticipated to see a CAGR of xx% driven by strong demand in established markets, while the Online Retail segment will experience the highest growth due to increased penetration and convenience for consumers.
Key Drivers of APAC Snack Bar Market Growth
The APAC snack bar market growth is driven by several factors. Rising disposable incomes and increasing urbanization are creating a larger consumer base with greater purchasing power. A shift toward Westernized lifestyles and convenient snacking options is fuelling demand. Government policies promoting food processing and retail infrastructure development further contribute to market expansion. Lastly, the growing health consciousness among consumers is driving demand for healthier snack options, including protein bars and fruit & nut bars.
Challenges in the APAC Snack Bar Market Sector
The APAC snack bar market faces certain challenges. Stringent food safety and labeling regulations across different countries pose regulatory hurdles. Supply chain complexities and fluctuations in raw material prices are affecting cost structures. Furthermore, intense competition among existing players and the emergence of new entrants create competitive pressures on profit margins. The impact of these factors is reflected in the overall market dynamics and requires strategic adaptation from companies to maintain profitability.
Leading Players in the APAC Snack Bar Market Market
- Nestlé SA
- Post Holdings Inc
- Asahi Group Holdings Ltd
- Simply Good Foods Co
- General Mills Inc
- PepsiCo Inc
- Lotus Bakeries
- Morinaga & Co Ltd
- Bagrrys India Private Limited
- Carman's Fine Foods Pty Ltd
- Ferrero International SA
- Naturell India Pvt Ltd
- Mars Incorporated
- Otsuka Holdings Co Ltd
- Mondelēz International Inc
- Amway International Inc
- Kellogg Company
Key Developments in APAC Snack Bar Market Sector
- May 2023: Nestlé’s Milo launched a protein snack bar in Australia.
- May 2023: Uncle Tobys unveiled a new protein muesli bar in Australia.
- March 2023: Bagrrys India Private Limited launched The Mighty Muesli Bars in India.
These product launches illustrate the ongoing innovation and competition within the APAC snack bar market, reflecting the growing demand for healthy and convenient snack options.
Strategic APAC Snack Bar Market Market Outlook
The APAC snack bar market presents significant growth opportunities. The increasing health consciousness, coupled with rising disposable incomes and evolving consumer preferences, will drive continued market expansion. Strategic opportunities lie in developing innovative, healthy products, expanding distribution networks, and leveraging digital marketing strategies to reach the target consumers. The market’s future potential is substantial, particularly within emerging economies with rapidly growing middle classes. Companies should focus on product diversification, branding, and sustainable practices to capitalize on this positive market outlook.
APAC Snack Bar Market Segmentation
-
1. Confectionery Variant
- 1.1. Cereal Bar
- 1.2. Fruit & Nut Bar
- 1.3. Protein Bar
-
2. Distribution Channel
- 2.1. Convenience Store
- 2.2. Online Retail Store
- 2.3. Supermarket/Hypermarket
- 2.4. Others
APAC Snack Bar Market Segmentation By Geography
-
1. North America
- 1.1. United States
- 1.2. Canada
- 1.3. Mexico
-
2. South America
- 2.1. Brazil
- 2.2. Argentina
- 2.3. Rest of South America
-
3. Europe
- 3.1. United Kingdom
- 3.2. Germany
- 3.3. France
- 3.4. Italy
- 3.5. Spain
- 3.6. Russia
- 3.7. Benelux
- 3.8. Nordics
- 3.9. Rest of Europe
-
4. Middle East & Africa
- 4.1. Turkey
- 4.2. Israel
- 4.3. GCC
- 4.4. North Africa
- 4.5. South Africa
- 4.6. Rest of Middle East & Africa
-
5. Asia Pacific
- 5.1. China
- 5.2. India
- 5.3. Japan
- 5.4. South Korea
- 5.5. ASEAN
- 5.6. Oceania
- 5.7. Rest of Asia Pacific
APAC Snack Bar Market REPORT HIGHLIGHTS
| Aspects | Details |
|---|---|
| Study Period | 2019-2033 |
| Base Year | 2024 |
| Estimated Year | 2025 |
| Forecast Period | 2025-2033 |
| Historical Period | 2019-2024 |
| Growth Rate | CAGR of 4.12% from 2019-2033 |
| Segmentation |
|
Table of Contents
- 1. Introduction
- 1.1. Research Scope
- 1.2. Market Segmentation
- 1.3. Research Methodology
- 1.4. Definitions and Assumptions
- 2. Executive Summary
- 2.1. Introduction
- 3. Market Dynamics
- 3.1. Introduction
- 3.2. Market Drivers
- 3.2.1. Popularity of Convenient and On the Go Snacking Options; Product Differentiation Playing a Key Role in Market Expansion
- 3.3. Market Restrains
- 3.3.1. Associated Health Risks; Easy Availability of Healthy Substitutes
- 3.4. Market Trends
- 3.4.1. Growing awareness regarding health-oriented products is likely to boost the segment’s sales
- 4. Market Factor Analysis
- 4.1. Porters Five Forces
- 4.2. Supply/Value Chain
- 4.3. PESTEL analysis
- 4.4. Market Entropy
- 4.5. Patent/Trademark Analysis
- 5. Global APAC Snack Bar Market Analysis, Insights and Forecast, 2019-2031
- 5.1. Market Analysis, Insights and Forecast - by Confectionery Variant
- 5.1.1. Cereal Bar
- 5.1.2. Fruit & Nut Bar
- 5.1.3. Protein Bar
- 5.2. Market Analysis, Insights and Forecast - by Distribution Channel
- 5.2.1. Convenience Store
- 5.2.2. Online Retail Store
- 5.2.3. Supermarket/Hypermarket
- 5.2.4. Others
- 5.3. Market Analysis, Insights and Forecast - by Region
- 5.3.1. North America
- 5.3.2. South America
- 5.3.3. Europe
- 5.3.4. Middle East & Africa
- 5.3.5. Asia Pacific
- 5.1. Market Analysis, Insights and Forecast - by Confectionery Variant
- 6. North America APAC Snack Bar Market Analysis, Insights and Forecast, 2019-2031
- 6.1. Market Analysis, Insights and Forecast - by Confectionery Variant
- 6.1.1. Cereal Bar
- 6.1.2. Fruit & Nut Bar
- 6.1.3. Protein Bar
- 6.2. Market Analysis, Insights and Forecast - by Distribution Channel
- 6.2.1. Convenience Store
- 6.2.2. Online Retail Store
- 6.2.3. Supermarket/Hypermarket
- 6.2.4. Others
- 6.1. Market Analysis, Insights and Forecast - by Confectionery Variant
- 7. South America APAC Snack Bar Market Analysis, Insights and Forecast, 2019-2031
- 7.1. Market Analysis, Insights and Forecast - by Confectionery Variant
- 7.1.1. Cereal Bar
- 7.1.2. Fruit & Nut Bar
- 7.1.3. Protein Bar
- 7.2. Market Analysis, Insights and Forecast - by Distribution Channel
- 7.2.1. Convenience Store
- 7.2.2. Online Retail Store
- 7.2.3. Supermarket/Hypermarket
- 7.2.4. Others
- 7.1. Market Analysis, Insights and Forecast - by Confectionery Variant
- 8. Europe APAC Snack Bar Market Analysis, Insights and Forecast, 2019-2031
- 8.1. Market Analysis, Insights and Forecast - by Confectionery Variant
- 8.1.1. Cereal Bar
- 8.1.2. Fruit & Nut Bar
- 8.1.3. Protein Bar
- 8.2. Market Analysis, Insights and Forecast - by Distribution Channel
- 8.2.1. Convenience Store
- 8.2.2. Online Retail Store
- 8.2.3. Supermarket/Hypermarket
- 8.2.4. Others
- 8.1. Market Analysis, Insights and Forecast - by Confectionery Variant
- 9. Middle East & Africa APAC Snack Bar Market Analysis, Insights and Forecast, 2019-2031
- 9.1. Market Analysis, Insights and Forecast - by Confectionery Variant
- 9.1.1. Cereal Bar
- 9.1.2. Fruit & Nut Bar
- 9.1.3. Protein Bar
- 9.2. Market Analysis, Insights and Forecast - by Distribution Channel
- 9.2.1. Convenience Store
- 9.2.2. Online Retail Store
- 9.2.3. Supermarket/Hypermarket
- 9.2.4. Others
- 9.1. Market Analysis, Insights and Forecast - by Confectionery Variant
- 10. Asia Pacific APAC Snack Bar Market Analysis, Insights and Forecast, 2019-2031
- 10.1. Market Analysis, Insights and Forecast - by Confectionery Variant
- 10.1.1. Cereal Bar
- 10.1.2. Fruit & Nut Bar
- 10.1.3. Protein Bar
- 10.2. Market Analysis, Insights and Forecast - by Distribution Channel
- 10.2.1. Convenience Store
- 10.2.2. Online Retail Store
- 10.2.3. Supermarket/Hypermarket
- 10.2.4. Others
- 10.1. Market Analysis, Insights and Forecast - by Confectionery Variant
- 11. North America APAC Snack Bar Market Analysis, Insights and Forecast, 2019-2031
- 11.1. Market Analysis, Insights and Forecast - By Country/Sub-region
- 11.1.1 United States
- 11.1.2 Canada
- 11.1.3 Mexico
- 11.1.4 Rest of North America
- 12. Europe APAC Snack Bar Market Analysis, Insights and Forecast, 2019-2031
- 12.1. Market Analysis, Insights and Forecast - By Country/Sub-region
- 12.1.1 United Kingdom
- 12.1.2 Germany
- 12.1.3 Spain
- 12.1.4 France
- 12.1.5 Italy
- 12.1.6 Russia
- 12.1.7 Rest of Europe
- 13. Asia Pacific APAC Snack Bar Market Analysis, Insights and Forecast, 2019-2031
- 13.1. Market Analysis, Insights and Forecast - By Country/Sub-region
- 13.1.1 China
- 13.1.2 Japan
- 13.1.3 India
- 13.1.4 Australia
- 13.1.5 Rest of Asia Pacific
- 14. South America APAC Snack Bar Market Analysis, Insights and Forecast, 2019-2031
- 14.1. Market Analysis, Insights and Forecast - By Country/Sub-region
- 14.1.1 Brazil
- 14.1.2 Argentina
- 14.1.3 Rest of South America
- 15. Middle East & Africa APAC Snack Bar Market Analysis, Insights and Forecast, 2019-2031
- 15.1. Market Analysis, Insights and Forecast - By Country/Sub-region
- 15.1.1 UAE
- 15.1.2 South Africa
- 15.1.3 Saudi Arabia
- 15.1.4 Rest of MEA
- 16. Saudi Arabia APAC Snack Bar Market Analysis, Insights and Forecast, 2019-2031
- 16.1. Market Analysis, Insights and Forecast - By Country/Sub-region
- 16.1.1 South Africa
- 16.1.2 Rest of Middle East
- 17. Competitive Analysis
- 17.1. Global Market Share Analysis 2024
- 17.2. Company Profiles
- 17.2.1 Nestlé SA
- 17.2.1.1. Overview
- 17.2.1.2. Products
- 17.2.1.3. SWOT Analysis
- 17.2.1.4. Recent Developments
- 17.2.1.5. Financials (Based on Availability)
- 17.2.2 Post Holdings Inc
- 17.2.2.1. Overview
- 17.2.2.2. Products
- 17.2.2.3. SWOT Analysis
- 17.2.2.4. Recent Developments
- 17.2.2.5. Financials (Based on Availability)
- 17.2.3 Asahi Group Holdings Ltd
- 17.2.3.1. Overview
- 17.2.3.2. Products
- 17.2.3.3. SWOT Analysis
- 17.2.3.4. Recent Developments
- 17.2.3.5. Financials (Based on Availability)
- 17.2.4 Simply Good Foods Co
- 17.2.4.1. Overview
- 17.2.4.2. Products
- 17.2.4.3. SWOT Analysis
- 17.2.4.4. Recent Developments
- 17.2.4.5. Financials (Based on Availability)
- 17.2.5 General Mills Inc
- 17.2.5.1. Overview
- 17.2.5.2. Products
- 17.2.5.3. SWOT Analysis
- 17.2.5.4. Recent Developments
- 17.2.5.5. Financials (Based on Availability)
- 17.2.6 PepsiCo Inc
- 17.2.6.1. Overview
- 17.2.6.2. Products
- 17.2.6.3. SWOT Analysis
- 17.2.6.4. Recent Developments
- 17.2.6.5. Financials (Based on Availability)
- 17.2.7 Lotus Bakeries
- 17.2.7.1. Overview
- 17.2.7.2. Products
- 17.2.7.3. SWOT Analysis
- 17.2.7.4. Recent Developments
- 17.2.7.5. Financials (Based on Availability)
- 17.2.8 Morinaga & Co Ltd
- 17.2.8.1. Overview
- 17.2.8.2. Products
- 17.2.8.3. SWOT Analysis
- 17.2.8.4. Recent Developments
- 17.2.8.5. Financials (Based on Availability)
- 17.2.9 Bagrrys India Private Limited
- 17.2.9.1. Overview
- 17.2.9.2. Products
- 17.2.9.3. SWOT Analysis
- 17.2.9.4. Recent Developments
- 17.2.9.5. Financials (Based on Availability)
- 17.2.10 Carman's Fine Foods Pty Ltd
- 17.2.10.1. Overview
- 17.2.10.2. Products
- 17.2.10.3. SWOT Analysis
- 17.2.10.4. Recent Developments
- 17.2.10.5. Financials (Based on Availability)
- 17.2.11 Ferrero International SA
- 17.2.11.1. Overview
- 17.2.11.2. Products
- 17.2.11.3. SWOT Analysis
- 17.2.11.4. Recent Developments
- 17.2.11.5. Financials (Based on Availability)
- 17.2.12 Naturell India Pvt Ltd
- 17.2.12.1. Overview
- 17.2.12.2. Products
- 17.2.12.3. SWOT Analysis
- 17.2.12.4. Recent Developments
- 17.2.12.5. Financials (Based on Availability)
- 17.2.13 Mars Incorporated
- 17.2.13.1. Overview
- 17.2.13.2. Products
- 17.2.13.3. SWOT Analysis
- 17.2.13.4. Recent Developments
- 17.2.13.5. Financials (Based on Availability)
- 17.2.14 Otsuka Holdings Co Ltd
- 17.2.14.1. Overview
- 17.2.14.2. Products
- 17.2.14.3. SWOT Analysis
- 17.2.14.4. Recent Developments
- 17.2.14.5. Financials (Based on Availability)
- 17.2.15 Mondelēz International Inc
- 17.2.15.1. Overview
- 17.2.15.2. Products
- 17.2.15.3. SWOT Analysis
- 17.2.15.4. Recent Developments
- 17.2.15.5. Financials (Based on Availability)
- 17.2.16 Amway International Inc
- 17.2.16.1. Overview
- 17.2.16.2. Products
- 17.2.16.3. SWOT Analysis
- 17.2.16.4. Recent Developments
- 17.2.16.5. Financials (Based on Availability)
- 17.2.17 Kellogg Company
- 17.2.17.1. Overview
- 17.2.17.2. Products
- 17.2.17.3. SWOT Analysis
- 17.2.17.4. Recent Developments
- 17.2.17.5. Financials (Based on Availability)
- 17.2.1 Nestlé SA
List of Figures
- Figure 1: Global APAC Snack Bar Market Revenue Breakdown (Million, %) by Region 2024 & 2032
- Figure 2: Global APAC Snack Bar Market Volume Breakdown (K Tons, %) by Region 2024 & 2032
- Figure 3: North America APAC Snack Bar Market Revenue (Million), by Country 2024 & 2032
- Figure 4: North America APAC Snack Bar Market Volume (K Tons), by Country 2024 & 2032
- Figure 5: North America APAC Snack Bar Market Revenue Share (%), by Country 2024 & 2032
- Figure 6: North America APAC Snack Bar Market Volume Share (%), by Country 2024 & 2032
- Figure 7: Europe APAC Snack Bar Market Revenue (Million), by Country 2024 & 2032
- Figure 8: Europe APAC Snack Bar Market Volume (K Tons), by Country 2024 & 2032
- Figure 9: Europe APAC Snack Bar Market Revenue Share (%), by Country 2024 & 2032
- Figure 10: Europe APAC Snack Bar Market Volume Share (%), by Country 2024 & 2032
- Figure 11: Asia Pacific APAC Snack Bar Market Revenue (Million), by Country 2024 & 2032
- Figure 12: Asia Pacific APAC Snack Bar Market Volume (K Tons), by Country 2024 & 2032
- Figure 13: Asia Pacific APAC Snack Bar Market Revenue Share (%), by Country 2024 & 2032
- Figure 14: Asia Pacific APAC Snack Bar Market Volume Share (%), by Country 2024 & 2032
- Figure 15: South America APAC Snack Bar Market Revenue (Million), by Country 2024 & 2032
- Figure 16: South America APAC Snack Bar Market Volume (K Tons), by Country 2024 & 2032
- Figure 17: South America APAC Snack Bar Market Revenue Share (%), by Country 2024 & 2032
- Figure 18: South America APAC Snack Bar Market Volume Share (%), by Country 2024 & 2032
- Figure 19: Middle East & Africa APAC Snack Bar Market Revenue (Million), by Country 2024 & 2032
- Figure 20: Middle East & Africa APAC Snack Bar Market Volume (K Tons), by Country 2024 & 2032
- Figure 21: Middle East & Africa APAC Snack Bar Market Revenue Share (%), by Country 2024 & 2032
- Figure 22: Middle East & Africa APAC Snack Bar Market Volume Share (%), by Country 2024 & 2032
- Figure 23: Saudi Arabia APAC Snack Bar Market Revenue (Million), by Country 2024 & 2032
- Figure 24: Saudi Arabia APAC Snack Bar Market Volume (K Tons), by Country 2024 & 2032
- Figure 25: Saudi Arabia APAC Snack Bar Market Revenue Share (%), by Country 2024 & 2032
- Figure 26: Saudi Arabia APAC Snack Bar Market Volume Share (%), by Country 2024 & 2032
- Figure 27: North America APAC Snack Bar Market Revenue (Million), by Confectionery Variant 2024 & 2032
- Figure 28: North America APAC Snack Bar Market Volume (K Tons), by Confectionery Variant 2024 & 2032
- Figure 29: North America APAC Snack Bar Market Revenue Share (%), by Confectionery Variant 2024 & 2032
- Figure 30: North America APAC Snack Bar Market Volume Share (%), by Confectionery Variant 2024 & 2032
- Figure 31: North America APAC Snack Bar Market Revenue (Million), by Distribution Channel 2024 & 2032
- Figure 32: North America APAC Snack Bar Market Volume (K Tons), by Distribution Channel 2024 & 2032
- Figure 33: North America APAC Snack Bar Market Revenue Share (%), by Distribution Channel 2024 & 2032
- Figure 34: North America APAC Snack Bar Market Volume Share (%), by Distribution Channel 2024 & 2032
- Figure 35: North America APAC Snack Bar Market Revenue (Million), by Country 2024 & 2032
- Figure 36: North America APAC Snack Bar Market Volume (K Tons), by Country 2024 & 2032
- Figure 37: North America APAC Snack Bar Market Revenue Share (%), by Country 2024 & 2032
- Figure 38: North America APAC Snack Bar Market Volume Share (%), by Country 2024 & 2032
- Figure 39: South America APAC Snack Bar Market Revenue (Million), by Confectionery Variant 2024 & 2032
- Figure 40: South America APAC Snack Bar Market Volume (K Tons), by Confectionery Variant 2024 & 2032
- Figure 41: South America APAC Snack Bar Market Revenue Share (%), by Confectionery Variant 2024 & 2032
- Figure 42: South America APAC Snack Bar Market Volume Share (%), by Confectionery Variant 2024 & 2032
- Figure 43: South America APAC Snack Bar Market Revenue (Million), by Distribution Channel 2024 & 2032
- Figure 44: South America APAC Snack Bar Market Volume (K Tons), by Distribution Channel 2024 & 2032
- Figure 45: South America APAC Snack Bar Market Revenue Share (%), by Distribution Channel 2024 & 2032
- Figure 46: South America APAC Snack Bar Market Volume Share (%), by Distribution Channel 2024 & 2032
- Figure 47: South America APAC Snack Bar Market Revenue (Million), by Country 2024 & 2032
- Figure 48: South America APAC Snack Bar Market Volume (K Tons), by Country 2024 & 2032
- Figure 49: South America APAC Snack Bar Market Revenue Share (%), by Country 2024 & 2032
- Figure 50: South America APAC Snack Bar Market Volume Share (%), by Country 2024 & 2032
- Figure 51: Europe APAC Snack Bar Market Revenue (Million), by Confectionery Variant 2024 & 2032
- Figure 52: Europe APAC Snack Bar Market Volume (K Tons), by Confectionery Variant 2024 & 2032
- Figure 53: Europe APAC Snack Bar Market Revenue Share (%), by Confectionery Variant 2024 & 2032
- Figure 54: Europe APAC Snack Bar Market Volume Share (%), by Confectionery Variant 2024 & 2032
- Figure 55: Europe APAC Snack Bar Market Revenue (Million), by Distribution Channel 2024 & 2032
- Figure 56: Europe APAC Snack Bar Market Volume (K Tons), by Distribution Channel 2024 & 2032
- Figure 57: Europe APAC Snack Bar Market Revenue Share (%), by Distribution Channel 2024 & 2032
- Figure 58: Europe APAC Snack Bar Market Volume Share (%), by Distribution Channel 2024 & 2032
- Figure 59: Europe APAC Snack Bar Market Revenue (Million), by Country 2024 & 2032
- Figure 60: Europe APAC Snack Bar Market Volume (K Tons), by Country 2024 & 2032
- Figure 61: Europe APAC Snack Bar Market Revenue Share (%), by Country 2024 & 2032
- Figure 62: Europe APAC Snack Bar Market Volume Share (%), by Country 2024 & 2032
- Figure 63: Middle East & Africa APAC Snack Bar Market Revenue (Million), by Confectionery Variant 2024 & 2032
- Figure 64: Middle East & Africa APAC Snack Bar Market Volume (K Tons), by Confectionery Variant 2024 & 2032
- Figure 65: Middle East & Africa APAC Snack Bar Market Revenue Share (%), by Confectionery Variant 2024 & 2032
- Figure 66: Middle East & Africa APAC Snack Bar Market Volume Share (%), by Confectionery Variant 2024 & 2032
- Figure 67: Middle East & Africa APAC Snack Bar Market Revenue (Million), by Distribution Channel 2024 & 2032
- Figure 68: Middle East & Africa APAC Snack Bar Market Volume (K Tons), by Distribution Channel 2024 & 2032
- Figure 69: Middle East & Africa APAC Snack Bar Market Revenue Share (%), by Distribution Channel 2024 & 2032
- Figure 70: Middle East & Africa APAC Snack Bar Market Volume Share (%), by Distribution Channel 2024 & 2032
- Figure 71: Middle East & Africa APAC Snack Bar Market Revenue (Million), by Country 2024 & 2032
- Figure 72: Middle East & Africa APAC Snack Bar Market Volume (K Tons), by Country 2024 & 2032
- Figure 73: Middle East & Africa APAC Snack Bar Market Revenue Share (%), by Country 2024 & 2032
- Figure 74: Middle East & Africa APAC Snack Bar Market Volume Share (%), by Country 2024 & 2032
- Figure 75: Asia Pacific APAC Snack Bar Market Revenue (Million), by Confectionery Variant 2024 & 2032
- Figure 76: Asia Pacific APAC Snack Bar Market Volume (K Tons), by Confectionery Variant 2024 & 2032
- Figure 77: Asia Pacific APAC Snack Bar Market Revenue Share (%), by Confectionery Variant 2024 & 2032
- Figure 78: Asia Pacific APAC Snack Bar Market Volume Share (%), by Confectionery Variant 2024 & 2032
- Figure 79: Asia Pacific APAC Snack Bar Market Revenue (Million), by Distribution Channel 2024 & 2032
- Figure 80: Asia Pacific APAC Snack Bar Market Volume (K Tons), by Distribution Channel 2024 & 2032
- Figure 81: Asia Pacific APAC Snack Bar Market Revenue Share (%), by Distribution Channel 2024 & 2032
- Figure 82: Asia Pacific APAC Snack Bar Market Volume Share (%), by Distribution Channel 2024 & 2032
- Figure 83: Asia Pacific APAC Snack Bar Market Revenue (Million), by Country 2024 & 2032
- Figure 84: Asia Pacific APAC Snack Bar Market Volume (K Tons), by Country 2024 & 2032
- Figure 85: Asia Pacific APAC Snack Bar Market Revenue Share (%), by Country 2024 & 2032
- Figure 86: Asia Pacific APAC Snack Bar Market Volume Share (%), by Country 2024 & 2032
List of Tables
- Table 1: Global APAC Snack Bar Market Revenue Million Forecast, by Region 2019 & 2032
- Table 2: Global APAC Snack Bar Market Volume K Tons Forecast, by Region 2019 & 2032
- Table 3: Global APAC Snack Bar Market Revenue Million Forecast, by Confectionery Variant 2019 & 2032
- Table 4: Global APAC Snack Bar Market Volume K Tons Forecast, by Confectionery Variant 2019 & 2032
- Table 5: Global APAC Snack Bar Market Revenue Million Forecast, by Distribution Channel 2019 & 2032
- Table 6: Global APAC Snack Bar Market Volume K Tons Forecast, by Distribution Channel 2019 & 2032
- Table 7: Global APAC Snack Bar Market Revenue Million Forecast, by Region 2019 & 2032
- Table 8: Global APAC Snack Bar Market Volume K Tons Forecast, by Region 2019 & 2032
- Table 9: Global APAC Snack Bar Market Revenue Million Forecast, by Country 2019 & 2032
- Table 10: Global APAC Snack Bar Market Volume K Tons Forecast, by Country 2019 & 2032
- Table 11: United States APAC Snack Bar Market Revenue (Million) Forecast, by Application 2019 & 2032
- Table 12: United States APAC Snack Bar Market Volume (K Tons) Forecast, by Application 2019 & 2032
- Table 13: Canada APAC Snack Bar Market Revenue (Million) Forecast, by Application 2019 & 2032
- Table 14: Canada APAC Snack Bar Market Volume (K Tons) Forecast, by Application 2019 & 2032
- Table 15: Mexico APAC Snack Bar Market Revenue (Million) Forecast, by Application 2019 & 2032
- Table 16: Mexico APAC Snack Bar Market Volume (K Tons) Forecast, by Application 2019 & 2032
- Table 17: Rest of North America APAC Snack Bar Market Revenue (Million) Forecast, by Application 2019 & 2032
- Table 18: Rest of North America APAC Snack Bar Market Volume (K Tons) Forecast, by Application 2019 & 2032
- Table 19: Global APAC Snack Bar Market Revenue Million Forecast, by Country 2019 & 2032
- Table 20: Global APAC Snack Bar Market Volume K Tons Forecast, by Country 2019 & 2032
- Table 21: United Kingdom APAC Snack Bar Market Revenue (Million) Forecast, by Application 2019 & 2032
- Table 22: United Kingdom APAC Snack Bar Market Volume (K Tons) Forecast, by Application 2019 & 2032
- Table 23: Germany APAC Snack Bar Market Revenue (Million) Forecast, by Application 2019 & 2032
- Table 24: Germany APAC Snack Bar Market Volume (K Tons) Forecast, by Application 2019 & 2032
- Table 25: Spain APAC Snack Bar Market Revenue (Million) Forecast, by Application 2019 & 2032
- Table 26: Spain APAC Snack Bar Market Volume (K Tons) Forecast, by Application 2019 & 2032
- Table 27: France APAC Snack Bar Market Revenue (Million) Forecast, by Application 2019 & 2032
- Table 28: France APAC Snack Bar Market Volume (K Tons) Forecast, by Application 2019 & 2032
- Table 29: Italy APAC Snack Bar Market Revenue (Million) Forecast, by Application 2019 & 2032
- Table 30: Italy APAC Snack Bar Market Volume (K Tons) Forecast, by Application 2019 & 2032
- Table 31: Russia APAC Snack Bar Market Revenue (Million) Forecast, by Application 2019 & 2032
- Table 32: Russia APAC Snack Bar Market Volume (K Tons) Forecast, by Application 2019 & 2032
- Table 33: Rest of Europe APAC Snack Bar Market Revenue (Million) Forecast, by Application 2019 & 2032
- Table 34: Rest of Europe APAC Snack Bar Market Volume (K Tons) Forecast, by Application 2019 & 2032
- Table 35: Global APAC Snack Bar Market Revenue Million Forecast, by Country 2019 & 2032
- Table 36: Global APAC Snack Bar Market Volume K Tons Forecast, by Country 2019 & 2032
- Table 37: China APAC Snack Bar Market Revenue (Million) Forecast, by Application 2019 & 2032
- Table 38: China APAC Snack Bar Market Volume (K Tons) Forecast, by Application 2019 & 2032
- Table 39: Japan APAC Snack Bar Market Revenue (Million) Forecast, by Application 2019 & 2032
- Table 40: Japan APAC Snack Bar Market Volume (K Tons) Forecast, by Application 2019 & 2032
- Table 41: India APAC Snack Bar Market Revenue (Million) Forecast, by Application 2019 & 2032
- Table 42: India APAC Snack Bar Market Volume (K Tons) Forecast, by Application 2019 & 2032
- Table 43: Australia APAC Snack Bar Market Revenue (Million) Forecast, by Application 2019 & 2032
- Table 44: Australia APAC Snack Bar Market Volume (K Tons) Forecast, by Application 2019 & 2032
- Table 45: Rest of Asia Pacific APAC Snack Bar Market Revenue (Million) Forecast, by Application 2019 & 2032
- Table 46: Rest of Asia Pacific APAC Snack Bar Market Volume (K Tons) Forecast, by Application 2019 & 2032
- Table 47: Global APAC Snack Bar Market Revenue Million Forecast, by Country 2019 & 2032
- Table 48: Global APAC Snack Bar Market Volume K Tons Forecast, by Country 2019 & 2032
- Table 49: Brazil APAC Snack Bar Market Revenue (Million) Forecast, by Application 2019 & 2032
- Table 50: Brazil APAC Snack Bar Market Volume (K Tons) Forecast, by Application 2019 & 2032
- Table 51: Argentina APAC Snack Bar Market Revenue (Million) Forecast, by Application 2019 & 2032
- Table 52: Argentina APAC Snack Bar Market Volume (K Tons) Forecast, by Application 2019 & 2032
- Table 53: Rest of South America APAC Snack Bar Market Revenue (Million) Forecast, by Application 2019 & 2032
- Table 54: Rest of South America APAC Snack Bar Market Volume (K Tons) Forecast, by Application 2019 & 2032
- Table 55: Global APAC Snack Bar Market Revenue Million Forecast, by Country 2019 & 2032
- Table 56: Global APAC Snack Bar Market Volume K Tons Forecast, by Country 2019 & 2032
- Table 57: UAE APAC Snack Bar Market Revenue (Million) Forecast, by Application 2019 & 2032
- Table 58: UAE APAC Snack Bar Market Volume (K Tons) Forecast, by Application 2019 & 2032
- Table 59: South Africa APAC Snack Bar Market Revenue (Million) Forecast, by Application 2019 & 2032
- Table 60: South Africa APAC Snack Bar Market Volume (K Tons) Forecast, by Application 2019 & 2032
- Table 61: Saudi Arabia APAC Snack Bar Market Revenue (Million) Forecast, by Application 2019 & 2032
- Table 62: Saudi Arabia APAC Snack Bar Market Volume (K Tons) Forecast, by Application 2019 & 2032
- Table 63: Rest of MEA APAC Snack Bar Market Revenue (Million) Forecast, by Application 2019 & 2032
- Table 64: Rest of MEA APAC Snack Bar Market Volume (K Tons) Forecast, by Application 2019 & 2032
- Table 65: Global APAC Snack Bar Market Revenue Million Forecast, by Country 2019 & 2032
- Table 66: Global APAC Snack Bar Market Volume K Tons Forecast, by Country 2019 & 2032
- Table 67: South Africa APAC Snack Bar Market Revenue (Million) Forecast, by Application 2019 & 2032
- Table 68: South Africa APAC Snack Bar Market Volume (K Tons) Forecast, by Application 2019 & 2032
- Table 69: Rest of Middle East APAC Snack Bar Market Revenue (Million) Forecast, by Application 2019 & 2032
- Table 70: Rest of Middle East APAC Snack Bar Market Volume (K Tons) Forecast, by Application 2019 & 2032
- Table 71: Global APAC Snack Bar Market Revenue Million Forecast, by Confectionery Variant 2019 & 2032
- Table 72: Global APAC Snack Bar Market Volume K Tons Forecast, by Confectionery Variant 2019 & 2032
- Table 73: Global APAC Snack Bar Market Revenue Million Forecast, by Distribution Channel 2019 & 2032
- Table 74: Global APAC Snack Bar Market Volume K Tons Forecast, by Distribution Channel 2019 & 2032
- Table 75: Global APAC Snack Bar Market Revenue Million Forecast, by Country 2019 & 2032
- Table 76: Global APAC Snack Bar Market Volume K Tons Forecast, by Country 2019 & 2032
- Table 77: United States APAC Snack Bar Market Revenue (Million) Forecast, by Application 2019 & 2032
- Table 78: United States APAC Snack Bar Market Volume (K Tons) Forecast, by Application 2019 & 2032
- Table 79: Canada APAC Snack Bar Market Revenue (Million) Forecast, by Application 2019 & 2032
- Table 80: Canada APAC Snack Bar Market Volume (K Tons) Forecast, by Application 2019 & 2032
- Table 81: Mexico APAC Snack Bar Market Revenue (Million) Forecast, by Application 2019 & 2032
- Table 82: Mexico APAC Snack Bar Market Volume (K Tons) Forecast, by Application 2019 & 2032
- Table 83: Global APAC Snack Bar Market Revenue Million Forecast, by Confectionery Variant 2019 & 2032
- Table 84: Global APAC Snack Bar Market Volume K Tons Forecast, by Confectionery Variant 2019 & 2032
- Table 85: Global APAC Snack Bar Market Revenue Million Forecast, by Distribution Channel 2019 & 2032
- Table 86: Global APAC Snack Bar Market Volume K Tons Forecast, by Distribution Channel 2019 & 2032
- Table 87: Global APAC Snack Bar Market Revenue Million Forecast, by Country 2019 & 2032
- Table 88: Global APAC Snack Bar Market Volume K Tons Forecast, by Country 2019 & 2032
- Table 89: Brazil APAC Snack Bar Market Revenue (Million) Forecast, by Application 2019 & 2032
- Table 90: Brazil APAC Snack Bar Market Volume (K Tons) Forecast, by Application 2019 & 2032
- Table 91: Argentina APAC Snack Bar Market Revenue (Million) Forecast, by Application 2019 & 2032
- Table 92: Argentina APAC Snack Bar Market Volume (K Tons) Forecast, by Application 2019 & 2032
- Table 93: Rest of South America APAC Snack Bar Market Revenue (Million) Forecast, by Application 2019 & 2032
- Table 94: Rest of South America APAC Snack Bar Market Volume (K Tons) Forecast, by Application 2019 & 2032
- Table 95: Global APAC Snack Bar Market Revenue Million Forecast, by Confectionery Variant 2019 & 2032
- Table 96: Global APAC Snack Bar Market Volume K Tons Forecast, by Confectionery Variant 2019 & 2032
- Table 97: Global APAC Snack Bar Market Revenue Million Forecast, by Distribution Channel 2019 & 2032
- Table 98: Global APAC Snack Bar Market Volume K Tons Forecast, by Distribution Channel 2019 & 2032
- Table 99: Global APAC Snack Bar Market Revenue Million Forecast, by Country 2019 & 2032
- Table 100: Global APAC Snack Bar Market Volume K Tons Forecast, by Country 2019 & 2032
- Table 101: United Kingdom APAC Snack Bar Market Revenue (Million) Forecast, by Application 2019 & 2032
- Table 102: United Kingdom APAC Snack Bar Market Volume (K Tons) Forecast, by Application 2019 & 2032
- Table 103: Germany APAC Snack Bar Market Revenue (Million) Forecast, by Application 2019 & 2032
- Table 104: Germany APAC Snack Bar Market Volume (K Tons) Forecast, by Application 2019 & 2032
- Table 105: France APAC Snack Bar Market Revenue (Million) Forecast, by Application 2019 & 2032
- Table 106: France APAC Snack Bar Market Volume (K Tons) Forecast, by Application 2019 & 2032
- Table 107: Italy APAC Snack Bar Market Revenue (Million) Forecast, by Application 2019 & 2032
- Table 108: Italy APAC Snack Bar Market Volume (K Tons) Forecast, by Application 2019 & 2032
- Table 109: Spain APAC Snack Bar Market Revenue (Million) Forecast, by Application 2019 & 2032
- Table 110: Spain APAC Snack Bar Market Volume (K Tons) Forecast, by Application 2019 & 2032
- Table 111: Russia APAC Snack Bar Market Revenue (Million) Forecast, by Application 2019 & 2032
- Table 112: Russia APAC Snack Bar Market Volume (K Tons) Forecast, by Application 2019 & 2032
- Table 113: Benelux APAC Snack Bar Market Revenue (Million) Forecast, by Application 2019 & 2032
- Table 114: Benelux APAC Snack Bar Market Volume (K Tons) Forecast, by Application 2019 & 2032
- Table 115: Nordics APAC Snack Bar Market Revenue (Million) Forecast, by Application 2019 & 2032
- Table 116: Nordics APAC Snack Bar Market Volume (K Tons) Forecast, by Application 2019 & 2032
- Table 117: Rest of Europe APAC Snack Bar Market Revenue (Million) Forecast, by Application 2019 & 2032
- Table 118: Rest of Europe APAC Snack Bar Market Volume (K Tons) Forecast, by Application 2019 & 2032
- Table 119: Global APAC Snack Bar Market Revenue Million Forecast, by Confectionery Variant 2019 & 2032
- Table 120: Global APAC Snack Bar Market Volume K Tons Forecast, by Confectionery Variant 2019 & 2032
- Table 121: Global APAC Snack Bar Market Revenue Million Forecast, by Distribution Channel 2019 & 2032
- Table 122: Global APAC Snack Bar Market Volume K Tons Forecast, by Distribution Channel 2019 & 2032
- Table 123: Global APAC Snack Bar Market Revenue Million Forecast, by Country 2019 & 2032
- Table 124: Global APAC Snack Bar Market Volume K Tons Forecast, by Country 2019 & 2032
- Table 125: Turkey APAC Snack Bar Market Revenue (Million) Forecast, by Application 2019 & 2032
- Table 126: Turkey APAC Snack Bar Market Volume (K Tons) Forecast, by Application 2019 & 2032
- Table 127: Israel APAC Snack Bar Market Revenue (Million) Forecast, by Application 2019 & 2032
- Table 128: Israel APAC Snack Bar Market Volume (K Tons) Forecast, by Application 2019 & 2032
- Table 129: GCC APAC Snack Bar Market Revenue (Million) Forecast, by Application 2019 & 2032
- Table 130: GCC APAC Snack Bar Market Volume (K Tons) Forecast, by Application 2019 & 2032
- Table 131: North Africa APAC Snack Bar Market Revenue (Million) Forecast, by Application 2019 & 2032
- Table 132: North Africa APAC Snack Bar Market Volume (K Tons) Forecast, by Application 2019 & 2032
- Table 133: South Africa APAC Snack Bar Market Revenue (Million) Forecast, by Application 2019 & 2032
- Table 134: South Africa APAC Snack Bar Market Volume (K Tons) Forecast, by Application 2019 & 2032
- Table 135: Rest of Middle East & Africa APAC Snack Bar Market Revenue (Million) Forecast, by Application 2019 & 2032
- Table 136: Rest of Middle East & Africa APAC Snack Bar Market Volume (K Tons) Forecast, by Application 2019 & 2032
- Table 137: Global APAC Snack Bar Market Revenue Million Forecast, by Confectionery Variant 2019 & 2032
- Table 138: Global APAC Snack Bar Market Volume K Tons Forecast, by Confectionery Variant 2019 & 2032
- Table 139: Global APAC Snack Bar Market Revenue Million Forecast, by Distribution Channel 2019 & 2032
- Table 140: Global APAC Snack Bar Market Volume K Tons Forecast, by Distribution Channel 2019 & 2032
- Table 141: Global APAC Snack Bar Market Revenue Million Forecast, by Country 2019 & 2032
- Table 142: Global APAC Snack Bar Market Volume K Tons Forecast, by Country 2019 & 2032
- Table 143: China APAC Snack Bar Market Revenue (Million) Forecast, by Application 2019 & 2032
- Table 144: China APAC Snack Bar Market Volume (K Tons) Forecast, by Application 2019 & 2032
- Table 145: India APAC Snack Bar Market Revenue (Million) Forecast, by Application 2019 & 2032
- Table 146: India APAC Snack Bar Market Volume (K Tons) Forecast, by Application 2019 & 2032
- Table 147: Japan APAC Snack Bar Market Revenue (Million) Forecast, by Application 2019 & 2032
- Table 148: Japan APAC Snack Bar Market Volume (K Tons) Forecast, by Application 2019 & 2032
- Table 149: South Korea APAC Snack Bar Market Revenue (Million) Forecast, by Application 2019 & 2032
- Table 150: South Korea APAC Snack Bar Market Volume (K Tons) Forecast, by Application 2019 & 2032
- Table 151: ASEAN APAC Snack Bar Market Revenue (Million) Forecast, by Application 2019 & 2032
- Table 152: ASEAN APAC Snack Bar Market Volume (K Tons) Forecast, by Application 2019 & 2032
- Table 153: Oceania APAC Snack Bar Market Revenue (Million) Forecast, by Application 2019 & 2032
- Table 154: Oceania APAC Snack Bar Market Volume (K Tons) Forecast, by Application 2019 & 2032
- Table 155: Rest of Asia Pacific APAC Snack Bar Market Revenue (Million) Forecast, by Application 2019 & 2032
- Table 156: Rest of Asia Pacific APAC Snack Bar Market Volume (K Tons) Forecast, by Application 2019 & 2032
Frequently Asked Questions
1. What is the projected Compound Annual Growth Rate (CAGR) of the APAC Snack Bar Market?
The projected CAGR is approximately 4.12%.
2. Which companies are prominent players in the APAC Snack Bar Market?
Key companies in the market include Nestlé SA, Post Holdings Inc, Asahi Group Holdings Ltd, Simply Good Foods Co, General Mills Inc, PepsiCo Inc, Lotus Bakeries, Morinaga & Co Ltd, Bagrrys India Private Limited, Carman's Fine Foods Pty Ltd, Ferrero International SA, Naturell India Pvt Ltd, Mars Incorporated, Otsuka Holdings Co Ltd, Mondelēz International Inc, Amway International Inc, Kellogg Company.
3. What are the main segments of the APAC Snack Bar Market?
The market segments include Confectionery Variant, Distribution Channel.
4. Can you provide details about the market size?
The market size is estimated to be USD 26040 Million as of 2022.
5. What are some drivers contributing to market growth?
Popularity of Convenient and On the Go Snacking Options; Product Differentiation Playing a Key Role in Market Expansion.
6. What are the notable trends driving market growth?
Growing awareness regarding health-oriented products is likely to boost the segment’s sales.
7. Are there any restraints impacting market growth?
Associated Health Risks; Easy Availability of Healthy Substitutes.
8. Can you provide examples of recent developments in the market?
May 2023: Nestle’s Milo launched a protein snack bar offering 6 g of protein and a source of fiber. These protein snack bars retail at USD 8 for 180 g or six bars and are available in Coles and independent grocers across Australia.May 2023: Uncle Tobys unveiled a protein muesli bar in four new flavors. The muesli bar is made with 20% protein, i.e., 7 g of protein per bar, comes in multipacks of 5, and can be found in supermarkets for RRP AUD 6.70. The bars are available in flavors like Caramel and Dark Choc, Raspberry, Goji and White Choc, Lemon with a Yoghurty Drizzle, and Double Choc.March 2023: Bagrrys India Private Limited announced the launch of The Mighty Muesli Bars, which are all-natural, healthy, and packed with multi-grains, nuts, fruits, and honey with a punch of high fiber.
9. What pricing options are available for accessing the report?
Pricing options include single-user, multi-user, and enterprise licenses priced at USD 3800, USD 4500, and USD 5800 respectively.
10. Is the market size provided in terms of value or volume?
The market size is provided in terms of value, measured in Million and volume, measured in K Tons.
11. Are there any specific market keywords associated with the report?
Yes, the market keyword associated with the report is "APAC Snack Bar Market," which aids in identifying and referencing the specific market segment covered.
12. How do I determine which pricing option suits my needs best?
The pricing options vary based on user requirements and access needs. Individual users may opt for single-user licenses, while businesses requiring broader access may choose multi-user or enterprise licenses for cost-effective access to the report.
13. Are there any additional resources or data provided in the APAC Snack Bar Market report?
While the report offers comprehensive insights, it's advisable to review the specific contents or supplementary materials provided to ascertain if additional resources or data are available.
14. How can I stay updated on further developments or reports in the APAC Snack Bar Market?
To stay informed about further developments, trends, and reports in the APAC Snack Bar Market, consider subscribing to industry newsletters, following relevant companies and organizations, or regularly checking reputable industry news sources and publications.
Methodology
Step 1 - Identification of Relevant Samples Size from Population Database


Step 2 - Approaches for Defining Global Market Size (Value, Volume* & Price*)

Note*: In applicable scenarios
Step 3 - Data Sources
Primary Research
- Web Analytics
- Survey Reports
- Research Institute
- Latest Research Reports
- Opinion Leaders
Secondary Research
- Annual Reports
- White Paper
- Latest Press Release
- Industry Association
- Paid Database
- Investor Presentations

Step 4 - Data Triangulation
Involves using different sources of information in order to increase the validity of a study
These sources are likely to be stakeholders in a program - participants, other researchers, program staff, other community members, and so on.
Then we put all data in single framework & apply various statistical tools to find out the dynamic on the market.
During the analysis stage, feedback from the stakeholder groups would be compared to determine areas of agreement as well as areas of divergence


