
Key Insights
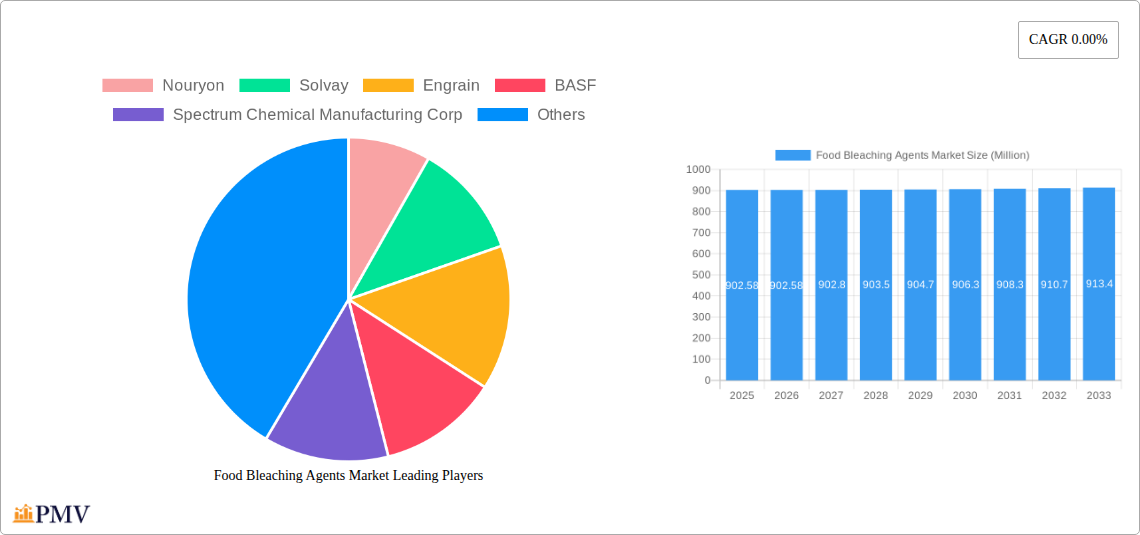
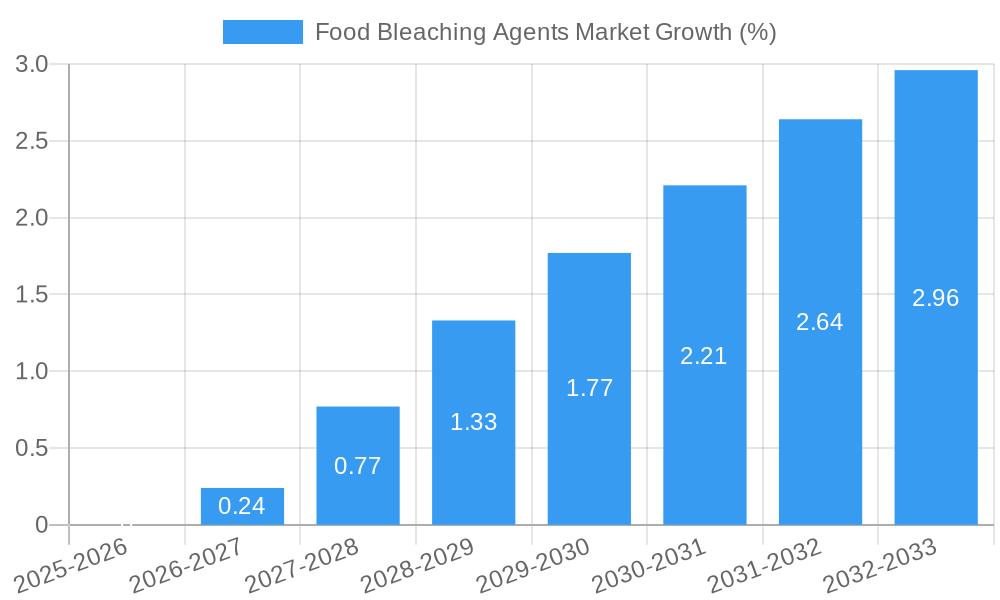
The global food bleaching agents market, valued at $902.58 million in 2025, is characterized by a currently stagnant growth rate (CAGR of 0.00%). However, this seemingly flat growth masks underlying dynamism. The market is segmented by type (Azodicarbonamide, Hydrogen peroxide, Ascorbic acid, Chlorine dioxide, and Others) and application (Bakery products, Flour, Cheese, and Others). While the overall CAGR is currently low, analysis suggests potential future growth driven by several factors. Increasing demand for processed foods, particularly in developing economies within the Asia-Pacific region, is expected to fuel demand for bleaching agents in applications such as flour and bakery products. Furthermore, the ongoing evolution of consumer preferences towards whiter and brighter food products creates a consistent albeit slow market need. However, stringent regulations concerning the use of certain bleaching agents, particularly those with potential health implications, act as a significant restraint. This regulatory landscape leads manufacturers to focus on developing and adopting safer alternatives like hydrogen peroxide and ascorbic acid, reshaping the market's product composition over time. The competitive landscape is shaped by key players such as Nouryon, Solvay, BASF, and others, who are constantly innovating to meet evolving market needs and regulatory standards.
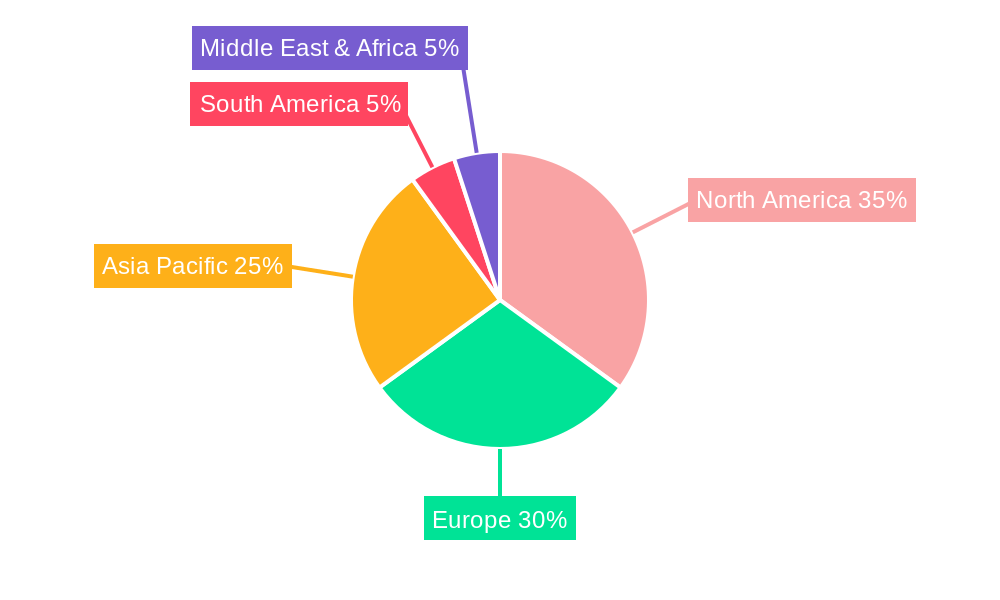
The geographic distribution of the market reflects varying levels of processed food consumption and regulatory frameworks. North America and Europe currently hold significant market shares due to established food processing industries and high per capita consumption. However, rapid growth in emerging economies, particularly within Asia-Pacific, presents a considerable opportunity for expansion in the coming years. The market's future trajectory depends heavily on the balance between growing demand from emerging markets, stringent regulations impacting the use of certain agents, and the successful development and adoption of safer, more sustainable alternatives. Companies focused on innovation and regulatory compliance are best positioned for long-term success within this evolving market.
Food Bleaching Agents Market: Comprehensive Report 2019-2033
This comprehensive report provides a detailed analysis of the global Food Bleaching Agents Market, offering invaluable insights into market dynamics, competitive landscape, and future growth opportunities. Covering the period from 2019 to 2033, with 2025 as the base year, this report is an essential resource for industry stakeholders, investors, and market researchers seeking to understand and capitalize on the evolving Food Bleaching Agents market. The market is projected to reach xx Million by 2033, exhibiting a CAGR of xx% during the forecast period (2025-2033).
Food Bleaching Agents Market Market Structure & Competitive Dynamics
The Food Bleaching Agents market exhibits a moderately consolidated structure, with key players like Nouryon, Solvay, Engrain, BASF, Spectrum Chemical Manufacturing Corp, Aditya Birla Chemicals, Akzonobel, and Evonik holding significant market share. Market concentration is influenced by factors such as economies of scale in production, R&D capabilities, and established distribution networks. The market's innovation ecosystem is driven by ongoing research into safer and more effective bleaching agents, catering to the growing demand for natural and organic food products. Regulatory frameworks, particularly concerning food safety and environmental regulations, significantly impact market dynamics. The market witnesses continuous M&A activity, with deal values fluctuating based on market conditions and strategic objectives. For instance, in 2022, a significant merger between two mid-sized players resulted in a xx Million deal, reshaping the competitive landscape. Product substitutes, such as alternative processing techniques, are emerging, posing a moderate threat to the traditional Food Bleaching Agents market. End-user trends, notably towards healthier and minimally processed foods, are influencing the demand for specific types of bleaching agents.
- Market Concentration: Moderately Consolidated
- Innovation Ecosystem: Active R&D in safer and sustainable agents
- Regulatory Framework: Stringent food safety and environmental regulations
- M&A Activity: Significant activity observed, with deal values varying.
- End-User Trends: Shift towards healthier and natural food products
- Product Substitutes: Emerging alternative processing methods
Food Bleaching Agents Market Industry Trends & Insights
The Food Bleaching Agents market is experiencing robust growth, driven by the increasing demand for processed foods globally. The rising consumer preference for aesthetically appealing food products, along with the functional benefits provided by bleaching agents in extending shelf life and improving texture, are key market growth drivers. Technological advancements in bleaching agent production, including improved efficiency and reduced environmental impact, are further fueling market expansion. However, the growing awareness of potential health concerns associated with certain bleaching agents is influencing consumer choices and prompting the market to focus on safer alternatives. This shift is reflected in the increasing adoption of natural bleaching agents such as ascorbic acid. Competitive dynamics are characterized by intense competition among established players and emerging entrants, leading to pricing pressures and innovation-driven differentiation. The market penetration of natural bleaching agents is increasing at a CAGR of xx%, while the overall market exhibits a CAGR of xx%.
Dominant Markets & Segments in Food Bleaching Agents Market
The North American region currently holds the largest market share, primarily due to its robust processed food industry and high per capita consumption. Within the type segments, hydrogen peroxide is the dominant bleaching agent, owing to its wide applicability and relatively low cost. However, the ascorbic acid segment is witnessing the fastest growth, driven by rising consumer demand for natural food products. In terms of application, the bakery products segment accounts for the largest market share, followed by flour. The cheese segment is a relatively smaller yet growing segment.
- Key Drivers for North American Dominance: Large processed food industry, high consumer spending
- Hydrogen Peroxide Dominance: Wide application, cost-effectiveness
- Ascorbic Acid Segment Growth: Driven by consumer preference for natural alternatives
- Bakery Products Segment Dominance: High volume of processed bakery products
Food Bleaching Agents Market Product Innovations
Recent innovations focus on developing environmentally friendly and health-conscious food bleaching agents. Companies are investing in technologies that minimize the use of harsh chemicals, reducing the environmental footprint and enhancing food safety. The market is also witnessing the development of new formulations with improved bleaching efficacy and better compatibility with various food products. These advancements cater to the growing demand for natural and clean-label products, providing a competitive edge to manufacturers.
Report Segmentation & Scope
The report segments the Food Bleaching Agents market by Type (Azodicarbonamide, Hydrogen peroxide, Ascorbic acid, Chlorine dioxide, Others) and by Application (Bakery products, Flour, Cheese, Others). Each segment’s growth projection and market size are analyzed, along with competitive dynamics. The "Others" segments in both type and application encompass a variety of niche products and applications that are continuously evolving. Market size and growth projections for these segments are estimates based on current market trends and industry projections. The competitive landscape for each segment varies depending on the technological advancements, consumer preferences, and regulatory factors within each area.
Key Drivers of Food Bleaching Agents Market Growth
Several factors propel the Food Bleaching Agents market's growth. The expansion of the global processed food industry, growing consumer preference for aesthetically pleasing food products, and technological advancements in bleaching agent production are major contributors. Stringent food safety regulations also necessitate the use of approved bleaching agents, increasing demand. Moreover, the rise of convenience foods and longer shelf-life expectations drive the need for effective preservation techniques involving bleaching agents.
Challenges in the Food Bleaching Agents Market Sector
The market faces challenges like stringent regulatory scrutiny concerning the safety and environmental impact of certain bleaching agents. Supply chain disruptions and fluctuations in raw material prices also impact profitability. Furthermore, intense competition among established players and the emergence of alternative technologies present hurdles to market growth. The xx Million loss incurred by a major player in 2024 due to a recall highlights the potential impact of regulatory issues.
Leading Players in the Food Bleaching Agents Market Market
- Nouryon
- Solvay
- Engrain
- BASF
- Spectrum Chemical Manufacturing Corp
- Aditya Birla Chemicals
- Akzonobel
- Evonik
Key Developments in Food Bleaching Agents Market Sector
- January 2023: Nouryon launched a new, sustainable hydrogen peroxide bleaching agent.
- June 2022: Solvay acquired a smaller bleaching agent manufacturer, expanding its market share.
- October 2021: BASF invested in R&D for natural bleaching agents.
Strategic Food Bleaching Agents Market Market Outlook
The Food Bleaching Agents market presents significant growth potential, driven by the expanding processed food industry and evolving consumer preferences. Strategic opportunities lie in developing sustainable and natural bleaching agents, focusing on innovation and expanding into emerging markets. Companies with a strong focus on R&D, sustainable practices, and effective marketing strategies are well-positioned to succeed in this dynamic market. The market is projected to witness strong growth in the coming years, particularly in regions with a growing middle class and rising demand for processed foods.
Food Bleaching Agents Market Segmentation
-
1. Type
- 1.1. Azodicarbonamide
- 1.2. Hydrogen peroxide
- 1.3. Ascorbic acid
- 1.4. Chlorine dioxide
- 1.5. Others
-
2. Application
- 2.1. Bakery products
- 2.2. Flour
- 2.3. Cheese
- 2.4. Others
Food Bleaching Agents Market Segmentation By Geography
-
1. North America
- 1.1. United States
- 1.2. Canada
- 1.3. Mexico
- 1.4. Rest of North America
-
2. Europe
- 2.1. United Kingdom
- 2.2. Germany
- 2.3. France
- 2.4. Russia
- 2.5. Italy
- 2.6. Spain
- 2.7. Rest of Europe
-
3. Asia Pacific
- 3.1. India
- 3.2. China
- 3.3. Japan
- 3.4. Australia
- 3.5. Rest of Asia Pacific
-
4. South America
- 4.1. Brazil
- 4.2. Argentina
- 4.3. Rest of South America
- 5. Middle East
-
6. South Africa
- 6.1. Saudi Arabia
- 6.2. Rest of MEA
Food Bleaching Agents Market REPORT HIGHLIGHTS
| Aspects | Details |
|---|---|
| Study Period | 2019-2033 |
| Base Year | 2024 |
| Estimated Year | 2025 |
| Forecast Period | 2025-2033 |
| Historical Period | 2019-2024 |
| Growth Rate | CAGR of 0.00% from 2019-2033 |
| Segmentation |
|
Table of Contents
- 1. Introduction
- 1.1. Research Scope
- 1.2. Market Segmentation
- 1.3. Research Methodology
- 1.4. Definitions and Assumptions
- 2. Executive Summary
- 2.1. Introduction
- 3. Market Dynamics
- 3.1. Introduction
- 3.2. Market Drivers
- 3.2.1. Awareness of Health Benefits Associated with Tocotrienol; Escalating Demand for Anti-Aging Products Containing Tocotrienol
- 3.3. Market Restrains
- 3.3.1. Availability of Substitutes
- 3.4. Market Trends
- 3.4.1. Growing Demand for Functional Flours
- 4. Market Factor Analysis
- 4.1. Porters Five Forces
- 4.2. Supply/Value Chain
- 4.3. PESTEL analysis
- 4.4. Market Entropy
- 4.5. Patent/Trademark Analysis
- 5. Global Food Bleaching Agents Market Analysis, Insights and Forecast, 2019-2031
- 5.1. Market Analysis, Insights and Forecast - by Type
- 5.1.1. Azodicarbonamide
- 5.1.2. Hydrogen peroxide
- 5.1.3. Ascorbic acid
- 5.1.4. Chlorine dioxide
- 5.1.5. Others
- 5.2. Market Analysis, Insights and Forecast - by Application
- 5.2.1. Bakery products
- 5.2.2. Flour
- 5.2.3. Cheese
- 5.2.4. Others
- 5.3. Market Analysis, Insights and Forecast - by Region
- 5.3.1. North America
- 5.3.2. Europe
- 5.3.3. Asia Pacific
- 5.3.4. South America
- 5.3.5. Middle East
- 5.3.6. South Africa
- 5.1. Market Analysis, Insights and Forecast - by Type
- 6. North America Food Bleaching Agents Market Analysis, Insights and Forecast, 2019-2031
- 6.1. Market Analysis, Insights and Forecast - by Type
- 6.1.1. Azodicarbonamide
- 6.1.2. Hydrogen peroxide
- 6.1.3. Ascorbic acid
- 6.1.4. Chlorine dioxide
- 6.1.5. Others
- 6.2. Market Analysis, Insights and Forecast - by Application
- 6.2.1. Bakery products
- 6.2.2. Flour
- 6.2.3. Cheese
- 6.2.4. Others
- 6.1. Market Analysis, Insights and Forecast - by Type
- 7. Europe Food Bleaching Agents Market Analysis, Insights and Forecast, 2019-2031
- 7.1. Market Analysis, Insights and Forecast - by Type
- 7.1.1. Azodicarbonamide
- 7.1.2. Hydrogen peroxide
- 7.1.3. Ascorbic acid
- 7.1.4. Chlorine dioxide
- 7.1.5. Others
- 7.2. Market Analysis, Insights and Forecast - by Application
- 7.2.1. Bakery products
- 7.2.2. Flour
- 7.2.3. Cheese
- 7.2.4. Others
- 7.1. Market Analysis, Insights and Forecast - by Type
- 8. Asia Pacific Food Bleaching Agents Market Analysis, Insights and Forecast, 2019-2031
- 8.1. Market Analysis, Insights and Forecast - by Type
- 8.1.1. Azodicarbonamide
- 8.1.2. Hydrogen peroxide
- 8.1.3. Ascorbic acid
- 8.1.4. Chlorine dioxide
- 8.1.5. Others
- 8.2. Market Analysis, Insights and Forecast - by Application
- 8.2.1. Bakery products
- 8.2.2. Flour
- 8.2.3. Cheese
- 8.2.4. Others
- 8.1. Market Analysis, Insights and Forecast - by Type
- 9. South America Food Bleaching Agents Market Analysis, Insights and Forecast, 2019-2031
- 9.1. Market Analysis, Insights and Forecast - by Type
- 9.1.1. Azodicarbonamide
- 9.1.2. Hydrogen peroxide
- 9.1.3. Ascorbic acid
- 9.1.4. Chlorine dioxide
- 9.1.5. Others
- 9.2. Market Analysis, Insights and Forecast - by Application
- 9.2.1. Bakery products
- 9.2.2. Flour
- 9.2.3. Cheese
- 9.2.4. Others
- 9.1. Market Analysis, Insights and Forecast - by Type
- 10. Middle East Food Bleaching Agents Market Analysis, Insights and Forecast, 2019-2031
- 10.1. Market Analysis, Insights and Forecast - by Type
- 10.1.1. Azodicarbonamide
- 10.1.2. Hydrogen peroxide
- 10.1.3. Ascorbic acid
- 10.1.4. Chlorine dioxide
- 10.1.5. Others
- 10.2. Market Analysis, Insights and Forecast - by Application
- 10.2.1. Bakery products
- 10.2.2. Flour
- 10.2.3. Cheese
- 10.2.4. Others
- 10.1. Market Analysis, Insights and Forecast - by Type
- 11. South Africa Food Bleaching Agents Market Analysis, Insights and Forecast, 2019-2031
- 11.1. Market Analysis, Insights and Forecast - by Type
- 11.1.1. Azodicarbonamide
- 11.1.2. Hydrogen peroxide
- 11.1.3. Ascorbic acid
- 11.1.4. Chlorine dioxide
- 11.1.5. Others
- 11.2. Market Analysis, Insights and Forecast - by Application
- 11.2.1. Bakery products
- 11.2.2. Flour
- 11.2.3. Cheese
- 11.2.4. Others
- 11.1. Market Analysis, Insights and Forecast - by Type
- 12. North America Food Bleaching Agents Market Analysis, Insights and Forecast, 2019-2031
- 12.1. Market Analysis, Insights and Forecast - By Country/Sub-region
- 12.1.1 United States
- 12.1.2 Canada
- 12.1.3 Mexico
- 12.1.4 Rest of North America
- 13. Europe Food Bleaching Agents Market Analysis, Insights and Forecast, 2019-2031
- 13.1. Market Analysis, Insights and Forecast - By Country/Sub-region
- 13.1.1 United Kingdom
- 13.1.2 Germany
- 13.1.3 France
- 13.1.4 Russia
- 13.1.5 Italy
- 13.1.6 Spain
- 13.1.7 Rest of Europe
- 14. Asia Pacific Food Bleaching Agents Market Analysis, Insights and Forecast, 2019-2031
- 14.1. Market Analysis, Insights and Forecast - By Country/Sub-region
- 14.1.1 India
- 14.1.2 China
- 14.1.3 Japan
- 14.1.4 Australia
- 14.1.5 Rest of Asia Pacific
- 15. South America Food Bleaching Agents Market Analysis, Insights and Forecast, 2019-2031
- 15.1. Market Analysis, Insights and Forecast - By Country/Sub-region
- 15.1.1 Brazil
- 15.1.2 Argentina
- 15.1.3 Rest of South America
- 16. Middle East Food Bleaching Agents Market Analysis, Insights and Forecast, 2019-2031
- 16.1. Market Analysis, Insights and Forecast - By Country/Sub-region
- 16.1.1.
- 17. South Africa Food Bleaching Agents Market Analysis, Insights and Forecast, 2019-2031
- 17.1. Market Analysis, Insights and Forecast - By Country/Sub-region
- 17.1.1 Saudi Arabia
- 17.1.2 Rest of MEA
- 18. Competitive Analysis
- 18.1. Global Market Share Analysis 2024
- 18.2. Company Profiles
- 18.2.1 Nouryon
- 18.2.1.1. Overview
- 18.2.1.2. Products
- 18.2.1.3. SWOT Analysis
- 18.2.1.4. Recent Developments
- 18.2.1.5. Financials (Based on Availability)
- 18.2.2 Solvay
- 18.2.2.1. Overview
- 18.2.2.2. Products
- 18.2.2.3. SWOT Analysis
- 18.2.2.4. Recent Developments
- 18.2.2.5. Financials (Based on Availability)
- 18.2.3 Engrain
- 18.2.3.1. Overview
- 18.2.3.2. Products
- 18.2.3.3. SWOT Analysis
- 18.2.3.4. Recent Developments
- 18.2.3.5. Financials (Based on Availability)
- 18.2.4 BASF
- 18.2.4.1. Overview
- 18.2.4.2. Products
- 18.2.4.3. SWOT Analysis
- 18.2.4.4. Recent Developments
- 18.2.4.5. Financials (Based on Availability)
- 18.2.5 Spectrum Chemical Manufacturing Corp
- 18.2.5.1. Overview
- 18.2.5.2. Products
- 18.2.5.3. SWOT Analysis
- 18.2.5.4. Recent Developments
- 18.2.5.5. Financials (Based on Availability)
- 18.2.6 Aditya Birla Chemicals
- 18.2.6.1. Overview
- 18.2.6.2. Products
- 18.2.6.3. SWOT Analysis
- 18.2.6.4. Recent Developments
- 18.2.6.5. Financials (Based on Availability)
- 18.2.7 Akzonobel*List Not Exhaustive
- 18.2.7.1. Overview
- 18.2.7.2. Products
- 18.2.7.3. SWOT Analysis
- 18.2.7.4. Recent Developments
- 18.2.7.5. Financials (Based on Availability)
- 18.2.8 Evonik
- 18.2.8.1. Overview
- 18.2.8.2. Products
- 18.2.8.3. SWOT Analysis
- 18.2.8.4. Recent Developments
- 18.2.8.5. Financials (Based on Availability)
- 18.2.1 Nouryon
List of Figures
- Figure 1: Global Food Bleaching Agents Market Revenue Breakdown (Million, %) by Region 2024 & 2032
- Figure 2: North America Food Bleaching Agents Market Revenue (Million), by Country 2024 & 2032
- Figure 3: North America Food Bleaching Agents Market Revenue Share (%), by Country 2024 & 2032
- Figure 4: Europe Food Bleaching Agents Market Revenue (Million), by Country 2024 & 2032
- Figure 5: Europe Food Bleaching Agents Market Revenue Share (%), by Country 2024 & 2032
- Figure 6: Asia Pacific Food Bleaching Agents Market Revenue (Million), by Country 2024 & 2032
- Figure 7: Asia Pacific Food Bleaching Agents Market Revenue Share (%), by Country 2024 & 2032
- Figure 8: South America Food Bleaching Agents Market Revenue (Million), by Country 2024 & 2032
- Figure 9: South America Food Bleaching Agents Market Revenue Share (%), by Country 2024 & 2032
- Figure 10: Middle East Food Bleaching Agents Market Revenue (Million), by Country 2024 & 2032
- Figure 11: Middle East Food Bleaching Agents Market Revenue Share (%), by Country 2024 & 2032
- Figure 12: South Africa Food Bleaching Agents Market Revenue (Million), by Country 2024 & 2032
- Figure 13: South Africa Food Bleaching Agents Market Revenue Share (%), by Country 2024 & 2032
- Figure 14: North America Food Bleaching Agents Market Revenue (Million), by Type 2024 & 2032
- Figure 15: North America Food Bleaching Agents Market Revenue Share (%), by Type 2024 & 2032
- Figure 16: North America Food Bleaching Agents Market Revenue (Million), by Application 2024 & 2032
- Figure 17: North America Food Bleaching Agents Market Revenue Share (%), by Application 2024 & 2032
- Figure 18: North America Food Bleaching Agents Market Revenue (Million), by Country 2024 & 2032
- Figure 19: North America Food Bleaching Agents Market Revenue Share (%), by Country 2024 & 2032
- Figure 20: Europe Food Bleaching Agents Market Revenue (Million), by Type 2024 & 2032
- Figure 21: Europe Food Bleaching Agents Market Revenue Share (%), by Type 2024 & 2032
- Figure 22: Europe Food Bleaching Agents Market Revenue (Million), by Application 2024 & 2032
- Figure 23: Europe Food Bleaching Agents Market Revenue Share (%), by Application 2024 & 2032
- Figure 24: Europe Food Bleaching Agents Market Revenue (Million), by Country 2024 & 2032
- Figure 25: Europe Food Bleaching Agents Market Revenue Share (%), by Country 2024 & 2032
- Figure 26: Asia Pacific Food Bleaching Agents Market Revenue (Million), by Type 2024 & 2032
- Figure 27: Asia Pacific Food Bleaching Agents Market Revenue Share (%), by Type 2024 & 2032
- Figure 28: Asia Pacific Food Bleaching Agents Market Revenue (Million), by Application 2024 & 2032
- Figure 29: Asia Pacific Food Bleaching Agents Market Revenue Share (%), by Application 2024 & 2032
- Figure 30: Asia Pacific Food Bleaching Agents Market Revenue (Million), by Country 2024 & 2032
- Figure 31: Asia Pacific Food Bleaching Agents Market Revenue Share (%), by Country 2024 & 2032
- Figure 32: South America Food Bleaching Agents Market Revenue (Million), by Type 2024 & 2032
- Figure 33: South America Food Bleaching Agents Market Revenue Share (%), by Type 2024 & 2032
- Figure 34: South America Food Bleaching Agents Market Revenue (Million), by Application 2024 & 2032
- Figure 35: South America Food Bleaching Agents Market Revenue Share (%), by Application 2024 & 2032
- Figure 36: South America Food Bleaching Agents Market Revenue (Million), by Country 2024 & 2032
- Figure 37: South America Food Bleaching Agents Market Revenue Share (%), by Country 2024 & 2032
- Figure 38: Middle East Food Bleaching Agents Market Revenue (Million), by Type 2024 & 2032
- Figure 39: Middle East Food Bleaching Agents Market Revenue Share (%), by Type 2024 & 2032
- Figure 40: Middle East Food Bleaching Agents Market Revenue (Million), by Application 2024 & 2032
- Figure 41: Middle East Food Bleaching Agents Market Revenue Share (%), by Application 2024 & 2032
- Figure 42: Middle East Food Bleaching Agents Market Revenue (Million), by Country 2024 & 2032
- Figure 43: Middle East Food Bleaching Agents Market Revenue Share (%), by Country 2024 & 2032
- Figure 44: South Africa Food Bleaching Agents Market Revenue (Million), by Type 2024 & 2032
- Figure 45: South Africa Food Bleaching Agents Market Revenue Share (%), by Type 2024 & 2032
- Figure 46: South Africa Food Bleaching Agents Market Revenue (Million), by Application 2024 & 2032
- Figure 47: South Africa Food Bleaching Agents Market Revenue Share (%), by Application 2024 & 2032
- Figure 48: South Africa Food Bleaching Agents Market Revenue (Million), by Country 2024 & 2032
- Figure 49: South Africa Food Bleaching Agents Market Revenue Share (%), by Country 2024 & 2032
List of Tables
- Table 1: Global Food Bleaching Agents Market Revenue Million Forecast, by Region 2019 & 2032
- Table 2: Global Food Bleaching Agents Market Revenue Million Forecast, by Type 2019 & 2032
- Table 3: Global Food Bleaching Agents Market Revenue Million Forecast, by Application 2019 & 2032
- Table 4: Global Food Bleaching Agents Market Revenue Million Forecast, by Region 2019 & 2032
- Table 5: Global Food Bleaching Agents Market Revenue Million Forecast, by Country 2019 & 2032
- Table 6: United States Food Bleaching Agents Market Revenue (Million) Forecast, by Application 2019 & 2032
- Table 7: Canada Food Bleaching Agents Market Revenue (Million) Forecast, by Application 2019 & 2032
- Table 8: Mexico Food Bleaching Agents Market Revenue (Million) Forecast, by Application 2019 & 2032
- Table 9: Rest of North America Food Bleaching Agents Market Revenue (Million) Forecast, by Application 2019 & 2032
- Table 10: Global Food Bleaching Agents Market Revenue Million Forecast, by Country 2019 & 2032
- Table 11: United Kingdom Food Bleaching Agents Market Revenue (Million) Forecast, by Application 2019 & 2032
- Table 12: Germany Food Bleaching Agents Market Revenue (Million) Forecast, by Application 2019 & 2032
- Table 13: France Food Bleaching Agents Market Revenue (Million) Forecast, by Application 2019 & 2032
- Table 14: Russia Food Bleaching Agents Market Revenue (Million) Forecast, by Application 2019 & 2032
- Table 15: Italy Food Bleaching Agents Market Revenue (Million) Forecast, by Application 2019 & 2032
- Table 16: Spain Food Bleaching Agents Market Revenue (Million) Forecast, by Application 2019 & 2032
- Table 17: Rest of Europe Food Bleaching Agents Market Revenue (Million) Forecast, by Application 2019 & 2032
- Table 18: Global Food Bleaching Agents Market Revenue Million Forecast, by Country 2019 & 2032
- Table 19: India Food Bleaching Agents Market Revenue (Million) Forecast, by Application 2019 & 2032
- Table 20: China Food Bleaching Agents Market Revenue (Million) Forecast, by Application 2019 & 2032
- Table 21: Japan Food Bleaching Agents Market Revenue (Million) Forecast, by Application 2019 & 2032
- Table 22: Australia Food Bleaching Agents Market Revenue (Million) Forecast, by Application 2019 & 2032
- Table 23: Rest of Asia Pacific Food Bleaching Agents Market Revenue (Million) Forecast, by Application 2019 & 2032
- Table 24: Global Food Bleaching Agents Market Revenue Million Forecast, by Country 2019 & 2032
- Table 25: Brazil Food Bleaching Agents Market Revenue (Million) Forecast, by Application 2019 & 2032
- Table 26: Argentina Food Bleaching Agents Market Revenue (Million) Forecast, by Application 2019 & 2032
- Table 27: Rest of South America Food Bleaching Agents Market Revenue (Million) Forecast, by Application 2019 & 2032
- Table 28: Global Food Bleaching Agents Market Revenue Million Forecast, by Country 2019 & 2032
- Table 29: Food Bleaching Agents Market Revenue (Million) Forecast, by Application 2019 & 2032
- Table 30: Global Food Bleaching Agents Market Revenue Million Forecast, by Country 2019 & 2032
- Table 31: Saudi Arabia Food Bleaching Agents Market Revenue (Million) Forecast, by Application 2019 & 2032
- Table 32: Rest of MEA Food Bleaching Agents Market Revenue (Million) Forecast, by Application 2019 & 2032
- Table 33: Global Food Bleaching Agents Market Revenue Million Forecast, by Type 2019 & 2032
- Table 34: Global Food Bleaching Agents Market Revenue Million Forecast, by Application 2019 & 2032
- Table 35: Global Food Bleaching Agents Market Revenue Million Forecast, by Country 2019 & 2032
- Table 36: United States Food Bleaching Agents Market Revenue (Million) Forecast, by Application 2019 & 2032
- Table 37: Canada Food Bleaching Agents Market Revenue (Million) Forecast, by Application 2019 & 2032
- Table 38: Mexico Food Bleaching Agents Market Revenue (Million) Forecast, by Application 2019 & 2032
- Table 39: Rest of North America Food Bleaching Agents Market Revenue (Million) Forecast, by Application 2019 & 2032
- Table 40: Global Food Bleaching Agents Market Revenue Million Forecast, by Type 2019 & 2032
- Table 41: Global Food Bleaching Agents Market Revenue Million Forecast, by Application 2019 & 2032
- Table 42: Global Food Bleaching Agents Market Revenue Million Forecast, by Country 2019 & 2032
- Table 43: United Kingdom Food Bleaching Agents Market Revenue (Million) Forecast, by Application 2019 & 2032
- Table 44: Germany Food Bleaching Agents Market Revenue (Million) Forecast, by Application 2019 & 2032
- Table 45: France Food Bleaching Agents Market Revenue (Million) Forecast, by Application 2019 & 2032
- Table 46: Russia Food Bleaching Agents Market Revenue (Million) Forecast, by Application 2019 & 2032
- Table 47: Italy Food Bleaching Agents Market Revenue (Million) Forecast, by Application 2019 & 2032
- Table 48: Spain Food Bleaching Agents Market Revenue (Million) Forecast, by Application 2019 & 2032
- Table 49: Rest of Europe Food Bleaching Agents Market Revenue (Million) Forecast, by Application 2019 & 2032
- Table 50: Global Food Bleaching Agents Market Revenue Million Forecast, by Type 2019 & 2032
- Table 51: Global Food Bleaching Agents Market Revenue Million Forecast, by Application 2019 & 2032
- Table 52: Global Food Bleaching Agents Market Revenue Million Forecast, by Country 2019 & 2032
- Table 53: India Food Bleaching Agents Market Revenue (Million) Forecast, by Application 2019 & 2032
- Table 54: China Food Bleaching Agents Market Revenue (Million) Forecast, by Application 2019 & 2032
- Table 55: Japan Food Bleaching Agents Market Revenue (Million) Forecast, by Application 2019 & 2032
- Table 56: Australia Food Bleaching Agents Market Revenue (Million) Forecast, by Application 2019 & 2032
- Table 57: Rest of Asia Pacific Food Bleaching Agents Market Revenue (Million) Forecast, by Application 2019 & 2032
- Table 58: Global Food Bleaching Agents Market Revenue Million Forecast, by Type 2019 & 2032
- Table 59: Global Food Bleaching Agents Market Revenue Million Forecast, by Application 2019 & 2032
- Table 60: Global Food Bleaching Agents Market Revenue Million Forecast, by Country 2019 & 2032
- Table 61: Brazil Food Bleaching Agents Market Revenue (Million) Forecast, by Application 2019 & 2032
- Table 62: Argentina Food Bleaching Agents Market Revenue (Million) Forecast, by Application 2019 & 2032
- Table 63: Rest of South America Food Bleaching Agents Market Revenue (Million) Forecast, by Application 2019 & 2032
- Table 64: Global Food Bleaching Agents Market Revenue Million Forecast, by Type 2019 & 2032
- Table 65: Global Food Bleaching Agents Market Revenue Million Forecast, by Application 2019 & 2032
- Table 66: Global Food Bleaching Agents Market Revenue Million Forecast, by Country 2019 & 2032
- Table 67: Global Food Bleaching Agents Market Revenue Million Forecast, by Type 2019 & 2032
- Table 68: Global Food Bleaching Agents Market Revenue Million Forecast, by Application 2019 & 2032
- Table 69: Global Food Bleaching Agents Market Revenue Million Forecast, by Country 2019 & 2032
- Table 70: Saudi Arabia Food Bleaching Agents Market Revenue (Million) Forecast, by Application 2019 & 2032
- Table 71: Rest of MEA Food Bleaching Agents Market Revenue (Million) Forecast, by Application 2019 & 2032
Frequently Asked Questions
1. What is the projected Compound Annual Growth Rate (CAGR) of the Food Bleaching Agents Market?
The projected CAGR is approximately 0.00%.
2. Which companies are prominent players in the Food Bleaching Agents Market?
Key companies in the market include Nouryon, Solvay, Engrain, BASF, Spectrum Chemical Manufacturing Corp, Aditya Birla Chemicals, Akzonobel*List Not Exhaustive, Evonik.
3. What are the main segments of the Food Bleaching Agents Market?
The market segments include Type, Application.
4. Can you provide details about the market size?
The market size is estimated to be USD 902.58 Million as of 2022.
5. What are some drivers contributing to market growth?
Awareness of Health Benefits Associated with Tocotrienol; Escalating Demand for Anti-Aging Products Containing Tocotrienol.
6. What are the notable trends driving market growth?
Growing Demand for Functional Flours.
7. Are there any restraints impacting market growth?
Availability of Substitutes.
8. Can you provide examples of recent developments in the market?
N/A
9. What pricing options are available for accessing the report?
Pricing options include single-user, multi-user, and enterprise licenses priced at USD 4750, USD 5250, and USD 8750 respectively.
10. Is the market size provided in terms of value or volume?
The market size is provided in terms of value, measured in Million.
11. Are there any specific market keywords associated with the report?
Yes, the market keyword associated with the report is "Food Bleaching Agents Market," which aids in identifying and referencing the specific market segment covered.
12. How do I determine which pricing option suits my needs best?
The pricing options vary based on user requirements and access needs. Individual users may opt for single-user licenses, while businesses requiring broader access may choose multi-user or enterprise licenses for cost-effective access to the report.
13. Are there any additional resources or data provided in the Food Bleaching Agents Market report?
While the report offers comprehensive insights, it's advisable to review the specific contents or supplementary materials provided to ascertain if additional resources or data are available.
14. How can I stay updated on further developments or reports in the Food Bleaching Agents Market?
To stay informed about further developments, trends, and reports in the Food Bleaching Agents Market, consider subscribing to industry newsletters, following relevant companies and organizations, or regularly checking reputable industry news sources and publications.
Methodology
Step 1 - Identification of Relevant Samples Size from Population Database


Step 2 - Approaches for Defining Global Market Size (Value, Volume* & Price*)

Note*: In applicable scenarios
Step 3 - Data Sources
Primary Research
- Web Analytics
- Survey Reports
- Research Institute
- Latest Research Reports
- Opinion Leaders
Secondary Research
- Annual Reports
- White Paper
- Latest Press Release
- Industry Association
- Paid Database
- Investor Presentations

Step 4 - Data Triangulation
Involves using different sources of information in order to increase the validity of a study
These sources are likely to be stakeholders in a program - participants, other researchers, program staff, other community members, and so on.
Then we put all data in single framework & apply various statistical tools to find out the dynamic on the market.
During the analysis stage, feedback from the stakeholder groups would be compared to determine areas of agreement as well as areas of divergence


