
Key Insights
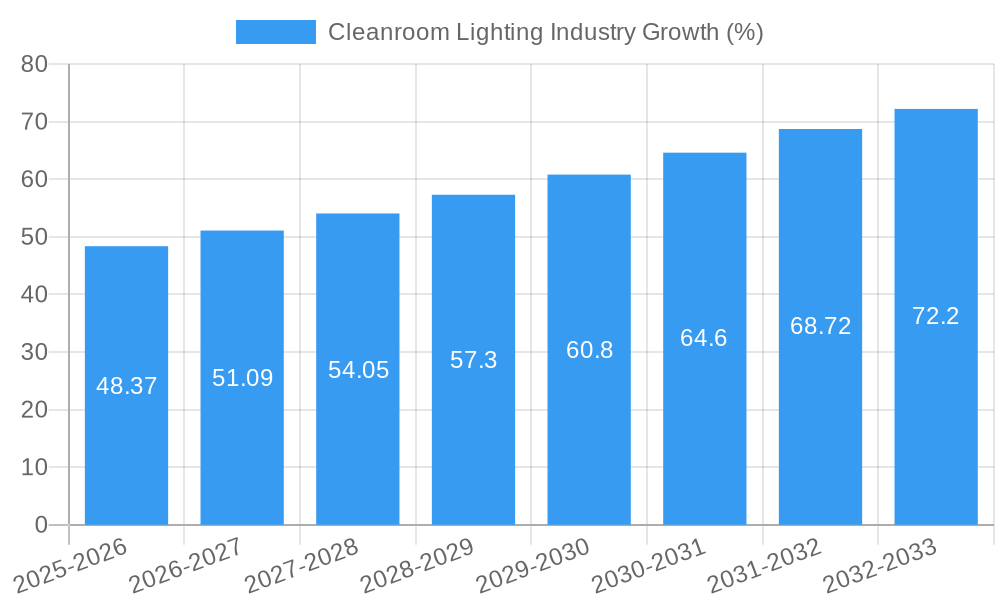
The cleanroom lighting market, valued at $0.84 billion in 2025, is projected to experience robust growth, driven by increasing demand across various sectors. The compound annual growth rate (CAGR) of 5.49% from 2025 to 2033 indicates a significant expansion, fueled by several key factors. The rising adoption of LED technology offers superior energy efficiency and longer lifespan compared to traditional fluorescent lighting, making it a compelling choice for cleanroom environments where energy conservation and minimal maintenance are critical. Furthermore, the stringent hygiene and contamination control requirements in sectors like healthcare, pharmaceuticals, and electronics are propelling the demand for specialized cleanroom lighting solutions. Growth is also being driven by the increasing automation in manufacturing processes, leading to more advanced lighting control systems. While challenges exist, such as the relatively higher initial investment for advanced lighting systems and potential supply chain disruptions, the long-term benefits in terms of energy savings, improved productivity, and reduced maintenance costs outweigh these concerns, making the market poised for consistent expansion.
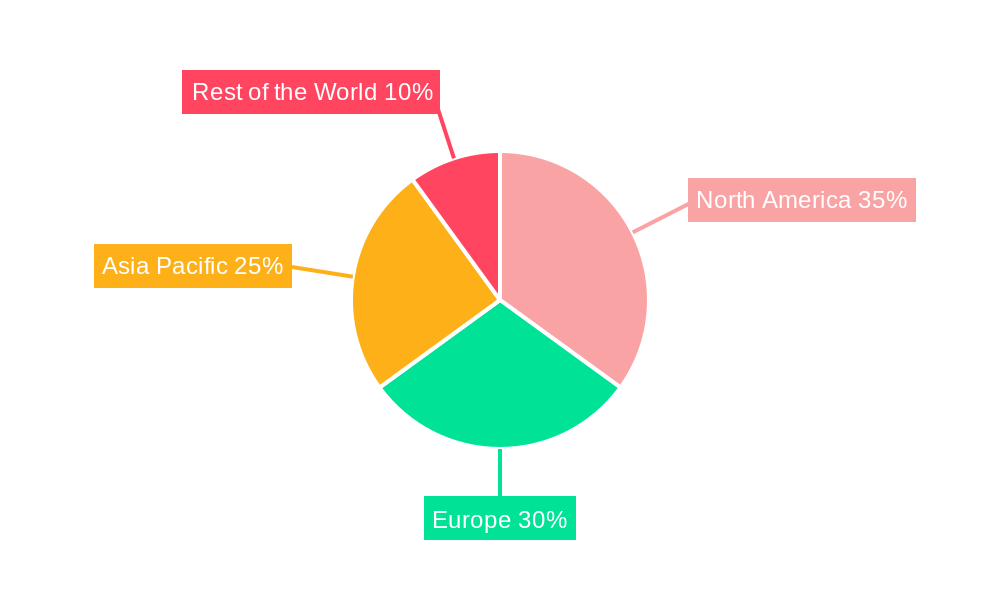
The market segmentation reveals key trends. The LED lighting segment dominates due to its superior energy efficiency and longer lifespan. Recessed mounting types are favored for maintaining a clean and streamlined environment, while surface mount options provide flexibility for retrofitting existing facilities. Healthcare & Life Sciences currently leads the end-user industry segment, followed by the Electronics and Semiconductor industry, reflecting the critical need for controlled environments in these sectors. North America and Europe are currently major markets, but the Asia-Pacific region is expected to witness significant growth due to increasing industrialization and investment in advanced manufacturing facilities. The competitive landscape is characterized by both established players like Signify and Eaton, and specialized cleanroom lighting providers, indicating a diverse and dynamic market with opportunities for both large corporations and niche players. The continued advancement in lighting technology, such as the integration of smart sensors and IoT capabilities, is anticipated to further drive market expansion in the coming years.
Cleanroom Lighting Industry Market Report: 2019-2033
This comprehensive report provides an in-depth analysis of the Cleanroom Lighting industry, offering invaluable insights for stakeholders, investors, and industry professionals. With a study period spanning 2019-2033, a base year of 2025, and a forecast period of 2025-2033, this report leverages historical data (2019-2024) to predict future market trends and growth opportunities. The report is valued at xx Million and covers key market segments, competitive landscapes, and emerging trends within the Cleanroom Lighting sector, offering actionable intelligence for strategic decision-making.
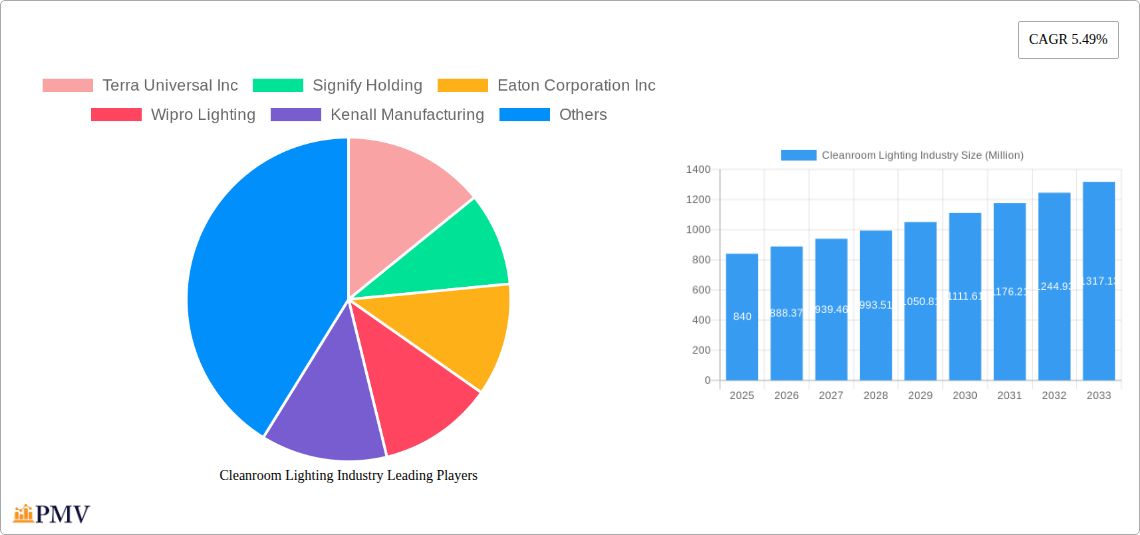
Cleanroom Lighting Industry Market Structure & Competitive Dynamics
The Cleanroom Lighting market exhibits a moderately concentrated structure, with key players such as Signify Holding, Eaton Corporation Inc, Wipro Lighting, Kenall Manufacturing, Terra Universal Inc, Solite Europe Ltd, LUG Light Factory Sp z o o, AB Fagerhult, Crompton Greaves Consumer Electricals Ltd, and Paramount Industries vying for market share. The market is characterized by continuous innovation in LED technology, driving advancements in energy efficiency and performance. Stringent regulatory frameworks governing cleanroom environments influence product design and manufacturing processes. Substitute technologies, while limited, pose a potential challenge. End-user trends toward automation and digitalization influence demand for smart lighting solutions. Mergers and acquisitions (M&A) activity, while not exceptionally high in recent years, plays a role in shaping the competitive landscape. The total value of M&A deals within the Cleanroom Lighting industry between 2019 and 2024 is estimated at xx Million.
- Market Concentration: Moderate, with a few dominant players and a larger number of smaller competitors.
- Innovation Ecosystems: Strong focus on LED technology, energy efficiency, and smart lighting solutions.
- Regulatory Frameworks: Stringent standards impacting product design and compliance.
- Product Substitutes: Limited, but potential for alternative lighting solutions in niche segments.
- End-user Trends: Growing adoption of automated systems and smart technologies.
- M&A Activity: Moderate activity, with deal values estimated at xx Million between 2019 and 2024. Individual deal values ranged from xx Million to xx Million.
Cleanroom Lighting Industry Industry Trends & Insights
The Cleanroom Lighting market is experiencing significant growth, driven by the expanding adoption of cleanrooms across various industries. The increasing demand for advanced cleanroom facilities in sectors like healthcare & life sciences, electronics & semiconductors, and food & beverage is fueling market expansion. Technological advancements, particularly in LED lighting, are enhancing energy efficiency and reducing operational costs, thereby further stimulating market growth. The Compound Annual Growth Rate (CAGR) for the Cleanroom Lighting market during the forecast period (2025-2033) is projected to be xx%. Market penetration of LED lighting in cleanrooms is increasing rapidly, surpassing xx% in 2024 and expected to reach nearly xx% by 2033. Competitive dynamics are characterized by technological innovation, strategic partnerships, and efforts to offer integrated cleanroom solutions. Consumer preferences are shifting towards energy-efficient, long-lasting, and smart lighting solutions.
Dominant Markets & Segments in Cleanroom Lighting Industry
The North American region currently holds the largest market share in the Cleanroom Lighting industry, followed by Europe and Asia-Pacific. Within the segments:
- By Light Source: LED lighting dominates the market, driven by its superior energy efficiency and longer lifespan compared to fluorescent lighting.
- By Mounting Type: Recessed mounting is more prevalent due to its aesthetic appeal and space-saving design, though surface mount lighting remains significant in certain applications.
- By End-user Industry: Healthcare & Life Sciences is the leading segment, followed by Electronics and Semiconductor, reflecting the stringent cleanroom requirements in these sectors. The Food & Beverage industry also contributes significantly to market demand.
Key Drivers for Regional Dominance:
- North America: Strong regulatory frameworks emphasizing cleanroom standards, substantial investments in healthcare & life sciences, and a developed electronics & semiconductor industry.
- Europe: High concentration of pharmaceutical companies, advanced manufacturing sectors, and supportive government policies promoting energy efficiency.
- Asia-Pacific: Rapid industrialization, increasing investments in manufacturing facilities, and growing demand from emerging economies.
Cleanroom Lighting Industry Product Innovations
Recent advancements in Cleanroom Lighting focus on enhancing energy efficiency, improving light quality, and integrating smart features. LED technology continues to evolve, offering higher lumen output, improved color rendering, and longer lifespans. Smart lighting solutions, incorporating sensors and control systems, enable optimized energy management and improved operational efficiency. These innovations cater to the growing demand for cost-effective and environmentally friendly cleanroom solutions.
Report Segmentation & Scope
This report segments the Cleanroom Lighting market by light source (LED, Fluorescent), mounting type (Recessed, Surface Mount), and end-user industry (Healthcare & Life Sciences, Electronics and Semiconductor, Food & Beverage, Other End-user Industries). Each segment's growth projection, market size, and competitive dynamics are comprehensively analyzed. The projected market size for the entire Cleanroom Lighting industry in 2033 is estimated to be xx Million.
Key Drivers of Cleanroom Lighting Industry Growth
Several factors drive the Cleanroom Lighting market's growth: the increasing adoption of cleanrooms across various sectors, the rising demand for energy-efficient lighting solutions, technological advancements in LED technology, and stringent regulatory frameworks promoting cleanroom standards. Government incentives promoting energy efficiency further accelerate market expansion.
Challenges in the Cleanroom Lighting Industry Sector
The industry faces challenges such as stringent regulatory compliance requirements, supply chain disruptions impacting component availability, and intense competition among established and emerging players. Price pressures and fluctuations in raw material costs also impact profitability. The overall impact of these challenges on the projected market growth is estimated at a reduction of xx%.
Leading Players in the Cleanroom Lighting Industry Market
- Terra Universal Inc
- Signify Holding
- Eaton Corporation Inc
- Wipro Lighting
- Kenall Manufacturing
- Solite Europe Ltd
- LUG Light Factory Sp z o o
- AB Fagerhult
- Crompton Greaves Consumer Electricals Ltd
- Paramount Industries
Key Developments in Cleanroom Lighting Industry Sector
- December 2022: Nicomac Taikisha Cleanrooms announced a USD 15.2 Million investment in a new manufacturing facility, expanding capacity for cleanroom solutions across various industries.
- May 2022: LOG invested millions of dollars to expand its manufacturing floor, including a new ISO Class 8 cleanroom, highlighting the growing need for cleanroom infrastructure within the pharmaceutical packaging sector.
Strategic Cleanroom Lighting Industry Market Outlook
The Cleanroom Lighting market presents significant growth potential, driven by ongoing technological advancements, expanding cleanroom adoption across various sectors, and a growing emphasis on energy efficiency and sustainability. Strategic opportunities lie in developing innovative LED lighting solutions, expanding into new markets, and forming strategic partnerships to offer integrated cleanroom solutions. The market is projected to maintain a robust growth trajectory throughout the forecast period, presenting promising prospects for both established players and new entrants.
Cleanroom Lighting Industry Segmentation
-
1. Light Source
- 1.1. LED
- 1.2. Fluorescent
-
2. Mounting Type
- 2.1. Recessed
- 2.2. Surface Mount
-
3. End-user Industry
- 3.1. Healthcare & Life Sciences
- 3.2. Electronics and Semiconductor
- 3.3. Food & Beverage
- 3.4. Other End-user Industries
Cleanroom Lighting Industry Segmentation By Geography
- 1. North America
- 2. Europe
- 3. Asia
- 4. Latin America
- 5. Middle East and Africa
Cleanroom Lighting Industry REPORT HIGHLIGHTS
| Aspects | Details |
|---|---|
| Study Period | 2019-2033 |
| Base Year | 2024 |
| Estimated Year | 2025 |
| Forecast Period | 2025-2033 |
| Historical Period | 2019-2024 |
| Growth Rate | CAGR of 5.49% from 2019-2033 |
| Segmentation |
|
Table of Contents
- 1. Introduction
- 1.1. Research Scope
- 1.2. Market Segmentation
- 1.3. Research Methodology
- 1.4. Definitions and Assumptions
- 2. Executive Summary
- 2.1. Introduction
- 3. Market Dynamics
- 3.1. Introduction
- 3.2. Market Drivers
- 3.2.1. Stringent Regulations in Healthcare and Food Processing Industries; Rising Demand for Sterile Manufacturing Areas in Pharmaceuticals Industry
- 3.3. Market Restrains
- 3.3.1. High Cost Associated With Cleanrooms and their Operations
- 3.4. Market Trends
- 3.4.1. Healthcare and Life Sciences Segment is Expected to Witness Significant Growth
- 4. Market Factor Analysis
- 4.1. Porters Five Forces
- 4.2. Supply/Value Chain
- 4.3. PESTEL analysis
- 4.4. Market Entropy
- 4.5. Patent/Trademark Analysis
- 5. Global Cleanroom Lighting Industry Analysis, Insights and Forecast, 2019-2031
- 5.1. Market Analysis, Insights and Forecast - by Light Source
- 5.1.1. LED
- 5.1.2. Fluorescent
- 5.2. Market Analysis, Insights and Forecast - by Mounting Type
- 5.2.1. Recessed
- 5.2.2. Surface Mount
- 5.3. Market Analysis, Insights and Forecast - by End-user Industry
- 5.3.1. Healthcare & Life Sciences
- 5.3.2. Electronics and Semiconductor
- 5.3.3. Food & Beverage
- 5.3.4. Other End-user Industries
- 5.4. Market Analysis, Insights and Forecast - by Region
- 5.4.1. North America
- 5.4.2. Europe
- 5.4.3. Asia
- 5.4.4. Latin America
- 5.4.5. Middle East and Africa
- 5.1. Market Analysis, Insights and Forecast - by Light Source
- 6. North America Cleanroom Lighting Industry Analysis, Insights and Forecast, 2019-2031
- 6.1. Market Analysis, Insights and Forecast - by Light Source
- 6.1.1. LED
- 6.1.2. Fluorescent
- 6.2. Market Analysis, Insights and Forecast - by Mounting Type
- 6.2.1. Recessed
- 6.2.2. Surface Mount
- 6.3. Market Analysis, Insights and Forecast - by End-user Industry
- 6.3.1. Healthcare & Life Sciences
- 6.3.2. Electronics and Semiconductor
- 6.3.3. Food & Beverage
- 6.3.4. Other End-user Industries
- 6.1. Market Analysis, Insights and Forecast - by Light Source
- 7. Europe Cleanroom Lighting Industry Analysis, Insights and Forecast, 2019-2031
- 7.1. Market Analysis, Insights and Forecast - by Light Source
- 7.1.1. LED
- 7.1.2. Fluorescent
- 7.2. Market Analysis, Insights and Forecast - by Mounting Type
- 7.2.1. Recessed
- 7.2.2. Surface Mount
- 7.3. Market Analysis, Insights and Forecast - by End-user Industry
- 7.3.1. Healthcare & Life Sciences
- 7.3.2. Electronics and Semiconductor
- 7.3.3. Food & Beverage
- 7.3.4. Other End-user Industries
- 7.1. Market Analysis, Insights and Forecast - by Light Source
- 8. Asia Cleanroom Lighting Industry Analysis, Insights and Forecast, 2019-2031
- 8.1. Market Analysis, Insights and Forecast - by Light Source
- 8.1.1. LED
- 8.1.2. Fluorescent
- 8.2. Market Analysis, Insights and Forecast - by Mounting Type
- 8.2.1. Recessed
- 8.2.2. Surface Mount
- 8.3. Market Analysis, Insights and Forecast - by End-user Industry
- 8.3.1. Healthcare & Life Sciences
- 8.3.2. Electronics and Semiconductor
- 8.3.3. Food & Beverage
- 8.3.4. Other End-user Industries
- 8.1. Market Analysis, Insights and Forecast - by Light Source
- 9. Latin America Cleanroom Lighting Industry Analysis, Insights and Forecast, 2019-2031
- 9.1. Market Analysis, Insights and Forecast - by Light Source
- 9.1.1. LED
- 9.1.2. Fluorescent
- 9.2. Market Analysis, Insights and Forecast - by Mounting Type
- 9.2.1. Recessed
- 9.2.2. Surface Mount
- 9.3. Market Analysis, Insights and Forecast - by End-user Industry
- 9.3.1. Healthcare & Life Sciences
- 9.3.2. Electronics and Semiconductor
- 9.3.3. Food & Beverage
- 9.3.4. Other End-user Industries
- 9.1. Market Analysis, Insights and Forecast - by Light Source
- 10. Middle East and Africa Cleanroom Lighting Industry Analysis, Insights and Forecast, 2019-2031
- 10.1. Market Analysis, Insights and Forecast - by Light Source
- 10.1.1. LED
- 10.1.2. Fluorescent
- 10.2. Market Analysis, Insights and Forecast - by Mounting Type
- 10.2.1. Recessed
- 10.2.2. Surface Mount
- 10.3. Market Analysis, Insights and Forecast - by End-user Industry
- 10.3.1. Healthcare & Life Sciences
- 10.3.2. Electronics and Semiconductor
- 10.3.3. Food & Beverage
- 10.3.4. Other End-user Industries
- 10.1. Market Analysis, Insights and Forecast - by Light Source
- 11. North America Cleanroom Lighting Industry Analysis, Insights and Forecast, 2019-2031
- 11.1. Market Analysis, Insights and Forecast - By Country/Sub-region
- 11.1.1.
- 12. Europe Cleanroom Lighting Industry Analysis, Insights and Forecast, 2019-2031
- 12.1. Market Analysis, Insights and Forecast - By Country/Sub-region
- 12.1.1.
- 13. Asia Pacific Cleanroom Lighting Industry Analysis, Insights and Forecast, 2019-2031
- 13.1. Market Analysis, Insights and Forecast - By Country/Sub-region
- 13.1.1.
- 14. Rest of the World Cleanroom Lighting Industry Analysis, Insights and Forecast, 2019-2031
- 14.1. Market Analysis, Insights and Forecast - By Country/Sub-region
- 14.1.1.
- 15. Competitive Analysis
- 15.1. Global Market Share Analysis 2024
- 15.2. Company Profiles
- 15.2.1 Terra Universal Inc
- 15.2.1.1. Overview
- 15.2.1.2. Products
- 15.2.1.3. SWOT Analysis
- 15.2.1.4. Recent Developments
- 15.2.1.5. Financials (Based on Availability)
- 15.2.2 Signify Holding
- 15.2.2.1. Overview
- 15.2.2.2. Products
- 15.2.2.3. SWOT Analysis
- 15.2.2.4. Recent Developments
- 15.2.2.5. Financials (Based on Availability)
- 15.2.3 Eaton Corporation Inc
- 15.2.3.1. Overview
- 15.2.3.2. Products
- 15.2.3.3. SWOT Analysis
- 15.2.3.4. Recent Developments
- 15.2.3.5. Financials (Based on Availability)
- 15.2.4 Wipro Lighting
- 15.2.4.1. Overview
- 15.2.4.2. Products
- 15.2.4.3. SWOT Analysis
- 15.2.4.4. Recent Developments
- 15.2.4.5. Financials (Based on Availability)
- 15.2.5 Kenall Manufacturing
- 15.2.5.1. Overview
- 15.2.5.2. Products
- 15.2.5.3. SWOT Analysis
- 15.2.5.4. Recent Developments
- 15.2.5.5. Financials (Based on Availability)
- 15.2.6 Solite Europe Ltd
- 15.2.6.1. Overview
- 15.2.6.2. Products
- 15.2.6.3. SWOT Analysis
- 15.2.6.4. Recent Developments
- 15.2.6.5. Financials (Based on Availability)
- 15.2.7 LUG Light Factory Sp z o o
- 15.2.7.1. Overview
- 15.2.7.2. Products
- 15.2.7.3. SWOT Analysis
- 15.2.7.4. Recent Developments
- 15.2.7.5. Financials (Based on Availability)
- 15.2.8 AB Fagerhult*List Not Exhaustive
- 15.2.8.1. Overview
- 15.2.8.2. Products
- 15.2.8.3. SWOT Analysis
- 15.2.8.4. Recent Developments
- 15.2.8.5. Financials (Based on Availability)
- 15.2.9 Crompton Greaves Consumer Electricals Ltd
- 15.2.9.1. Overview
- 15.2.9.2. Products
- 15.2.9.3. SWOT Analysis
- 15.2.9.4. Recent Developments
- 15.2.9.5. Financials (Based on Availability)
- 15.2.10 Paramount Industries
- 15.2.10.1. Overview
- 15.2.10.2. Products
- 15.2.10.3. SWOT Analysis
- 15.2.10.4. Recent Developments
- 15.2.10.5. Financials (Based on Availability)
- 15.2.1 Terra Universal Inc
List of Figures
- Figure 1: Global Cleanroom Lighting Industry Revenue Breakdown (Million, %) by Region 2024 & 2032
- Figure 2: North America Cleanroom Lighting Industry Revenue (Million), by Country 2024 & 2032
- Figure 3: North America Cleanroom Lighting Industry Revenue Share (%), by Country 2024 & 2032
- Figure 4: Europe Cleanroom Lighting Industry Revenue (Million), by Country 2024 & 2032
- Figure 5: Europe Cleanroom Lighting Industry Revenue Share (%), by Country 2024 & 2032
- Figure 6: Asia Pacific Cleanroom Lighting Industry Revenue (Million), by Country 2024 & 2032
- Figure 7: Asia Pacific Cleanroom Lighting Industry Revenue Share (%), by Country 2024 & 2032
- Figure 8: Rest of the World Cleanroom Lighting Industry Revenue (Million), by Country 2024 & 2032
- Figure 9: Rest of the World Cleanroom Lighting Industry Revenue Share (%), by Country 2024 & 2032
- Figure 10: North America Cleanroom Lighting Industry Revenue (Million), by Light Source 2024 & 2032
- Figure 11: North America Cleanroom Lighting Industry Revenue Share (%), by Light Source 2024 & 2032
- Figure 12: North America Cleanroom Lighting Industry Revenue (Million), by Mounting Type 2024 & 2032
- Figure 13: North America Cleanroom Lighting Industry Revenue Share (%), by Mounting Type 2024 & 2032
- Figure 14: North America Cleanroom Lighting Industry Revenue (Million), by End-user Industry 2024 & 2032
- Figure 15: North America Cleanroom Lighting Industry Revenue Share (%), by End-user Industry 2024 & 2032
- Figure 16: North America Cleanroom Lighting Industry Revenue (Million), by Country 2024 & 2032
- Figure 17: North America Cleanroom Lighting Industry Revenue Share (%), by Country 2024 & 2032
- Figure 18: Europe Cleanroom Lighting Industry Revenue (Million), by Light Source 2024 & 2032
- Figure 19: Europe Cleanroom Lighting Industry Revenue Share (%), by Light Source 2024 & 2032
- Figure 20: Europe Cleanroom Lighting Industry Revenue (Million), by Mounting Type 2024 & 2032
- Figure 21: Europe Cleanroom Lighting Industry Revenue Share (%), by Mounting Type 2024 & 2032
- Figure 22: Europe Cleanroom Lighting Industry Revenue (Million), by End-user Industry 2024 & 2032
- Figure 23: Europe Cleanroom Lighting Industry Revenue Share (%), by End-user Industry 2024 & 2032
- Figure 24: Europe Cleanroom Lighting Industry Revenue (Million), by Country 2024 & 2032
- Figure 25: Europe Cleanroom Lighting Industry Revenue Share (%), by Country 2024 & 2032
- Figure 26: Asia Cleanroom Lighting Industry Revenue (Million), by Light Source 2024 & 2032
- Figure 27: Asia Cleanroom Lighting Industry Revenue Share (%), by Light Source 2024 & 2032
- Figure 28: Asia Cleanroom Lighting Industry Revenue (Million), by Mounting Type 2024 & 2032
- Figure 29: Asia Cleanroom Lighting Industry Revenue Share (%), by Mounting Type 2024 & 2032
- Figure 30: Asia Cleanroom Lighting Industry Revenue (Million), by End-user Industry 2024 & 2032
- Figure 31: Asia Cleanroom Lighting Industry Revenue Share (%), by End-user Industry 2024 & 2032
- Figure 32: Asia Cleanroom Lighting Industry Revenue (Million), by Country 2024 & 2032
- Figure 33: Asia Cleanroom Lighting Industry Revenue Share (%), by Country 2024 & 2032
- Figure 34: Latin America Cleanroom Lighting Industry Revenue (Million), by Light Source 2024 & 2032
- Figure 35: Latin America Cleanroom Lighting Industry Revenue Share (%), by Light Source 2024 & 2032
- Figure 36: Latin America Cleanroom Lighting Industry Revenue (Million), by Mounting Type 2024 & 2032
- Figure 37: Latin America Cleanroom Lighting Industry Revenue Share (%), by Mounting Type 2024 & 2032
- Figure 38: Latin America Cleanroom Lighting Industry Revenue (Million), by End-user Industry 2024 & 2032
- Figure 39: Latin America Cleanroom Lighting Industry Revenue Share (%), by End-user Industry 2024 & 2032
- Figure 40: Latin America Cleanroom Lighting Industry Revenue (Million), by Country 2024 & 2032
- Figure 41: Latin America Cleanroom Lighting Industry Revenue Share (%), by Country 2024 & 2032
- Figure 42: Middle East and Africa Cleanroom Lighting Industry Revenue (Million), by Light Source 2024 & 2032
- Figure 43: Middle East and Africa Cleanroom Lighting Industry Revenue Share (%), by Light Source 2024 & 2032
- Figure 44: Middle East and Africa Cleanroom Lighting Industry Revenue (Million), by Mounting Type 2024 & 2032
- Figure 45: Middle East and Africa Cleanroom Lighting Industry Revenue Share (%), by Mounting Type 2024 & 2032
- Figure 46: Middle East and Africa Cleanroom Lighting Industry Revenue (Million), by End-user Industry 2024 & 2032
- Figure 47: Middle East and Africa Cleanroom Lighting Industry Revenue Share (%), by End-user Industry 2024 & 2032
- Figure 48: Middle East and Africa Cleanroom Lighting Industry Revenue (Million), by Country 2024 & 2032
- Figure 49: Middle East and Africa Cleanroom Lighting Industry Revenue Share (%), by Country 2024 & 2032
List of Tables
- Table 1: Global Cleanroom Lighting Industry Revenue Million Forecast, by Region 2019 & 2032
- Table 2: Global Cleanroom Lighting Industry Revenue Million Forecast, by Light Source 2019 & 2032
- Table 3: Global Cleanroom Lighting Industry Revenue Million Forecast, by Mounting Type 2019 & 2032
- Table 4: Global Cleanroom Lighting Industry Revenue Million Forecast, by End-user Industry 2019 & 2032
- Table 5: Global Cleanroom Lighting Industry Revenue Million Forecast, by Region 2019 & 2032
- Table 6: Global Cleanroom Lighting Industry Revenue Million Forecast, by Country 2019 & 2032
- Table 7: Cleanroom Lighting Industry Revenue (Million) Forecast, by Application 2019 & 2032
- Table 8: Global Cleanroom Lighting Industry Revenue Million Forecast, by Country 2019 & 2032
- Table 9: Cleanroom Lighting Industry Revenue (Million) Forecast, by Application 2019 & 2032
- Table 10: Global Cleanroom Lighting Industry Revenue Million Forecast, by Country 2019 & 2032
- Table 11: Cleanroom Lighting Industry Revenue (Million) Forecast, by Application 2019 & 2032
- Table 12: Global Cleanroom Lighting Industry Revenue Million Forecast, by Country 2019 & 2032
- Table 13: Cleanroom Lighting Industry Revenue (Million) Forecast, by Application 2019 & 2032
- Table 14: Global Cleanroom Lighting Industry Revenue Million Forecast, by Light Source 2019 & 2032
- Table 15: Global Cleanroom Lighting Industry Revenue Million Forecast, by Mounting Type 2019 & 2032
- Table 16: Global Cleanroom Lighting Industry Revenue Million Forecast, by End-user Industry 2019 & 2032
- Table 17: Global Cleanroom Lighting Industry Revenue Million Forecast, by Country 2019 & 2032
- Table 18: Global Cleanroom Lighting Industry Revenue Million Forecast, by Light Source 2019 & 2032
- Table 19: Global Cleanroom Lighting Industry Revenue Million Forecast, by Mounting Type 2019 & 2032
- Table 20: Global Cleanroom Lighting Industry Revenue Million Forecast, by End-user Industry 2019 & 2032
- Table 21: Global Cleanroom Lighting Industry Revenue Million Forecast, by Country 2019 & 2032
- Table 22: Global Cleanroom Lighting Industry Revenue Million Forecast, by Light Source 2019 & 2032
- Table 23: Global Cleanroom Lighting Industry Revenue Million Forecast, by Mounting Type 2019 & 2032
- Table 24: Global Cleanroom Lighting Industry Revenue Million Forecast, by End-user Industry 2019 & 2032
- Table 25: Global Cleanroom Lighting Industry Revenue Million Forecast, by Country 2019 & 2032
- Table 26: Global Cleanroom Lighting Industry Revenue Million Forecast, by Light Source 2019 & 2032
- Table 27: Global Cleanroom Lighting Industry Revenue Million Forecast, by Mounting Type 2019 & 2032
- Table 28: Global Cleanroom Lighting Industry Revenue Million Forecast, by End-user Industry 2019 & 2032
- Table 29: Global Cleanroom Lighting Industry Revenue Million Forecast, by Country 2019 & 2032
- Table 30: Global Cleanroom Lighting Industry Revenue Million Forecast, by Light Source 2019 & 2032
- Table 31: Global Cleanroom Lighting Industry Revenue Million Forecast, by Mounting Type 2019 & 2032
- Table 32: Global Cleanroom Lighting Industry Revenue Million Forecast, by End-user Industry 2019 & 2032
- Table 33: Global Cleanroom Lighting Industry Revenue Million Forecast, by Country 2019 & 2032
Frequently Asked Questions
1. What is the projected Compound Annual Growth Rate (CAGR) of the Cleanroom Lighting Industry?
The projected CAGR is approximately 5.49%.
2. Which companies are prominent players in the Cleanroom Lighting Industry?
Key companies in the market include Terra Universal Inc, Signify Holding, Eaton Corporation Inc, Wipro Lighting, Kenall Manufacturing, Solite Europe Ltd, LUG Light Factory Sp z o o, AB Fagerhult*List Not Exhaustive, Crompton Greaves Consumer Electricals Ltd, Paramount Industries.
3. What are the main segments of the Cleanroom Lighting Industry?
The market segments include Light Source, Mounting Type, End-user Industry.
4. Can you provide details about the market size?
The market size is estimated to be USD 0.84 Million as of 2022.
5. What are some drivers contributing to market growth?
Stringent Regulations in Healthcare and Food Processing Industries; Rising Demand for Sterile Manufacturing Areas in Pharmaceuticals Industry.
6. What are the notable trends driving market growth?
Healthcare and Life Sciences Segment is Expected to Witness Significant Growth.
7. Are there any restraints impacting market growth?
High Cost Associated With Cleanrooms and their Operations.
8. Can you provide examples of recent developments in the market?
December 2022: Nicomac Taikisha Cleanrooms announced an investment of INR 126.2 crore (USD 15.2 million) to set up its third manufacturing facility in Hyderabad, India. Taikisha is a significant provider of cleanrooms and HVAC systems for electronic devices, the food industry, lithium-ion battery manufacturing, and hydroponic farming. The company also manufactures and constructs cleanroom facilities for pharmaceuticals and vaccines in sterile industries.
9. What pricing options are available for accessing the report?
Pricing options include single-user, multi-user, and enterprise licenses priced at USD 4750, USD 5250, and USD 8750 respectively.
10. Is the market size provided in terms of value or volume?
The market size is provided in terms of value, measured in Million.
11. Are there any specific market keywords associated with the report?
Yes, the market keyword associated with the report is "Cleanroom Lighting Industry," which aids in identifying and referencing the specific market segment covered.
12. How do I determine which pricing option suits my needs best?
The pricing options vary based on user requirements and access needs. Individual users may opt for single-user licenses, while businesses requiring broader access may choose multi-user or enterprise licenses for cost-effective access to the report.
13. Are there any additional resources or data provided in the Cleanroom Lighting Industry report?
While the report offers comprehensive insights, it's advisable to review the specific contents or supplementary materials provided to ascertain if additional resources or data are available.
14. How can I stay updated on further developments or reports in the Cleanroom Lighting Industry?
To stay informed about further developments, trends, and reports in the Cleanroom Lighting Industry, consider subscribing to industry newsletters, following relevant companies and organizations, or regularly checking reputable industry news sources and publications.
Methodology
Step 1 - Identification of Relevant Samples Size from Population Database


Step 2 - Approaches for Defining Global Market Size (Value, Volume* & Price*)

Note*: In applicable scenarios
Step 3 - Data Sources
Primary Research
- Web Analytics
- Survey Reports
- Research Institute
- Latest Research Reports
- Opinion Leaders
Secondary Research
- Annual Reports
- White Paper
- Latest Press Release
- Industry Association
- Paid Database
- Investor Presentations

Step 4 - Data Triangulation
Involves using different sources of information in order to increase the validity of a study
These sources are likely to be stakeholders in a program - participants, other researchers, program staff, other community members, and so on.
Then we put all data in single framework & apply various statistical tools to find out the dynamic on the market.
During the analysis stage, feedback from the stakeholder groups would be compared to determine areas of agreement as well as areas of divergence


