
Key Insights
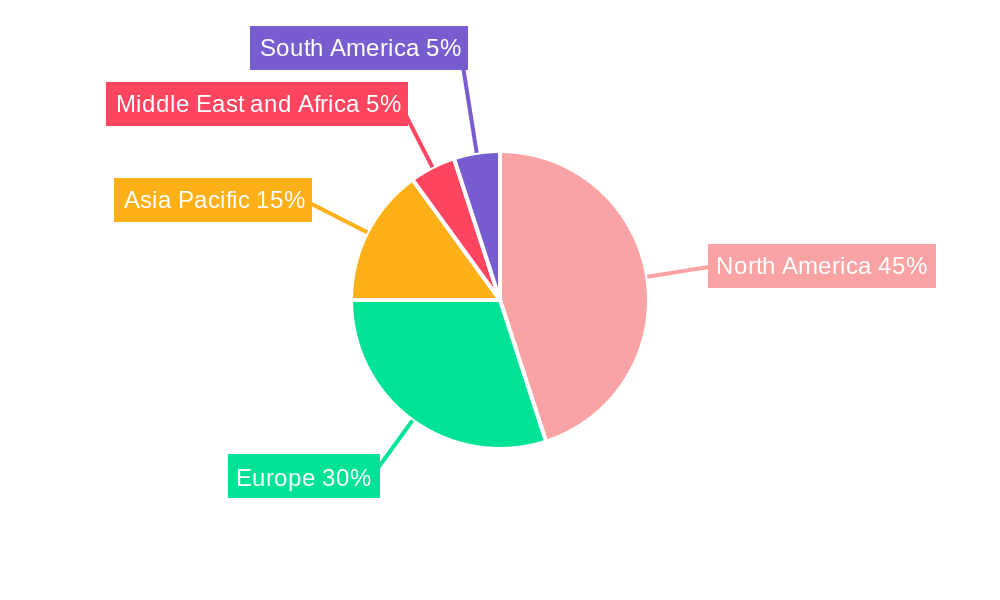
The global artificial cervical disc market is experiencing robust growth, projected to reach a substantial size driven by several key factors. The aging population, increasing prevalence of degenerative disc disease, and a rising preference for minimally invasive surgical procedures are major contributors to this expansion. Technological advancements leading to the development of more durable and biocompatible materials, along with improved surgical techniques, are further fueling market expansion. The market is segmented by disc type (cervical and lumbar) and material type (metal-on-metal and metal-on-polymer), each exhibiting unique growth trajectories. Metal-on-polymer discs currently hold a larger market share due to their superior biocompatibility and reduced wear debris, although metal-on-metal discs are gaining traction due to their enhanced strength and durability. Regional variations exist, with North America and Europe currently dominating the market due to higher healthcare expenditure and advanced medical infrastructure. However, the Asia-Pacific region is expected to witness significant growth in the coming years, driven by increasing healthcare awareness and rising disposable incomes.
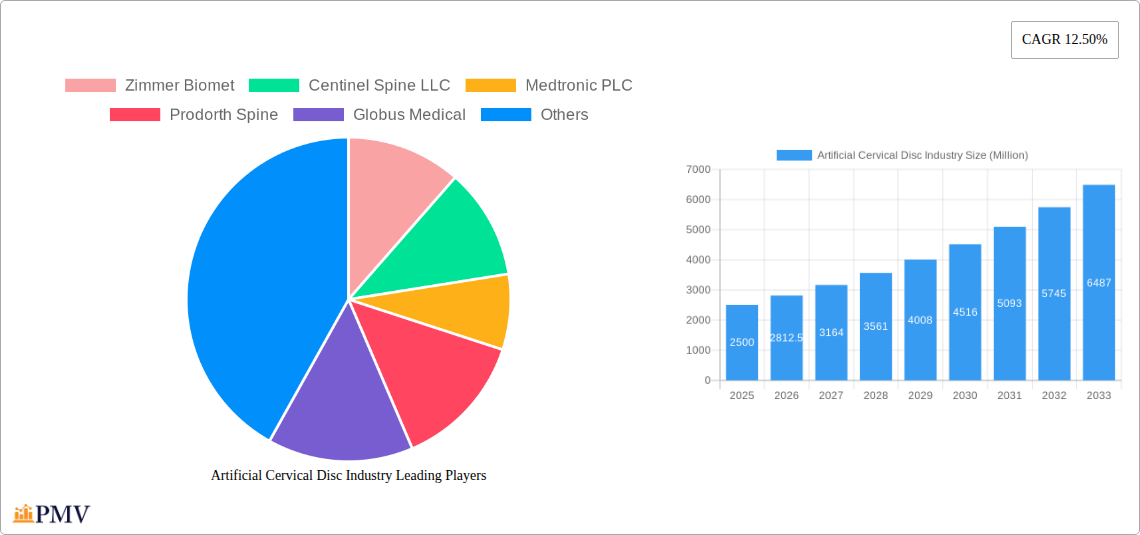
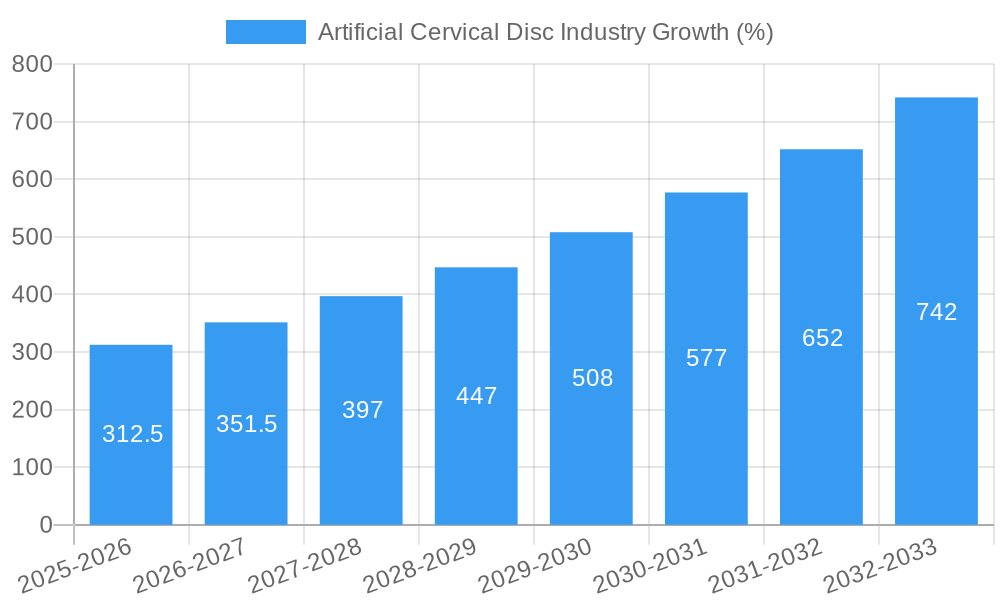
Competitive dynamics within the artificial cervical disc market are intense, with key players such as Zimmer Biomet, Medtronic, and others engaging in continuous research and development to improve existing technologies and introduce innovative products. Strategic partnerships, acquisitions, and geographical expansions are common strategies employed by these companies to solidify their market position and capture a larger share of the growing market. The market, however, faces certain restraints including the high cost of the procedure, potential for complications (though minimized by advancements), and the relative novelty of the procedure leading to hesitancy amongst some patients and physicians. Despite these challenges, the overall outlook for the artificial cervical disc market remains positive, with a consistent CAGR of 12.50% expected throughout the forecast period (2025-2033). This indicates a considerable expansion and lucrative opportunities for established and emerging companies within the sector.
Artificial Cervical Disc Market Report: 2019-2033
This comprehensive report provides a detailed analysis of the Artificial Cervical Disc market, offering invaluable insights for industry stakeholders. The report covers the period 2019-2033, with a focus on the forecast period 2025-2033, using 2025 as the base year. The market is segmented by disc type (Cervical Artificial Disc, Lumbar Artificial Disc) and material type (Metal on Metal, Metal on Polymer). Key players analyzed include Zimmer Biomet, Centinel Spine LLC, Medtronic PLC, Prodorth Spine, Globus Medical, Orthofix Medical Inc, B Braun Melsungen, Synergy Spine Solutions Inc, Spineart SA, NuVasive Inc, and AxioMed LLC. The report projects a market value exceeding XX Million by 2033.
Artificial Cervical Disc Industry Market Structure & Competitive Dynamics
The artificial cervical disc market exhibits a moderately concentrated structure, with a few major players holding significant market share. Zimmer Biomet, Medtronic PLC, and Globus Medical are among the leading companies, collectively accounting for an estimated XX% of the market in 2025. However, smaller companies and start-ups are increasingly active, fostering a dynamic competitive landscape. The industry is characterized by a strong focus on innovation, with companies investing heavily in R&D to develop advanced materials and designs. Regulatory frameworks, particularly those related to medical device approvals, play a crucial role in shaping market dynamics. The market witnesses continuous M&A activities, with deal values fluctuating based on market conditions and strategic objectives. For instance, the merger between Orthofix and SeaSpine in October 2022 signals a trend towards consolidation. The value of this deal was reported as xx Million. Substitute products, such as spinal fusion surgeries, represent a significant competitive threat, influencing treatment choices and market demand. Finally, evolving end-user preferences and increasing awareness of minimally invasive surgical procedures are shaping the market's trajectory.
- Market Concentration: High, with a few dominant players.
- Innovation Ecosystems: Active, with substantial R&D investment.
- Regulatory Frameworks: Stringent, influencing market entry and product approvals.
- Product Substitutes: Spinal fusion surgeries pose significant competition.
- M&A Activities: Frequent, driven by strategic consolidation and expansion.
Artificial Cervical Disc Industry Industry Trends & Insights
The global artificial cervical disc market is experiencing robust growth, driven by several key factors. The rising prevalence of degenerative disc disease, coupled with an aging global population, is significantly boosting demand for minimally invasive spinal surgeries. Technological advancements, such as the development of biocompatible materials and improved surgical techniques, are further accelerating market expansion. Consumers increasingly favor minimally invasive procedures due to shorter recovery times and reduced post-operative pain. The competitive landscape is dynamic, with companies focusing on product differentiation through innovative designs and improved clinical outcomes. This has led to a compound annual growth rate (CAGR) of approximately XX% during the historical period (2019-2024) and a projected CAGR of XX% during the forecast period (2025-2033). Market penetration continues to rise, driven by heightened physician and patient awareness and improved reimbursement scenarios in key markets. The adoption rate of cervical artificial discs varies significantly across regions due to factors such as healthcare infrastructure, access to advanced surgical facilities, and varying healthcare policies.
Dominant Markets & Segments in Artificial Cervical Disc Industry
The North American region currently dominates the artificial cervical disc market, owing to factors such as high healthcare expenditure, advanced medical infrastructure, and a large patient pool. Within North America, the United States holds the largest market share. Key drivers for this dominance include favorable reimbursement policies, a strong presence of major market players, and ongoing technological innovations. Europe also holds a substantial market share, driven by a growing aging population and increasing adoption of minimally invasive surgical techniques. However, pricing pressures and regulatory complexities present challenges to market growth in some European countries.
- Disc Type: Cervical Artificial Discs hold a larger market share than Lumbar Artificial Discs currently, driven by higher prevalence of cervical degenerative disc disease and easier surgical accessibility.
- Material Type: Metal-on-Polymer artificial discs are currently more prevalent due to their biocompatibility and reduced wear compared to metal-on-metal designs.
Key Drivers for Dominant Regions:
- North America: High healthcare expenditure, advanced medical infrastructure, favorable reimbursement policies, strong presence of market players.
- Europe: Growing aging population, increased adoption of minimally invasive procedures, strong regulatory frameworks.
Artificial Cervical Disc Industry Product Innovations
Recent advancements in artificial cervical disc technology are focused on improving biocompatibility, reducing wear and tear, and enhancing the overall stability of the implant. Companies are exploring new materials, such as advanced polymers and bioabsorbable materials, to minimize adverse reactions and improve long-term outcomes. The development of more precise and minimally invasive surgical techniques, along with improved imaging technologies, is facilitating wider adoption. These innovations aim to address limitations of existing products and improve patient outcomes, thereby driving the market's expansion.
Report Segmentation & Scope
This report segments the artificial cervical disc market by disc type (Cervical Artificial Disc, Lumbar Artificial Disc) and material type (Metal on Metal, Metal on Polymer). Each segment presents distinct market dynamics, with growth projections varying based on factors such as clinical adoption rates, technological advancements, and regulatory approvals. Cervical artificial discs currently constitute a larger market share compared to lumbar artificial discs. Similarly, metal-on-polymer discs dominate the material segment due to better biocompatibility profiles. The report analyzes the competitive landscape within each segment, identifying key players and their market strategies. Detailed market size estimations and growth forecasts are provided for each segment, contributing to a comprehensive understanding of the market landscape.
Key Drivers of Artificial Cervical Disc Industry Growth
Several key factors are driving growth in the artificial cervical disc market. The aging global population leads to a higher prevalence of degenerative disc disease, increasing the demand for effective treatment options. Technological innovations in materials and surgical techniques are crucial, enabling less invasive procedures and better patient outcomes. Favorable reimbursement policies and rising healthcare expenditure in developed countries are creating significant opportunities for market expansion. Finally, growing physician and patient awareness of the benefits of artificial disc replacement is further stimulating market growth.
Challenges in the Artificial Cervical Disc Industry Sector
The artificial cervical disc market faces several challenges. Stringent regulatory approvals and high costs associated with product development and launch create barriers to market entry. Supply chain disruptions and material shortages can impact production and availability. Intense competition from established players and the emergence of new entrants necessitates continuous innovation and product differentiation. Moreover, the long-term efficacy and potential complications associated with artificial disc implants can influence patient and physician adoption. These factors pose significant challenges to the industry's growth trajectory, with estimated xx Million in lost revenue annually.
Leading Players in the Artificial Cervical Disc Industry Market
- Zimmer Biomet
- Centinel Spine LLC
- Medtronic PLC
- Prodorth Spine
- Globus Medical
- Orthofix Medical Inc
- B Braun Melsungen
- Synergy Spine Solutions Inc
- Spineart SA
- NuVasive Inc
- AxioMed LLC
Key Developments in Artificial Cervical Disc Industry Sector
- November 2022: Centinel Spine, LLC announced the first implantation of its prodisc C SK, a cervical artificial disc.
- October 2022: Orthofix and SeaSpine announced a definitive merger agreement.
Strategic Artificial Cervical Disc Industry Market Outlook
The artificial cervical disc market holds significant growth potential, driven by continued technological advancements, rising prevalence of degenerative disc disease, and an expanding elderly population. Strategic opportunities exist for companies focusing on innovation, particularly in the development of biocompatible materials and minimally invasive surgical techniques. Expansion into emerging markets and strategic partnerships will be crucial for achieving sustainable growth. The market's future trajectory is bright, with potential for substantial market expansion and increased adoption of artificial disc replacement.
Artificial Cervical Disc Industry Segmentation
-
1. Disc Type
- 1.1. Cervical Artificial Disc
- 1.2. Lumbar Artificial Disc
-
2. Material Type
- 2.1. Metal on Metal
- 2.2. Metal on Polymer
Artificial Cervical Disc Industry Segmentation By Geography
-
1. North America
- 1.1. United States
- 1.2. Canada
- 1.3. Mexico
-
2. Europe
- 2.1. Germany
- 2.2. United Kingdom
- 2.3. France
- 2.4. Italy
- 2.5. Spain
- 2.6. Rest of Europe
-
3. Asia Pacific
- 3.1. China
- 3.2. Japan
- 3.3. India
- 3.4. Australia
- 3.5. South Korea
- 3.6. Rest of Asia Pacific
-
4. Middle East and Africa
- 4.1. GCC
- 4.2. South Africa
- 4.3. Rest of Middle East and Africa
-
5. South America
- 5.1. Brazil
- 5.2. Argentina
- 5.3. Rest of South America
Artificial Cervical Disc Industry REPORT HIGHLIGHTS
| Aspects | Details |
|---|---|
| Study Period | 2019-2033 |
| Base Year | 2024 |
| Estimated Year | 2025 |
| Forecast Period | 2025-2033 |
| Historical Period | 2019-2024 |
| Growth Rate | CAGR of 12.50% from 2019-2033 |
| Segmentation |
|
Table of Contents
- 1. Introduction
- 1.1. Research Scope
- 1.2. Market Segmentation
- 1.3. Research Methodology
- 1.4. Definitions and Assumptions
- 2. Executive Summary
- 2.1. Introduction
- 3. Market Dynamics
- 3.1. Introduction
- 3.2. Market Drivers
- 3.2.1. Growing Burden of Spine Related Diseases; Increasing Research and Development Activities in Relation to Spine Technologies; Growing Geriatric Population and Increasing Preference for Minimally Invasive Surgeries
- 3.3. Market Restrains
- 3.3.1. Reimbursement Issues; High Cost of Procedures
- 3.4. Market Trends
- 3.4.1. Cervical Artificial Disc Segment is Expected to Hold a Significant Market Share Over the Forecast Period
- 4. Market Factor Analysis
- 4.1. Porters Five Forces
- 4.2. Supply/Value Chain
- 4.3. PESTEL analysis
- 4.4. Market Entropy
- 4.5. Patent/Trademark Analysis
- 5. Global Artificial Cervical Disc Industry Analysis, Insights and Forecast, 2019-2031
- 5.1. Market Analysis, Insights and Forecast - by Disc Type
- 5.1.1. Cervical Artificial Disc
- 5.1.2. Lumbar Artificial Disc
- 5.2. Market Analysis, Insights and Forecast - by Material Type
- 5.2.1. Metal on Metal
- 5.2.2. Metal on Polymer
- 5.3. Market Analysis, Insights and Forecast - by Region
- 5.3.1. North America
- 5.3.2. Europe
- 5.3.3. Asia Pacific
- 5.3.4. Middle East and Africa
- 5.3.5. South America
- 5.1. Market Analysis, Insights and Forecast - by Disc Type
- 6. North America Artificial Cervical Disc Industry Analysis, Insights and Forecast, 2019-2031
- 6.1. Market Analysis, Insights and Forecast - by Disc Type
- 6.1.1. Cervical Artificial Disc
- 6.1.2. Lumbar Artificial Disc
- 6.2. Market Analysis, Insights and Forecast - by Material Type
- 6.2.1. Metal on Metal
- 6.2.2. Metal on Polymer
- 6.1. Market Analysis, Insights and Forecast - by Disc Type
- 7. Europe Artificial Cervical Disc Industry Analysis, Insights and Forecast, 2019-2031
- 7.1. Market Analysis, Insights and Forecast - by Disc Type
- 7.1.1. Cervical Artificial Disc
- 7.1.2. Lumbar Artificial Disc
- 7.2. Market Analysis, Insights and Forecast - by Material Type
- 7.2.1. Metal on Metal
- 7.2.2. Metal on Polymer
- 7.1. Market Analysis, Insights and Forecast - by Disc Type
- 8. Asia Pacific Artificial Cervical Disc Industry Analysis, Insights and Forecast, 2019-2031
- 8.1. Market Analysis, Insights and Forecast - by Disc Type
- 8.1.1. Cervical Artificial Disc
- 8.1.2. Lumbar Artificial Disc
- 8.2. Market Analysis, Insights and Forecast - by Material Type
- 8.2.1. Metal on Metal
- 8.2.2. Metal on Polymer
- 8.1. Market Analysis, Insights and Forecast - by Disc Type
- 9. Middle East and Africa Artificial Cervical Disc Industry Analysis, Insights and Forecast, 2019-2031
- 9.1. Market Analysis, Insights and Forecast - by Disc Type
- 9.1.1. Cervical Artificial Disc
- 9.1.2. Lumbar Artificial Disc
- 9.2. Market Analysis, Insights and Forecast - by Material Type
- 9.2.1. Metal on Metal
- 9.2.2. Metal on Polymer
- 9.1. Market Analysis, Insights and Forecast - by Disc Type
- 10. South America Artificial Cervical Disc Industry Analysis, Insights and Forecast, 2019-2031
- 10.1. Market Analysis, Insights and Forecast - by Disc Type
- 10.1.1. Cervical Artificial Disc
- 10.1.2. Lumbar Artificial Disc
- 10.2. Market Analysis, Insights and Forecast - by Material Type
- 10.2.1. Metal on Metal
- 10.2.2. Metal on Polymer
- 10.1. Market Analysis, Insights and Forecast - by Disc Type
- 11. North America Artificial Cervical Disc Industry Analysis, Insights and Forecast, 2019-2031
- 11.1. Market Analysis, Insights and Forecast - By Country/Sub-region
- 11.1.1. undefined
- 12. Europe Artificial Cervical Disc Industry Analysis, Insights and Forecast, 2019-2031
- 12.1. Market Analysis, Insights and Forecast - By Country/Sub-region
- 12.1.1. undefined
- 13. Asia Pacific Artificial Cervical Disc Industry Analysis, Insights and Forecast, 2019-2031
- 13.1. Market Analysis, Insights and Forecast - By Country/Sub-region
- 13.1.1. undefined
- 14. Middle East and Africa Artificial Cervical Disc Industry Analysis, Insights and Forecast, 2019-2031
- 14.1. Market Analysis, Insights and Forecast - By Country/Sub-region
- 14.1.1. undefined
- 15. South America Artificial Cervical Disc Industry Analysis, Insights and Forecast, 2019-2031
- 15.1. Market Analysis, Insights and Forecast - By Country/Sub-region
- 15.1.1. undefined
- 16. Competitive Analysis
- 16.1. Global Market Share Analysis 2024
- 16.2. Company Profiles
- 16.2.1 Zimmer Biomet
- 16.2.1.1. Overview
- 16.2.1.2. Products
- 16.2.1.3. SWOT Analysis
- 16.2.1.4. Recent Developments
- 16.2.1.5. Financials (Based on Availability)
- 16.2.2 Centinel Spine LLC
- 16.2.2.1. Overview
- 16.2.2.2. Products
- 16.2.2.3. SWOT Analysis
- 16.2.2.4. Recent Developments
- 16.2.2.5. Financials (Based on Availability)
- 16.2.3 Medtronic PLC
- 16.2.3.1. Overview
- 16.2.3.2. Products
- 16.2.3.3. SWOT Analysis
- 16.2.3.4. Recent Developments
- 16.2.3.5. Financials (Based on Availability)
- 16.2.4 Prodorth Spine
- 16.2.4.1. Overview
- 16.2.4.2. Products
- 16.2.4.3. SWOT Analysis
- 16.2.4.4. Recent Developments
- 16.2.4.5. Financials (Based on Availability)
- 16.2.5 Globus Medical
- 16.2.5.1. Overview
- 16.2.5.2. Products
- 16.2.5.3. SWOT Analysis
- 16.2.5.4. Recent Developments
- 16.2.5.5. Financials (Based on Availability)
- 16.2.6 Orthofix Medical Inc
- 16.2.6.1. Overview
- 16.2.6.2. Products
- 16.2.6.3. SWOT Analysis
- 16.2.6.4. Recent Developments
- 16.2.6.5. Financials (Based on Availability)
- 16.2.7 B Braun Melsungen
- 16.2.7.1. Overview
- 16.2.7.2. Products
- 16.2.7.3. SWOT Analysis
- 16.2.7.4. Recent Developments
- 16.2.7.5. Financials (Based on Availability)
- 16.2.8 Synergy Spine Solutions Inc
- 16.2.8.1. Overview
- 16.2.8.2. Products
- 16.2.8.3. SWOT Analysis
- 16.2.8.4. Recent Developments
- 16.2.8.5. Financials (Based on Availability)
- 16.2.9 Spineart SA
- 16.2.9.1. Overview
- 16.2.9.2. Products
- 16.2.9.3. SWOT Analysis
- 16.2.9.4. Recent Developments
- 16.2.9.5. Financials (Based on Availability)
- 16.2.10 NuVasive Inc
- 16.2.10.1. Overview
- 16.2.10.2. Products
- 16.2.10.3. SWOT Analysis
- 16.2.10.4. Recent Developments
- 16.2.10.5. Financials (Based on Availability)
- 16.2.11 AxioMed LLC
- 16.2.11.1. Overview
- 16.2.11.2. Products
- 16.2.11.3. SWOT Analysis
- 16.2.11.4. Recent Developments
- 16.2.11.5. Financials (Based on Availability)
- 16.2.1 Zimmer Biomet
List of Figures
- Figure 1: Global Artificial Cervical Disc Industry Revenue Breakdown (Million, %) by Region 2024 & 2032
- Figure 2: Global Artificial Cervical Disc Industry Volume Breakdown (K Unit, %) by Region 2024 & 2032
- Figure 3: North America Artificial Cervical Disc Industry Revenue (Million), by Country 2024 & 2032
- Figure 4: North America Artificial Cervical Disc Industry Volume (K Unit), by Country 2024 & 2032
- Figure 5: North America Artificial Cervical Disc Industry Revenue Share (%), by Country 2024 & 2032
- Figure 6: North America Artificial Cervical Disc Industry Volume Share (%), by Country 2024 & 2032
- Figure 7: Europe Artificial Cervical Disc Industry Revenue (Million), by Country 2024 & 2032
- Figure 8: Europe Artificial Cervical Disc Industry Volume (K Unit), by Country 2024 & 2032
- Figure 9: Europe Artificial Cervical Disc Industry Revenue Share (%), by Country 2024 & 2032
- Figure 10: Europe Artificial Cervical Disc Industry Volume Share (%), by Country 2024 & 2032
- Figure 11: Asia Pacific Artificial Cervical Disc Industry Revenue (Million), by Country 2024 & 2032
- Figure 12: Asia Pacific Artificial Cervical Disc Industry Volume (K Unit), by Country 2024 & 2032
- Figure 13: Asia Pacific Artificial Cervical Disc Industry Revenue Share (%), by Country 2024 & 2032
- Figure 14: Asia Pacific Artificial Cervical Disc Industry Volume Share (%), by Country 2024 & 2032
- Figure 15: Middle East and Africa Artificial Cervical Disc Industry Revenue (Million), by Country 2024 & 2032
- Figure 16: Middle East and Africa Artificial Cervical Disc Industry Volume (K Unit), by Country 2024 & 2032
- Figure 17: Middle East and Africa Artificial Cervical Disc Industry Revenue Share (%), by Country 2024 & 2032
- Figure 18: Middle East and Africa Artificial Cervical Disc Industry Volume Share (%), by Country 2024 & 2032
- Figure 19: South America Artificial Cervical Disc Industry Revenue (Million), by Country 2024 & 2032
- Figure 20: South America Artificial Cervical Disc Industry Volume (K Unit), by Country 2024 & 2032
- Figure 21: South America Artificial Cervical Disc Industry Revenue Share (%), by Country 2024 & 2032
- Figure 22: South America Artificial Cervical Disc Industry Volume Share (%), by Country 2024 & 2032
- Figure 23: North America Artificial Cervical Disc Industry Revenue (Million), by Disc Type 2024 & 2032
- Figure 24: North America Artificial Cervical Disc Industry Volume (K Unit), by Disc Type 2024 & 2032
- Figure 25: North America Artificial Cervical Disc Industry Revenue Share (%), by Disc Type 2024 & 2032
- Figure 26: North America Artificial Cervical Disc Industry Volume Share (%), by Disc Type 2024 & 2032
- Figure 27: North America Artificial Cervical Disc Industry Revenue (Million), by Material Type 2024 & 2032
- Figure 28: North America Artificial Cervical Disc Industry Volume (K Unit), by Material Type 2024 & 2032
- Figure 29: North America Artificial Cervical Disc Industry Revenue Share (%), by Material Type 2024 & 2032
- Figure 30: North America Artificial Cervical Disc Industry Volume Share (%), by Material Type 2024 & 2032
- Figure 31: North America Artificial Cervical Disc Industry Revenue (Million), by Country 2024 & 2032
- Figure 32: North America Artificial Cervical Disc Industry Volume (K Unit), by Country 2024 & 2032
- Figure 33: North America Artificial Cervical Disc Industry Revenue Share (%), by Country 2024 & 2032
- Figure 34: North America Artificial Cervical Disc Industry Volume Share (%), by Country 2024 & 2032
- Figure 35: Europe Artificial Cervical Disc Industry Revenue (Million), by Disc Type 2024 & 2032
- Figure 36: Europe Artificial Cervical Disc Industry Volume (K Unit), by Disc Type 2024 & 2032
- Figure 37: Europe Artificial Cervical Disc Industry Revenue Share (%), by Disc Type 2024 & 2032
- Figure 38: Europe Artificial Cervical Disc Industry Volume Share (%), by Disc Type 2024 & 2032
- Figure 39: Europe Artificial Cervical Disc Industry Revenue (Million), by Material Type 2024 & 2032
- Figure 40: Europe Artificial Cervical Disc Industry Volume (K Unit), by Material Type 2024 & 2032
- Figure 41: Europe Artificial Cervical Disc Industry Revenue Share (%), by Material Type 2024 & 2032
- Figure 42: Europe Artificial Cervical Disc Industry Volume Share (%), by Material Type 2024 & 2032
- Figure 43: Europe Artificial Cervical Disc Industry Revenue (Million), by Country 2024 & 2032
- Figure 44: Europe Artificial Cervical Disc Industry Volume (K Unit), by Country 2024 & 2032
- Figure 45: Europe Artificial Cervical Disc Industry Revenue Share (%), by Country 2024 & 2032
- Figure 46: Europe Artificial Cervical Disc Industry Volume Share (%), by Country 2024 & 2032
- Figure 47: Asia Pacific Artificial Cervical Disc Industry Revenue (Million), by Disc Type 2024 & 2032
- Figure 48: Asia Pacific Artificial Cervical Disc Industry Volume (K Unit), by Disc Type 2024 & 2032
- Figure 49: Asia Pacific Artificial Cervical Disc Industry Revenue Share (%), by Disc Type 2024 & 2032
- Figure 50: Asia Pacific Artificial Cervical Disc Industry Volume Share (%), by Disc Type 2024 & 2032
- Figure 51: Asia Pacific Artificial Cervical Disc Industry Revenue (Million), by Material Type 2024 & 2032
- Figure 52: Asia Pacific Artificial Cervical Disc Industry Volume (K Unit), by Material Type 2024 & 2032
- Figure 53: Asia Pacific Artificial Cervical Disc Industry Revenue Share (%), by Material Type 2024 & 2032
- Figure 54: Asia Pacific Artificial Cervical Disc Industry Volume Share (%), by Material Type 2024 & 2032
- Figure 55: Asia Pacific Artificial Cervical Disc Industry Revenue (Million), by Country 2024 & 2032
- Figure 56: Asia Pacific Artificial Cervical Disc Industry Volume (K Unit), by Country 2024 & 2032
- Figure 57: Asia Pacific Artificial Cervical Disc Industry Revenue Share (%), by Country 2024 & 2032
- Figure 58: Asia Pacific Artificial Cervical Disc Industry Volume Share (%), by Country 2024 & 2032
- Figure 59: Middle East and Africa Artificial Cervical Disc Industry Revenue (Million), by Disc Type 2024 & 2032
- Figure 60: Middle East and Africa Artificial Cervical Disc Industry Volume (K Unit), by Disc Type 2024 & 2032
- Figure 61: Middle East and Africa Artificial Cervical Disc Industry Revenue Share (%), by Disc Type 2024 & 2032
- Figure 62: Middle East and Africa Artificial Cervical Disc Industry Volume Share (%), by Disc Type 2024 & 2032
- Figure 63: Middle East and Africa Artificial Cervical Disc Industry Revenue (Million), by Material Type 2024 & 2032
- Figure 64: Middle East and Africa Artificial Cervical Disc Industry Volume (K Unit), by Material Type 2024 & 2032
- Figure 65: Middle East and Africa Artificial Cervical Disc Industry Revenue Share (%), by Material Type 2024 & 2032
- Figure 66: Middle East and Africa Artificial Cervical Disc Industry Volume Share (%), by Material Type 2024 & 2032
- Figure 67: Middle East and Africa Artificial Cervical Disc Industry Revenue (Million), by Country 2024 & 2032
- Figure 68: Middle East and Africa Artificial Cervical Disc Industry Volume (K Unit), by Country 2024 & 2032
- Figure 69: Middle East and Africa Artificial Cervical Disc Industry Revenue Share (%), by Country 2024 & 2032
- Figure 70: Middle East and Africa Artificial Cervical Disc Industry Volume Share (%), by Country 2024 & 2032
- Figure 71: South America Artificial Cervical Disc Industry Revenue (Million), by Disc Type 2024 & 2032
- Figure 72: South America Artificial Cervical Disc Industry Volume (K Unit), by Disc Type 2024 & 2032
- Figure 73: South America Artificial Cervical Disc Industry Revenue Share (%), by Disc Type 2024 & 2032
- Figure 74: South America Artificial Cervical Disc Industry Volume Share (%), by Disc Type 2024 & 2032
- Figure 75: South America Artificial Cervical Disc Industry Revenue (Million), by Material Type 2024 & 2032
- Figure 76: South America Artificial Cervical Disc Industry Volume (K Unit), by Material Type 2024 & 2032
- Figure 77: South America Artificial Cervical Disc Industry Revenue Share (%), by Material Type 2024 & 2032
- Figure 78: South America Artificial Cervical Disc Industry Volume Share (%), by Material Type 2024 & 2032
- Figure 79: South America Artificial Cervical Disc Industry Revenue (Million), by Country 2024 & 2032
- Figure 80: South America Artificial Cervical Disc Industry Volume (K Unit), by Country 2024 & 2032
- Figure 81: South America Artificial Cervical Disc Industry Revenue Share (%), by Country 2024 & 2032
- Figure 82: South America Artificial Cervical Disc Industry Volume Share (%), by Country 2024 & 2032
List of Tables
- Table 1: Global Artificial Cervical Disc Industry Revenue Million Forecast, by Region 2019 & 2032
- Table 2: Global Artificial Cervical Disc Industry Volume K Unit Forecast, by Region 2019 & 2032
- Table 3: Global Artificial Cervical Disc Industry Revenue Million Forecast, by Disc Type 2019 & 2032
- Table 4: Global Artificial Cervical Disc Industry Volume K Unit Forecast, by Disc Type 2019 & 2032
- Table 5: Global Artificial Cervical Disc Industry Revenue Million Forecast, by Material Type 2019 & 2032
- Table 6: Global Artificial Cervical Disc Industry Volume K Unit Forecast, by Material Type 2019 & 2032
- Table 7: Global Artificial Cervical Disc Industry Revenue Million Forecast, by Region 2019 & 2032
- Table 8: Global Artificial Cervical Disc Industry Volume K Unit Forecast, by Region 2019 & 2032
- Table 9: Global Artificial Cervical Disc Industry Revenue Million Forecast, by Country 2019 & 2032
- Table 10: Global Artificial Cervical Disc Industry Volume K Unit Forecast, by Country 2019 & 2032
- Table 11: Global Artificial Cervical Disc Industry Revenue Million Forecast, by Country 2019 & 2032
- Table 12: Global Artificial Cervical Disc Industry Volume K Unit Forecast, by Country 2019 & 2032
- Table 13: Global Artificial Cervical Disc Industry Revenue Million Forecast, by Country 2019 & 2032
- Table 14: Global Artificial Cervical Disc Industry Volume K Unit Forecast, by Country 2019 & 2032
- Table 15: Global Artificial Cervical Disc Industry Revenue Million Forecast, by Country 2019 & 2032
- Table 16: Global Artificial Cervical Disc Industry Volume K Unit Forecast, by Country 2019 & 2032
- Table 17: Global Artificial Cervical Disc Industry Revenue Million Forecast, by Country 2019 & 2032
- Table 18: Global Artificial Cervical Disc Industry Volume K Unit Forecast, by Country 2019 & 2032
- Table 19: Global Artificial Cervical Disc Industry Revenue Million Forecast, by Disc Type 2019 & 2032
- Table 20: Global Artificial Cervical Disc Industry Volume K Unit Forecast, by Disc Type 2019 & 2032
- Table 21: Global Artificial Cervical Disc Industry Revenue Million Forecast, by Material Type 2019 & 2032
- Table 22: Global Artificial Cervical Disc Industry Volume K Unit Forecast, by Material Type 2019 & 2032
- Table 23: Global Artificial Cervical Disc Industry Revenue Million Forecast, by Country 2019 & 2032
- Table 24: Global Artificial Cervical Disc Industry Volume K Unit Forecast, by Country 2019 & 2032
- Table 25: United States Artificial Cervical Disc Industry Revenue (Million) Forecast, by Application 2019 & 2032
- Table 26: United States Artificial Cervical Disc Industry Volume (K Unit) Forecast, by Application 2019 & 2032
- Table 27: Canada Artificial Cervical Disc Industry Revenue (Million) Forecast, by Application 2019 & 2032
- Table 28: Canada Artificial Cervical Disc Industry Volume (K Unit) Forecast, by Application 2019 & 2032
- Table 29: Mexico Artificial Cervical Disc Industry Revenue (Million) Forecast, by Application 2019 & 2032
- Table 30: Mexico Artificial Cervical Disc Industry Volume (K Unit) Forecast, by Application 2019 & 2032
- Table 31: Global Artificial Cervical Disc Industry Revenue Million Forecast, by Disc Type 2019 & 2032
- Table 32: Global Artificial Cervical Disc Industry Volume K Unit Forecast, by Disc Type 2019 & 2032
- Table 33: Global Artificial Cervical Disc Industry Revenue Million Forecast, by Material Type 2019 & 2032
- Table 34: Global Artificial Cervical Disc Industry Volume K Unit Forecast, by Material Type 2019 & 2032
- Table 35: Global Artificial Cervical Disc Industry Revenue Million Forecast, by Country 2019 & 2032
- Table 36: Global Artificial Cervical Disc Industry Volume K Unit Forecast, by Country 2019 & 2032
- Table 37: Germany Artificial Cervical Disc Industry Revenue (Million) Forecast, by Application 2019 & 2032
- Table 38: Germany Artificial Cervical Disc Industry Volume (K Unit) Forecast, by Application 2019 & 2032
- Table 39: United Kingdom Artificial Cervical Disc Industry Revenue (Million) Forecast, by Application 2019 & 2032
- Table 40: United Kingdom Artificial Cervical Disc Industry Volume (K Unit) Forecast, by Application 2019 & 2032
- Table 41: France Artificial Cervical Disc Industry Revenue (Million) Forecast, by Application 2019 & 2032
- Table 42: France Artificial Cervical Disc Industry Volume (K Unit) Forecast, by Application 2019 & 2032
- Table 43: Italy Artificial Cervical Disc Industry Revenue (Million) Forecast, by Application 2019 & 2032
- Table 44: Italy Artificial Cervical Disc Industry Volume (K Unit) Forecast, by Application 2019 & 2032
- Table 45: Spain Artificial Cervical Disc Industry Revenue (Million) Forecast, by Application 2019 & 2032
- Table 46: Spain Artificial Cervical Disc Industry Volume (K Unit) Forecast, by Application 2019 & 2032
- Table 47: Rest of Europe Artificial Cervical Disc Industry Revenue (Million) Forecast, by Application 2019 & 2032
- Table 48: Rest of Europe Artificial Cervical Disc Industry Volume (K Unit) Forecast, by Application 2019 & 2032
- Table 49: Global Artificial Cervical Disc Industry Revenue Million Forecast, by Disc Type 2019 & 2032
- Table 50: Global Artificial Cervical Disc Industry Volume K Unit Forecast, by Disc Type 2019 & 2032
- Table 51: Global Artificial Cervical Disc Industry Revenue Million Forecast, by Material Type 2019 & 2032
- Table 52: Global Artificial Cervical Disc Industry Volume K Unit Forecast, by Material Type 2019 & 2032
- Table 53: Global Artificial Cervical Disc Industry Revenue Million Forecast, by Country 2019 & 2032
- Table 54: Global Artificial Cervical Disc Industry Volume K Unit Forecast, by Country 2019 & 2032
- Table 55: China Artificial Cervical Disc Industry Revenue (Million) Forecast, by Application 2019 & 2032
- Table 56: China Artificial Cervical Disc Industry Volume (K Unit) Forecast, by Application 2019 & 2032
- Table 57: Japan Artificial Cervical Disc Industry Revenue (Million) Forecast, by Application 2019 & 2032
- Table 58: Japan Artificial Cervical Disc Industry Volume (K Unit) Forecast, by Application 2019 & 2032
- Table 59: India Artificial Cervical Disc Industry Revenue (Million) Forecast, by Application 2019 & 2032
- Table 60: India Artificial Cervical Disc Industry Volume (K Unit) Forecast, by Application 2019 & 2032
- Table 61: Australia Artificial Cervical Disc Industry Revenue (Million) Forecast, by Application 2019 & 2032
- Table 62: Australia Artificial Cervical Disc Industry Volume (K Unit) Forecast, by Application 2019 & 2032
- Table 63: South Korea Artificial Cervical Disc Industry Revenue (Million) Forecast, by Application 2019 & 2032
- Table 64: South Korea Artificial Cervical Disc Industry Volume (K Unit) Forecast, by Application 2019 & 2032
- Table 65: Rest of Asia Pacific Artificial Cervical Disc Industry Revenue (Million) Forecast, by Application 2019 & 2032
- Table 66: Rest of Asia Pacific Artificial Cervical Disc Industry Volume (K Unit) Forecast, by Application 2019 & 2032
- Table 67: Global Artificial Cervical Disc Industry Revenue Million Forecast, by Disc Type 2019 & 2032
- Table 68: Global Artificial Cervical Disc Industry Volume K Unit Forecast, by Disc Type 2019 & 2032
- Table 69: Global Artificial Cervical Disc Industry Revenue Million Forecast, by Material Type 2019 & 2032
- Table 70: Global Artificial Cervical Disc Industry Volume K Unit Forecast, by Material Type 2019 & 2032
- Table 71: Global Artificial Cervical Disc Industry Revenue Million Forecast, by Country 2019 & 2032
- Table 72: Global Artificial Cervical Disc Industry Volume K Unit Forecast, by Country 2019 & 2032
- Table 73: GCC Artificial Cervical Disc Industry Revenue (Million) Forecast, by Application 2019 & 2032
- Table 74: GCC Artificial Cervical Disc Industry Volume (K Unit) Forecast, by Application 2019 & 2032
- Table 75: South Africa Artificial Cervical Disc Industry Revenue (Million) Forecast, by Application 2019 & 2032
- Table 76: South Africa Artificial Cervical Disc Industry Volume (K Unit) Forecast, by Application 2019 & 2032
- Table 77: Rest of Middle East and Africa Artificial Cervical Disc Industry Revenue (Million) Forecast, by Application 2019 & 2032
- Table 78: Rest of Middle East and Africa Artificial Cervical Disc Industry Volume (K Unit) Forecast, by Application 2019 & 2032
- Table 79: Global Artificial Cervical Disc Industry Revenue Million Forecast, by Disc Type 2019 & 2032
- Table 80: Global Artificial Cervical Disc Industry Volume K Unit Forecast, by Disc Type 2019 & 2032
- Table 81: Global Artificial Cervical Disc Industry Revenue Million Forecast, by Material Type 2019 & 2032
- Table 82: Global Artificial Cervical Disc Industry Volume K Unit Forecast, by Material Type 2019 & 2032
- Table 83: Global Artificial Cervical Disc Industry Revenue Million Forecast, by Country 2019 & 2032
- Table 84: Global Artificial Cervical Disc Industry Volume K Unit Forecast, by Country 2019 & 2032
- Table 85: Brazil Artificial Cervical Disc Industry Revenue (Million) Forecast, by Application 2019 & 2032
- Table 86: Brazil Artificial Cervical Disc Industry Volume (K Unit) Forecast, by Application 2019 & 2032
- Table 87: Argentina Artificial Cervical Disc Industry Revenue (Million) Forecast, by Application 2019 & 2032
- Table 88: Argentina Artificial Cervical Disc Industry Volume (K Unit) Forecast, by Application 2019 & 2032
- Table 89: Rest of South America Artificial Cervical Disc Industry Revenue (Million) Forecast, by Application 2019 & 2032
- Table 90: Rest of South America Artificial Cervical Disc Industry Volume (K Unit) Forecast, by Application 2019 & 2032
Frequently Asked Questions
1. What is the projected Compound Annual Growth Rate (CAGR) of the Artificial Cervical Disc Industry?
The projected CAGR is approximately 12.50%.
2. Which companies are prominent players in the Artificial Cervical Disc Industry?
Key companies in the market include Zimmer Biomet, Centinel Spine LLC, Medtronic PLC, Prodorth Spine, Globus Medical, Orthofix Medical Inc, B Braun Melsungen, Synergy Spine Solutions Inc, Spineart SA, NuVasive Inc, AxioMed LLC.
3. What are the main segments of the Artificial Cervical Disc Industry?
The market segments include Disc Type, Material Type.
4. Can you provide details about the market size?
The market size is estimated to be USD XX Million as of 2022.
5. What are some drivers contributing to market growth?
Growing Burden of Spine Related Diseases; Increasing Research and Development Activities in Relation to Spine Technologies; Growing Geriatric Population and Increasing Preference for Minimally Invasive Surgeries.
6. What are the notable trends driving market growth?
Cervical Artificial Disc Segment is Expected to Hold a Significant Market Share Over the Forecast Period.
7. Are there any restraints impacting market growth?
Reimbursement Issues; High Cost of Procedures.
8. Can you provide examples of recent developments in the market?
In November 2022, Centinel Spine, LLC announced the first implantation of its prodisc C SK, a cervical artificial disc.
9. What pricing options are available for accessing the report?
Pricing options include single-user, multi-user, and enterprise licenses priced at USD 4750, USD 5250, and USD 8750 respectively.
10. Is the market size provided in terms of value or volume?
The market size is provided in terms of value, measured in Million and volume, measured in K Unit.
11. Are there any specific market keywords associated with the report?
Yes, the market keyword associated with the report is "Artificial Cervical Disc Industry," which aids in identifying and referencing the specific market segment covered.
12. How do I determine which pricing option suits my needs best?
The pricing options vary based on user requirements and access needs. Individual users may opt for single-user licenses, while businesses requiring broader access may choose multi-user or enterprise licenses for cost-effective access to the report.
13. Are there any additional resources or data provided in the Artificial Cervical Disc Industry report?
While the report offers comprehensive insights, it's advisable to review the specific contents or supplementary materials provided to ascertain if additional resources or data are available.
14. How can I stay updated on further developments or reports in the Artificial Cervical Disc Industry?
To stay informed about further developments, trends, and reports in the Artificial Cervical Disc Industry, consider subscribing to industry newsletters, following relevant companies and organizations, or regularly checking reputable industry news sources and publications.
Methodology
Step 1 - Identification of Relevant Samples Size from Population Database


Step 2 - Approaches for Defining Global Market Size (Value, Volume* & Price*)

Note*: In applicable scenarios
Step 3 - Data Sources
Primary Research
- Web Analytics
- Survey Reports
- Research Institute
- Latest Research Reports
- Opinion Leaders
Secondary Research
- Annual Reports
- White Paper
- Latest Press Release
- Industry Association
- Paid Database
- Investor Presentations

Step 4 - Data Triangulation
Involves using different sources of information in order to increase the validity of a study
These sources are likely to be stakeholders in a program - participants, other researchers, program staff, other community members, and so on.
Then we put all data in single framework & apply various statistical tools to find out the dynamic on the market.
During the analysis stage, feedback from the stakeholder groups would be compared to determine areas of agreement as well as areas of divergence


