
Key Insights
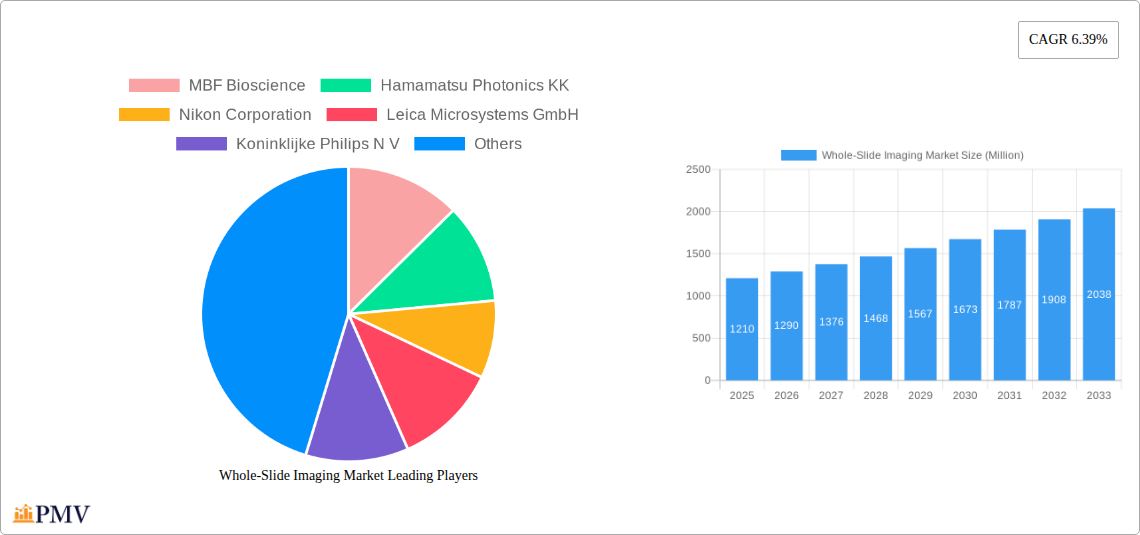
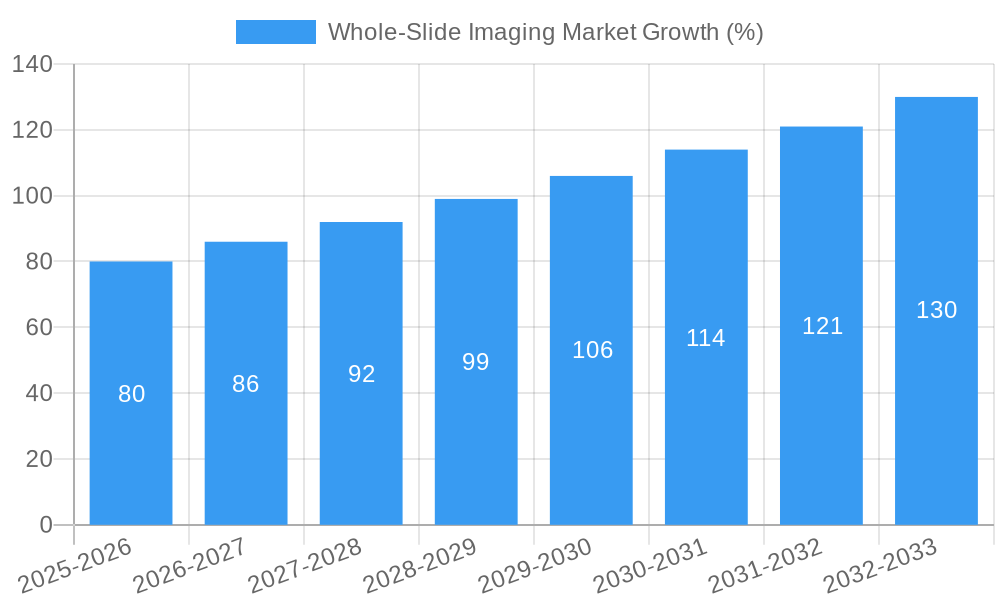
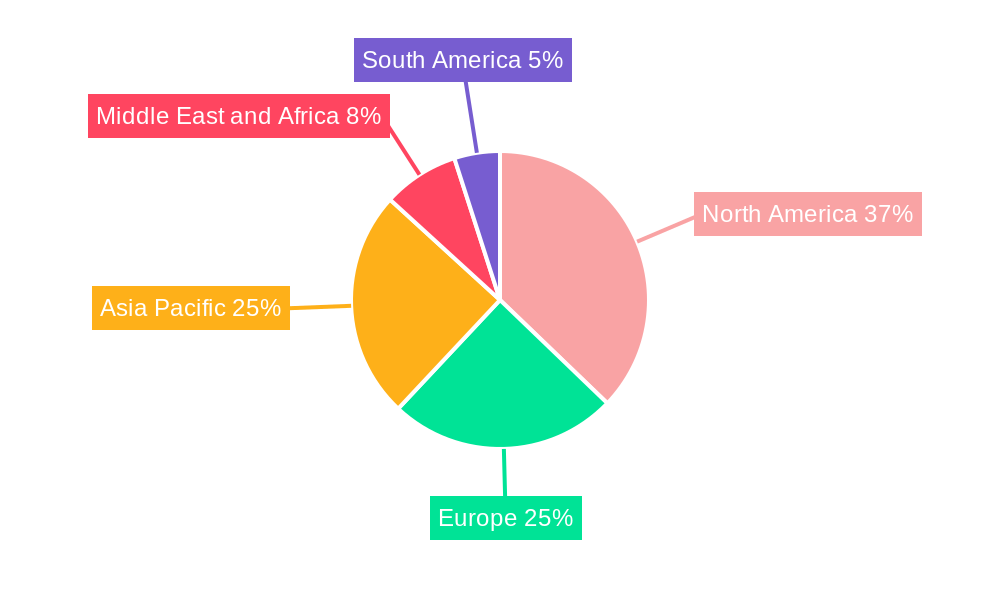
The global whole-slide imaging (WSI) market, valued at $1.21 billion in 2025, is projected to experience robust growth, driven by the increasing adoption of digital pathology in healthcare. This shift is fueled by several key factors: the rising prevalence of chronic diseases necessitating faster and more accurate diagnosis; the growing demand for telepathology, enabling remote consultations and expert review; and advancements in image analysis software offering improved diagnostic capabilities. Furthermore, the integration of artificial intelligence (AI) and machine learning (ML) algorithms into WSI systems is enhancing diagnostic accuracy and efficiency, further propelling market expansion. The market is segmented by technology (scanners, IT infrastructure, viewers, image management systems), application (telepathology, cytopathology, immunohistochemistry, hematopathology), and end-user (academic institutions, research facilities, hospitals). North America currently holds a significant market share due to advanced healthcare infrastructure and early adoption of digital pathology. However, Asia Pacific is anticipated to witness substantial growth in the coming years, driven by increasing healthcare investments and rising awareness of advanced diagnostic techniques. Competition within the WSI market is intense, with established players like Leica Microsystems, Nikon, and Hamamatsu Photonics competing with emerging companies offering innovative solutions.
The continued growth of the WSI market hinges on overcoming certain challenges. High initial investment costs for WSI systems can be a barrier for smaller healthcare providers. Furthermore, the need for robust and secure data management infrastructure, along with the requirement for comprehensive training and expertise in utilizing WSI technology, are significant factors influencing adoption rates. Nevertheless, ongoing technological advancements, decreasing costs, and increasing government support for digital pathology initiatives are expected to mitigate these restraints. The forecast period (2025-2033) will likely witness increased consolidation within the market, with larger players acquiring smaller companies to expand their product portfolios and geographical reach. This dynamic landscape suggests a promising outlook for the WSI market, with significant potential for growth and innovation in the years to come.
Whole-Slide Imaging Market: A Comprehensive Report (2019-2033)
This comprehensive report provides an in-depth analysis of the Whole-Slide Imaging market, offering valuable insights for stakeholders across the industry. With a study period spanning 2019-2033, a base year of 2025, and a forecast period of 2025-2033, this report leverages historical data (2019-2024) to predict future market trends and growth opportunities. The market is segmented by technology (Scanners, IT Infrastructure, Viewer, Image Management System), application (Telepathology, Cytopathology, Immunohistochemistry, Hematopathology), and end-user (Academic Institute, Research, Others). Key players analyzed include MBF Bioscience, Hamamatsu Photonics KK, Nikon Corporation, Leica Microsystems GmbH, Koninklijke Philips N V, 3Dhistech, Visiopharm, Indica Labs, Molecular Machines & Industries, Mikroscan Technologies Inc, Olympus Corporation, and Akoya Biosciences. The report projects a market value of xx Million by 2033, demonstrating significant growth potential.
Whole-Slide Imaging Market Market Structure & Competitive Dynamics
The Whole-Slide Imaging market exhibits a moderately consolidated structure, with several major players holding significant market share. The market is characterized by intense competition, driven by ongoing technological advancements and a growing demand for digital pathology solutions. Innovation ecosystems are vibrant, with continuous development of high-resolution scanners, advanced image analysis software, and cloud-based platforms. Regulatory frameworks, particularly those related to data privacy and medical device approvals, play a crucial role in shaping market dynamics. Product substitutes, while limited, include traditional microscopy techniques, but the trend is strongly towards digital solutions. End-user trends demonstrate a shift towards personalized medicine and remote diagnostics, further fueling market growth. M&A activity has been notable, with several significant deals impacting market consolidation and technology integration. For example, while exact figures aren't available, several acquisitions in the past few years (2019-2024) had estimated values ranging from xx Million to xx Million. Key players are actively pursuing strategic partnerships and collaborations to enhance their product portfolios and expand market reach. Market share analysis reveals that the top 5 players likely hold approximately 60% of the market, with the remaining share distributed among numerous smaller companies.
Whole-Slide Imaging Market Industry Trends & Insights
The Whole-Slide Imaging market is experiencing robust growth, driven by several key factors. The increasing adoption of digital pathology in healthcare settings is a primary driver, owing to its benefits in improving diagnostic accuracy, efficiency, and collaboration. Technological advancements, such as the development of higher-resolution scanners and sophisticated image analysis algorithms, are further accelerating market growth. The rising prevalence of chronic diseases, coupled with the growing demand for personalized medicine, is creating a surge in demand for whole-slide imaging systems. Consumer preferences are shifting towards faster turnaround times, improved diagnostic accuracy, and better data management capabilities. The market is witnessing a gradual shift towards cloud-based solutions and AI-powered image analysis tools. The competitive landscape is dynamic, with ongoing innovation and strategic partnerships shaping market dynamics. The Compound Annual Growth Rate (CAGR) during the forecast period (2025-2033) is estimated to be xx%, reflecting the market's strong growth trajectory. Market penetration rates are steadily increasing, particularly in developed regions. The increasing adoption of telepathology is also a major driver, contributing to xx% of the overall market growth.
Dominant Markets & Segments in Whole-Slide Imaging Market
The North American region currently dominates the Whole-Slide Imaging market, driven by factors such as robust healthcare infrastructure, high technological adoption, and substantial research funding. Within North America, the United States holds the largest market share.
- Key Drivers in North America:
- Advanced healthcare infrastructure
- High adoption of digital technologies
- Extensive research and development activities
- Favorable regulatory environment
- Increased investment in precision medicine initiatives
In terms of segmentation:
- By Technology: Scanners segment is currently the largest, followed by Image Management Systems. The IT infrastructure segment is expected to witness substantial growth due to increasing adoption of cloud-based solutions.
- By Application: Immunohistochemistry and Hematopathology are the leading application segments, driven by their substantial use in cancer diagnostics. The Telepathology segment demonstrates significant growth potential as remote diagnostics gain acceptance.
- By End User: Academic Institutes and Research institutions constitute a major portion of the market. The growth of research activity and funding across various diseases is driving significant demand. The Others segment includes smaller hospitals and clinics that are progressively adopting the technology.
Europe and Asia-Pacific are expected to exhibit significant growth in the coming years, driven by expanding healthcare infrastructure and increasing awareness about the benefits of digital pathology.
Whole-Slide Imaging Market Product Innovations
Recent advancements in whole-slide imaging technology include the development of higher-resolution scanners capable of capturing significantly more detail. This improved resolution is driving accuracy in diagnosis. Furthermore, AI-powered image analysis software is gaining traction, offering automated feature extraction and disease classification. Cloud-based solutions are streamlining workflow, allowing for collaborative diagnostics and remote access to images. These advancements improve efficiency and reduce costs across pathology workflows, resulting in a positive market fit and enhanced competitive advantages for companies incorporating these features.
Report Segmentation & Scope
This report provides a granular segmentation of the Whole-Slide Imaging market across various aspects:
By Technology: The market is divided into Scanners, IT Infrastructure, Viewer, and Image Management System. Each segment’s growth projection varies, with Scanners expected to maintain the largest market share throughout the forecast period. The IT infrastructure segment shows significant growth potential. Competitive dynamics within each segment are detailed. Market sizes for each segment are provided for each year.
By Application: The market is segmented into Telepathology, Cytopathology, Immunohistochemistry, and Hematopathology. Growth projections show varying growth rates for each application based on market penetration and technological advancements. Immunohistochemistry and Hematopathology hold significant market shares, while Telepathology shows promising future growth. The competitive landscape is analyzed for each application segment.
By End User: The report segments the market by Academic Institute, Research, and Others. The Academic Institute and Research sectors are key growth drivers, while the "Others" segment includes smaller clinics and hospitals showcasing increasing adoption rates. Market size and projections for each segment are presented.
Key Drivers of Whole-Slide Imaging Market Growth
Several factors contribute to the Whole-Slide Imaging market's robust growth. Technological advancements, such as AI-powered image analysis and higher-resolution scanners, enhance diagnostic accuracy and efficiency. Rising prevalence of chronic diseases necessitates increased diagnostic capabilities, driving demand. Favorable regulatory policies and increased funding for research and development further stimulate market expansion. The increasing adoption of telepathology, enabling remote diagnostics, contributes to market expansion. Lastly, cost-effectiveness compared to traditional methods makes Whole-Slide Imaging increasingly attractive to healthcare providers.
Challenges in the Whole-Slide Imaging Market Sector
Despite significant growth potential, the Whole-Slide Imaging market faces challenges. High initial investment costs for equipment and software can be a barrier for smaller clinics and hospitals. Data security and privacy concerns regarding patient information require robust solutions. The complexity of integrating new technologies into existing workflows can also hinder adoption. Intense competition among established players and new entrants can impact profitability. Finally, regulatory hurdles and variations in reimbursement policies across different regions pose additional challenges.
Leading Players in the Whole-Slide Imaging Market Market
- MBF Bioscience
- Hamamatsu Photonics KK
- Nikon Corporation
- Leica Microsystems GmbH
- Koninklijke Philips N V
- 3Dhistech
- Visiopharm
- Indica Labs
- Molecular Machines & Industries
- Mikroscan Technologies Inc
- Olympus Corporation
- Akoya Biosciences
Key Developments in Whole-Slide Imaging Market Sector
March 2023: Pramana, Inc. partnered with PathPresenter to streamline digital pathology workflows, enhancing user experience for labs adopting digital pathology as a service. This collaboration accelerates market adoption of integrated solutions.
March 2023: Hamamatsu Photonics KK signed a multi-year distribution agreement with Siemens Healthineers for its NanoZoomer whole slide scanners, expanding its market reach in the Americas and Europe. This strategic partnership significantly boosts market penetration for Hamamatsu and contributes to the overall growth of the digital pathology market.
Strategic Whole-Slide Imaging Market Market Outlook
The Whole-Slide Imaging market presents significant growth opportunities driven by technological advancements, increasing adoption of digital pathology, and expanding healthcare infrastructure globally. Strategic partnerships and collaborations will play a key role in shaping the market landscape. Companies that focus on developing AI-powered image analysis tools and cloud-based solutions are poised for significant growth. The integration of whole-slide imaging with other diagnostic technologies will also create new opportunities. The continued development of cost-effective solutions will broaden market accessibility, further fueling market expansion in the coming years.
Whole-Slide Imaging Market Segmentation
-
1. Technology
- 1.1. Scanners
- 1.2. IT Infrastructure
- 1.3. Viewer
- 1.4. Image Management System
-
2. Application
- 2.1. Telepathology
- 2.2. Cytopathology
- 2.3. Immunohistochemistry
- 2.4. Hematopathology
-
3. End User
- 3.1. Academic Institute
- 3.2. Research
- 3.3. Others
Whole-Slide Imaging Market Segmentation By Geography
-
1. North America
- 1.1. United States
- 1.2. Canada
- 1.3. Mexico
-
2. Europe
- 2.1. Germany
- 2.2. United Kingdom
- 2.3. France
- 2.4. Italy
- 2.5. Spain
- 2.6. Rest of Europe
-
3. Asia Pacific
- 3.1. China
- 3.2. Japan
- 3.3. India
- 3.4. Australia
- 3.5. South korea
- 3.6. Rest of Asia Pacific
-
4. Middle East and Africa
- 4.1. GCC
- 4.2. South Africa
- 4.3. Rest of Middle East and Africa
-
5. South America
- 5.1. Brazil
- 5.2. Argentina
- 5.3. Rest of South America
Whole-Slide Imaging Market REPORT HIGHLIGHTS
| Aspects | Details |
|---|---|
| Study Period | 2019-2033 |
| Base Year | 2024 |
| Estimated Year | 2025 |
| Forecast Period | 2025-2033 |
| Historical Period | 2019-2024 |
| Growth Rate | CAGR of 6.39% from 2019-2033 |
| Segmentation |
|
Table of Contents
- 1. Introduction
- 1.1. Research Scope
- 1.2. Market Segmentation
- 1.3. Research Methodology
- 1.4. Definitions and Assumptions
- 2. Executive Summary
- 2.1. Introduction
- 3. Market Dynamics
- 3.1. Introduction
- 3.2. Market Drivers
- 3.2.1. Growing Popularity of Virtual Slides as Compared to Physical Slides; Technological Advancements in Whole Slide Imaging; Increasing Research in Drug Discovery
- 3.3. Market Restrains
- 3.3.1. Stringent Regulatory Approvals; High Cost of Whole Slide Imaging Systems
- 3.4. Market Trends
- 3.4.1. Telepathology Segment is Expected to Grow Significantly Over the Forecast Period
- 4. Market Factor Analysis
- 4.1. Porters Five Forces
- 4.2. Supply/Value Chain
- 4.3. PESTEL analysis
- 4.4. Market Entropy
- 4.5. Patent/Trademark Analysis
- 5. Global Whole-Slide Imaging Market Analysis, Insights and Forecast, 2019-2031
- 5.1. Market Analysis, Insights and Forecast - by Technology
- 5.1.1. Scanners
- 5.1.2. IT Infrastructure
- 5.1.3. Viewer
- 5.1.4. Image Management System
- 5.2. Market Analysis, Insights and Forecast - by Application
- 5.2.1. Telepathology
- 5.2.2. Cytopathology
- 5.2.3. Immunohistochemistry
- 5.2.4. Hematopathology
- 5.3. Market Analysis, Insights and Forecast - by End User
- 5.3.1. Academic Institute
- 5.3.2. Research
- 5.3.3. Others
- 5.4. Market Analysis, Insights and Forecast - by Region
- 5.4.1. North America
- 5.4.2. Europe
- 5.4.3. Asia Pacific
- 5.4.4. Middle East and Africa
- 5.4.5. South America
- 5.1. Market Analysis, Insights and Forecast - by Technology
- 6. North America Whole-Slide Imaging Market Analysis, Insights and Forecast, 2019-2031
- 6.1. Market Analysis, Insights and Forecast - by Technology
- 6.1.1. Scanners
- 6.1.2. IT Infrastructure
- 6.1.3. Viewer
- 6.1.4. Image Management System
- 6.2. Market Analysis, Insights and Forecast - by Application
- 6.2.1. Telepathology
- 6.2.2. Cytopathology
- 6.2.3. Immunohistochemistry
- 6.2.4. Hematopathology
- 6.3. Market Analysis, Insights and Forecast - by End User
- 6.3.1. Academic Institute
- 6.3.2. Research
- 6.3.3. Others
- 6.1. Market Analysis, Insights and Forecast - by Technology
- 7. Europe Whole-Slide Imaging Market Analysis, Insights and Forecast, 2019-2031
- 7.1. Market Analysis, Insights and Forecast - by Technology
- 7.1.1. Scanners
- 7.1.2. IT Infrastructure
- 7.1.3. Viewer
- 7.1.4. Image Management System
- 7.2. Market Analysis, Insights and Forecast - by Application
- 7.2.1. Telepathology
- 7.2.2. Cytopathology
- 7.2.3. Immunohistochemistry
- 7.2.4. Hematopathology
- 7.3. Market Analysis, Insights and Forecast - by End User
- 7.3.1. Academic Institute
- 7.3.2. Research
- 7.3.3. Others
- 7.1. Market Analysis, Insights and Forecast - by Technology
- 8. Asia Pacific Whole-Slide Imaging Market Analysis, Insights and Forecast, 2019-2031
- 8.1. Market Analysis, Insights and Forecast - by Technology
- 8.1.1. Scanners
- 8.1.2. IT Infrastructure
- 8.1.3. Viewer
- 8.1.4. Image Management System
- 8.2. Market Analysis, Insights and Forecast - by Application
- 8.2.1. Telepathology
- 8.2.2. Cytopathology
- 8.2.3. Immunohistochemistry
- 8.2.4. Hematopathology
- 8.3. Market Analysis, Insights and Forecast - by End User
- 8.3.1. Academic Institute
- 8.3.2. Research
- 8.3.3. Others
- 8.1. Market Analysis, Insights and Forecast - by Technology
- 9. Middle East and Africa Whole-Slide Imaging Market Analysis, Insights and Forecast, 2019-2031
- 9.1. Market Analysis, Insights and Forecast - by Technology
- 9.1.1. Scanners
- 9.1.2. IT Infrastructure
- 9.1.3. Viewer
- 9.1.4. Image Management System
- 9.2. Market Analysis, Insights and Forecast - by Application
- 9.2.1. Telepathology
- 9.2.2. Cytopathology
- 9.2.3. Immunohistochemistry
- 9.2.4. Hematopathology
- 9.3. Market Analysis, Insights and Forecast - by End User
- 9.3.1. Academic Institute
- 9.3.2. Research
- 9.3.3. Others
- 9.1. Market Analysis, Insights and Forecast - by Technology
- 10. South America Whole-Slide Imaging Market Analysis, Insights and Forecast, 2019-2031
- 10.1. Market Analysis, Insights and Forecast - by Technology
- 10.1.1. Scanners
- 10.1.2. IT Infrastructure
- 10.1.3. Viewer
- 10.1.4. Image Management System
- 10.2. Market Analysis, Insights and Forecast - by Application
- 10.2.1. Telepathology
- 10.2.2. Cytopathology
- 10.2.3. Immunohistochemistry
- 10.2.4. Hematopathology
- 10.3. Market Analysis, Insights and Forecast - by End User
- 10.3.1. Academic Institute
- 10.3.2. Research
- 10.3.3. Others
- 10.1. Market Analysis, Insights and Forecast - by Technology
- 11. North America Whole-Slide Imaging Market Analysis, Insights and Forecast, 2019-2031
- 11.1. Market Analysis, Insights and Forecast - By Country/Sub-region
- 11.1.1 United States
- 11.1.2 Canada
- 11.1.3 Mexico
- 12. Europe Whole-Slide Imaging Market Analysis, Insights and Forecast, 2019-2031
- 12.1. Market Analysis, Insights and Forecast - By Country/Sub-region
- 12.1.1 Germany
- 12.1.2 United Kingdom
- 12.1.3 France
- 12.1.4 Italy
- 12.1.5 Spain
- 12.1.6 Rest of Europe
- 13. Asia Pacific Whole-Slide Imaging Market Analysis, Insights and Forecast, 2019-2031
- 13.1. Market Analysis, Insights and Forecast - By Country/Sub-region
- 13.1.1 China
- 13.1.2 Japan
- 13.1.3 India
- 13.1.4 Australia
- 13.1.5 South korea
- 13.1.6 Rest of Asia Pacific
- 14. Middle East and Africa Whole-Slide Imaging Market Analysis, Insights and Forecast, 2019-2031
- 14.1. Market Analysis, Insights and Forecast - By Country/Sub-region
- 14.1.1 GCC
- 14.1.2 South Africa
- 14.1.3 Rest of Middle East and Africa
- 15. South America Whole-Slide Imaging Market Analysis, Insights and Forecast, 2019-2031
- 15.1. Market Analysis, Insights and Forecast - By Country/Sub-region
- 15.1.1 Brazil
- 15.1.2 Argentina
- 15.1.3 Rest of South America
- 16. Competitive Analysis
- 16.1. Global Market Share Analysis 2024
- 16.2. Company Profiles
- 16.2.1 MBF Bioscience
- 16.2.1.1. Overview
- 16.2.1.2. Products
- 16.2.1.3. SWOT Analysis
- 16.2.1.4. Recent Developments
- 16.2.1.5. Financials (Based on Availability)
- 16.2.2 Hamamatsu Photonics KK
- 16.2.2.1. Overview
- 16.2.2.2. Products
- 16.2.2.3. SWOT Analysis
- 16.2.2.4. Recent Developments
- 16.2.2.5. Financials (Based on Availability)
- 16.2.3 Nikon Corporation
- 16.2.3.1. Overview
- 16.2.3.2. Products
- 16.2.3.3. SWOT Analysis
- 16.2.3.4. Recent Developments
- 16.2.3.5. Financials (Based on Availability)
- 16.2.4 Leica Microsystems GmbH
- 16.2.4.1. Overview
- 16.2.4.2. Products
- 16.2.4.3. SWOT Analysis
- 16.2.4.4. Recent Developments
- 16.2.4.5. Financials (Based on Availability)
- 16.2.5 Koninklijke Philips N V
- 16.2.5.1. Overview
- 16.2.5.2. Products
- 16.2.5.3. SWOT Analysis
- 16.2.5.4. Recent Developments
- 16.2.5.5. Financials (Based on Availability)
- 16.2.6 3Dhistech
- 16.2.6.1. Overview
- 16.2.6.2. Products
- 16.2.6.3. SWOT Analysis
- 16.2.6.4. Recent Developments
- 16.2.6.5. Financials (Based on Availability)
- 16.2.7 Visiopharm
- 16.2.7.1. Overview
- 16.2.7.2. Products
- 16.2.7.3. SWOT Analysis
- 16.2.7.4. Recent Developments
- 16.2.7.5. Financials (Based on Availability)
- 16.2.8 Indica Labs
- 16.2.8.1. Overview
- 16.2.8.2. Products
- 16.2.8.3. SWOT Analysis
- 16.2.8.4. Recent Developments
- 16.2.8.5. Financials (Based on Availability)
- 16.2.9 Molecular Machines & Industries
- 16.2.9.1. Overview
- 16.2.9.2. Products
- 16.2.9.3. SWOT Analysis
- 16.2.9.4. Recent Developments
- 16.2.9.5. Financials (Based on Availability)
- 16.2.10 Mikroscan Technologies Inc
- 16.2.10.1. Overview
- 16.2.10.2. Products
- 16.2.10.3. SWOT Analysis
- 16.2.10.4. Recent Developments
- 16.2.10.5. Financials (Based on Availability)
- 16.2.11 Olympus Corporation
- 16.2.11.1. Overview
- 16.2.11.2. Products
- 16.2.11.3. SWOT Analysis
- 16.2.11.4. Recent Developments
- 16.2.11.5. Financials (Based on Availability)
- 16.2.12 Akoya Biosciences
- 16.2.12.1. Overview
- 16.2.12.2. Products
- 16.2.12.3. SWOT Analysis
- 16.2.12.4. Recent Developments
- 16.2.12.5. Financials (Based on Availability)
- 16.2.1 MBF Bioscience
List of Figures
- Figure 1: Global Whole-Slide Imaging Market Revenue Breakdown (Million, %) by Region 2024 & 2032
- Figure 2: Global Whole-Slide Imaging Market Volume Breakdown (K Unit, %) by Region 2024 & 2032
- Figure 3: North America Whole-Slide Imaging Market Revenue (Million), by Country 2024 & 2032
- Figure 4: North America Whole-Slide Imaging Market Volume (K Unit), by Country 2024 & 2032
- Figure 5: North America Whole-Slide Imaging Market Revenue Share (%), by Country 2024 & 2032
- Figure 6: North America Whole-Slide Imaging Market Volume Share (%), by Country 2024 & 2032
- Figure 7: Europe Whole-Slide Imaging Market Revenue (Million), by Country 2024 & 2032
- Figure 8: Europe Whole-Slide Imaging Market Volume (K Unit), by Country 2024 & 2032
- Figure 9: Europe Whole-Slide Imaging Market Revenue Share (%), by Country 2024 & 2032
- Figure 10: Europe Whole-Slide Imaging Market Volume Share (%), by Country 2024 & 2032
- Figure 11: Asia Pacific Whole-Slide Imaging Market Revenue (Million), by Country 2024 & 2032
- Figure 12: Asia Pacific Whole-Slide Imaging Market Volume (K Unit), by Country 2024 & 2032
- Figure 13: Asia Pacific Whole-Slide Imaging Market Revenue Share (%), by Country 2024 & 2032
- Figure 14: Asia Pacific Whole-Slide Imaging Market Volume Share (%), by Country 2024 & 2032
- Figure 15: Middle East and Africa Whole-Slide Imaging Market Revenue (Million), by Country 2024 & 2032
- Figure 16: Middle East and Africa Whole-Slide Imaging Market Volume (K Unit), by Country 2024 & 2032
- Figure 17: Middle East and Africa Whole-Slide Imaging Market Revenue Share (%), by Country 2024 & 2032
- Figure 18: Middle East and Africa Whole-Slide Imaging Market Volume Share (%), by Country 2024 & 2032
- Figure 19: South America Whole-Slide Imaging Market Revenue (Million), by Country 2024 & 2032
- Figure 20: South America Whole-Slide Imaging Market Volume (K Unit), by Country 2024 & 2032
- Figure 21: South America Whole-Slide Imaging Market Revenue Share (%), by Country 2024 & 2032
- Figure 22: South America Whole-Slide Imaging Market Volume Share (%), by Country 2024 & 2032
- Figure 23: North America Whole-Slide Imaging Market Revenue (Million), by Technology 2024 & 2032
- Figure 24: North America Whole-Slide Imaging Market Volume (K Unit), by Technology 2024 & 2032
- Figure 25: North America Whole-Slide Imaging Market Revenue Share (%), by Technology 2024 & 2032
- Figure 26: North America Whole-Slide Imaging Market Volume Share (%), by Technology 2024 & 2032
- Figure 27: North America Whole-Slide Imaging Market Revenue (Million), by Application 2024 & 2032
- Figure 28: North America Whole-Slide Imaging Market Volume (K Unit), by Application 2024 & 2032
- Figure 29: North America Whole-Slide Imaging Market Revenue Share (%), by Application 2024 & 2032
- Figure 30: North America Whole-Slide Imaging Market Volume Share (%), by Application 2024 & 2032
- Figure 31: North America Whole-Slide Imaging Market Revenue (Million), by End User 2024 & 2032
- Figure 32: North America Whole-Slide Imaging Market Volume (K Unit), by End User 2024 & 2032
- Figure 33: North America Whole-Slide Imaging Market Revenue Share (%), by End User 2024 & 2032
- Figure 34: North America Whole-Slide Imaging Market Volume Share (%), by End User 2024 & 2032
- Figure 35: North America Whole-Slide Imaging Market Revenue (Million), by Country 2024 & 2032
- Figure 36: North America Whole-Slide Imaging Market Volume (K Unit), by Country 2024 & 2032
- Figure 37: North America Whole-Slide Imaging Market Revenue Share (%), by Country 2024 & 2032
- Figure 38: North America Whole-Slide Imaging Market Volume Share (%), by Country 2024 & 2032
- Figure 39: Europe Whole-Slide Imaging Market Revenue (Million), by Technology 2024 & 2032
- Figure 40: Europe Whole-Slide Imaging Market Volume (K Unit), by Technology 2024 & 2032
- Figure 41: Europe Whole-Slide Imaging Market Revenue Share (%), by Technology 2024 & 2032
- Figure 42: Europe Whole-Slide Imaging Market Volume Share (%), by Technology 2024 & 2032
- Figure 43: Europe Whole-Slide Imaging Market Revenue (Million), by Application 2024 & 2032
- Figure 44: Europe Whole-Slide Imaging Market Volume (K Unit), by Application 2024 & 2032
- Figure 45: Europe Whole-Slide Imaging Market Revenue Share (%), by Application 2024 & 2032
- Figure 46: Europe Whole-Slide Imaging Market Volume Share (%), by Application 2024 & 2032
- Figure 47: Europe Whole-Slide Imaging Market Revenue (Million), by End User 2024 & 2032
- Figure 48: Europe Whole-Slide Imaging Market Volume (K Unit), by End User 2024 & 2032
- Figure 49: Europe Whole-Slide Imaging Market Revenue Share (%), by End User 2024 & 2032
- Figure 50: Europe Whole-Slide Imaging Market Volume Share (%), by End User 2024 & 2032
- Figure 51: Europe Whole-Slide Imaging Market Revenue (Million), by Country 2024 & 2032
- Figure 52: Europe Whole-Slide Imaging Market Volume (K Unit), by Country 2024 & 2032
- Figure 53: Europe Whole-Slide Imaging Market Revenue Share (%), by Country 2024 & 2032
- Figure 54: Europe Whole-Slide Imaging Market Volume Share (%), by Country 2024 & 2032
- Figure 55: Asia Pacific Whole-Slide Imaging Market Revenue (Million), by Technology 2024 & 2032
- Figure 56: Asia Pacific Whole-Slide Imaging Market Volume (K Unit), by Technology 2024 & 2032
- Figure 57: Asia Pacific Whole-Slide Imaging Market Revenue Share (%), by Technology 2024 & 2032
- Figure 58: Asia Pacific Whole-Slide Imaging Market Volume Share (%), by Technology 2024 & 2032
- Figure 59: Asia Pacific Whole-Slide Imaging Market Revenue (Million), by Application 2024 & 2032
- Figure 60: Asia Pacific Whole-Slide Imaging Market Volume (K Unit), by Application 2024 & 2032
- Figure 61: Asia Pacific Whole-Slide Imaging Market Revenue Share (%), by Application 2024 & 2032
- Figure 62: Asia Pacific Whole-Slide Imaging Market Volume Share (%), by Application 2024 & 2032
- Figure 63: Asia Pacific Whole-Slide Imaging Market Revenue (Million), by End User 2024 & 2032
- Figure 64: Asia Pacific Whole-Slide Imaging Market Volume (K Unit), by End User 2024 & 2032
- Figure 65: Asia Pacific Whole-Slide Imaging Market Revenue Share (%), by End User 2024 & 2032
- Figure 66: Asia Pacific Whole-Slide Imaging Market Volume Share (%), by End User 2024 & 2032
- Figure 67: Asia Pacific Whole-Slide Imaging Market Revenue (Million), by Country 2024 & 2032
- Figure 68: Asia Pacific Whole-Slide Imaging Market Volume (K Unit), by Country 2024 & 2032
- Figure 69: Asia Pacific Whole-Slide Imaging Market Revenue Share (%), by Country 2024 & 2032
- Figure 70: Asia Pacific Whole-Slide Imaging Market Volume Share (%), by Country 2024 & 2032
- Figure 71: Middle East and Africa Whole-Slide Imaging Market Revenue (Million), by Technology 2024 & 2032
- Figure 72: Middle East and Africa Whole-Slide Imaging Market Volume (K Unit), by Technology 2024 & 2032
- Figure 73: Middle East and Africa Whole-Slide Imaging Market Revenue Share (%), by Technology 2024 & 2032
- Figure 74: Middle East and Africa Whole-Slide Imaging Market Volume Share (%), by Technology 2024 & 2032
- Figure 75: Middle East and Africa Whole-Slide Imaging Market Revenue (Million), by Application 2024 & 2032
- Figure 76: Middle East and Africa Whole-Slide Imaging Market Volume (K Unit), by Application 2024 & 2032
- Figure 77: Middle East and Africa Whole-Slide Imaging Market Revenue Share (%), by Application 2024 & 2032
- Figure 78: Middle East and Africa Whole-Slide Imaging Market Volume Share (%), by Application 2024 & 2032
- Figure 79: Middle East and Africa Whole-Slide Imaging Market Revenue (Million), by End User 2024 & 2032
- Figure 80: Middle East and Africa Whole-Slide Imaging Market Volume (K Unit), by End User 2024 & 2032
- Figure 81: Middle East and Africa Whole-Slide Imaging Market Revenue Share (%), by End User 2024 & 2032
- Figure 82: Middle East and Africa Whole-Slide Imaging Market Volume Share (%), by End User 2024 & 2032
- Figure 83: Middle East and Africa Whole-Slide Imaging Market Revenue (Million), by Country 2024 & 2032
- Figure 84: Middle East and Africa Whole-Slide Imaging Market Volume (K Unit), by Country 2024 & 2032
- Figure 85: Middle East and Africa Whole-Slide Imaging Market Revenue Share (%), by Country 2024 & 2032
- Figure 86: Middle East and Africa Whole-Slide Imaging Market Volume Share (%), by Country 2024 & 2032
- Figure 87: South America Whole-Slide Imaging Market Revenue (Million), by Technology 2024 & 2032
- Figure 88: South America Whole-Slide Imaging Market Volume (K Unit), by Technology 2024 & 2032
- Figure 89: South America Whole-Slide Imaging Market Revenue Share (%), by Technology 2024 & 2032
- Figure 90: South America Whole-Slide Imaging Market Volume Share (%), by Technology 2024 & 2032
- Figure 91: South America Whole-Slide Imaging Market Revenue (Million), by Application 2024 & 2032
- Figure 92: South America Whole-Slide Imaging Market Volume (K Unit), by Application 2024 & 2032
- Figure 93: South America Whole-Slide Imaging Market Revenue Share (%), by Application 2024 & 2032
- Figure 94: South America Whole-Slide Imaging Market Volume Share (%), by Application 2024 & 2032
- Figure 95: South America Whole-Slide Imaging Market Revenue (Million), by End User 2024 & 2032
- Figure 96: South America Whole-Slide Imaging Market Volume (K Unit), by End User 2024 & 2032
- Figure 97: South America Whole-Slide Imaging Market Revenue Share (%), by End User 2024 & 2032
- Figure 98: South America Whole-Slide Imaging Market Volume Share (%), by End User 2024 & 2032
- Figure 99: South America Whole-Slide Imaging Market Revenue (Million), by Country 2024 & 2032
- Figure 100: South America Whole-Slide Imaging Market Volume (K Unit), by Country 2024 & 2032
- Figure 101: South America Whole-Slide Imaging Market Revenue Share (%), by Country 2024 & 2032
- Figure 102: South America Whole-Slide Imaging Market Volume Share (%), by Country 2024 & 2032
List of Tables
- Table 1: Global Whole-Slide Imaging Market Revenue Million Forecast, by Region 2019 & 2032
- Table 2: Global Whole-Slide Imaging Market Volume K Unit Forecast, by Region 2019 & 2032
- Table 3: Global Whole-Slide Imaging Market Revenue Million Forecast, by Technology 2019 & 2032
- Table 4: Global Whole-Slide Imaging Market Volume K Unit Forecast, by Technology 2019 & 2032
- Table 5: Global Whole-Slide Imaging Market Revenue Million Forecast, by Application 2019 & 2032
- Table 6: Global Whole-Slide Imaging Market Volume K Unit Forecast, by Application 2019 & 2032
- Table 7: Global Whole-Slide Imaging Market Revenue Million Forecast, by End User 2019 & 2032
- Table 8: Global Whole-Slide Imaging Market Volume K Unit Forecast, by End User 2019 & 2032
- Table 9: Global Whole-Slide Imaging Market Revenue Million Forecast, by Region 2019 & 2032
- Table 10: Global Whole-Slide Imaging Market Volume K Unit Forecast, by Region 2019 & 2032
- Table 11: Global Whole-Slide Imaging Market Revenue Million Forecast, by Country 2019 & 2032
- Table 12: Global Whole-Slide Imaging Market Volume K Unit Forecast, by Country 2019 & 2032
- Table 13: United States Whole-Slide Imaging Market Revenue (Million) Forecast, by Application 2019 & 2032
- Table 14: United States Whole-Slide Imaging Market Volume (K Unit) Forecast, by Application 2019 & 2032
- Table 15: Canada Whole-Slide Imaging Market Revenue (Million) Forecast, by Application 2019 & 2032
- Table 16: Canada Whole-Slide Imaging Market Volume (K Unit) Forecast, by Application 2019 & 2032
- Table 17: Mexico Whole-Slide Imaging Market Revenue (Million) Forecast, by Application 2019 & 2032
- Table 18: Mexico Whole-Slide Imaging Market Volume (K Unit) Forecast, by Application 2019 & 2032
- Table 19: Global Whole-Slide Imaging Market Revenue Million Forecast, by Country 2019 & 2032
- Table 20: Global Whole-Slide Imaging Market Volume K Unit Forecast, by Country 2019 & 2032
- Table 21: Germany Whole-Slide Imaging Market Revenue (Million) Forecast, by Application 2019 & 2032
- Table 22: Germany Whole-Slide Imaging Market Volume (K Unit) Forecast, by Application 2019 & 2032
- Table 23: United Kingdom Whole-Slide Imaging Market Revenue (Million) Forecast, by Application 2019 & 2032
- Table 24: United Kingdom Whole-Slide Imaging Market Volume (K Unit) Forecast, by Application 2019 & 2032
- Table 25: France Whole-Slide Imaging Market Revenue (Million) Forecast, by Application 2019 & 2032
- Table 26: France Whole-Slide Imaging Market Volume (K Unit) Forecast, by Application 2019 & 2032
- Table 27: Italy Whole-Slide Imaging Market Revenue (Million) Forecast, by Application 2019 & 2032
- Table 28: Italy Whole-Slide Imaging Market Volume (K Unit) Forecast, by Application 2019 & 2032
- Table 29: Spain Whole-Slide Imaging Market Revenue (Million) Forecast, by Application 2019 & 2032
- Table 30: Spain Whole-Slide Imaging Market Volume (K Unit) Forecast, by Application 2019 & 2032
- Table 31: Rest of Europe Whole-Slide Imaging Market Revenue (Million) Forecast, by Application 2019 & 2032
- Table 32: Rest of Europe Whole-Slide Imaging Market Volume (K Unit) Forecast, by Application 2019 & 2032
- Table 33: Global Whole-Slide Imaging Market Revenue Million Forecast, by Country 2019 & 2032
- Table 34: Global Whole-Slide Imaging Market Volume K Unit Forecast, by Country 2019 & 2032
- Table 35: China Whole-Slide Imaging Market Revenue (Million) Forecast, by Application 2019 & 2032
- Table 36: China Whole-Slide Imaging Market Volume (K Unit) Forecast, by Application 2019 & 2032
- Table 37: Japan Whole-Slide Imaging Market Revenue (Million) Forecast, by Application 2019 & 2032
- Table 38: Japan Whole-Slide Imaging Market Volume (K Unit) Forecast, by Application 2019 & 2032
- Table 39: India Whole-Slide Imaging Market Revenue (Million) Forecast, by Application 2019 & 2032
- Table 40: India Whole-Slide Imaging Market Volume (K Unit) Forecast, by Application 2019 & 2032
- Table 41: Australia Whole-Slide Imaging Market Revenue (Million) Forecast, by Application 2019 & 2032
- Table 42: Australia Whole-Slide Imaging Market Volume (K Unit) Forecast, by Application 2019 & 2032
- Table 43: South korea Whole-Slide Imaging Market Revenue (Million) Forecast, by Application 2019 & 2032
- Table 44: South korea Whole-Slide Imaging Market Volume (K Unit) Forecast, by Application 2019 & 2032
- Table 45: Rest of Asia Pacific Whole-Slide Imaging Market Revenue (Million) Forecast, by Application 2019 & 2032
- Table 46: Rest of Asia Pacific Whole-Slide Imaging Market Volume (K Unit) Forecast, by Application 2019 & 2032
- Table 47: Global Whole-Slide Imaging Market Revenue Million Forecast, by Country 2019 & 2032
- Table 48: Global Whole-Slide Imaging Market Volume K Unit Forecast, by Country 2019 & 2032
- Table 49: GCC Whole-Slide Imaging Market Revenue (Million) Forecast, by Application 2019 & 2032
- Table 50: GCC Whole-Slide Imaging Market Volume (K Unit) Forecast, by Application 2019 & 2032
- Table 51: South Africa Whole-Slide Imaging Market Revenue (Million) Forecast, by Application 2019 & 2032
- Table 52: South Africa Whole-Slide Imaging Market Volume (K Unit) Forecast, by Application 2019 & 2032
- Table 53: Rest of Middle East and Africa Whole-Slide Imaging Market Revenue (Million) Forecast, by Application 2019 & 2032
- Table 54: Rest of Middle East and Africa Whole-Slide Imaging Market Volume (K Unit) Forecast, by Application 2019 & 2032
- Table 55: Global Whole-Slide Imaging Market Revenue Million Forecast, by Country 2019 & 2032
- Table 56: Global Whole-Slide Imaging Market Volume K Unit Forecast, by Country 2019 & 2032
- Table 57: Brazil Whole-Slide Imaging Market Revenue (Million) Forecast, by Application 2019 & 2032
- Table 58: Brazil Whole-Slide Imaging Market Volume (K Unit) Forecast, by Application 2019 & 2032
- Table 59: Argentina Whole-Slide Imaging Market Revenue (Million) Forecast, by Application 2019 & 2032
- Table 60: Argentina Whole-Slide Imaging Market Volume (K Unit) Forecast, by Application 2019 & 2032
- Table 61: Rest of South America Whole-Slide Imaging Market Revenue (Million) Forecast, by Application 2019 & 2032
- Table 62: Rest of South America Whole-Slide Imaging Market Volume (K Unit) Forecast, by Application 2019 & 2032
- Table 63: Global Whole-Slide Imaging Market Revenue Million Forecast, by Technology 2019 & 2032
- Table 64: Global Whole-Slide Imaging Market Volume K Unit Forecast, by Technology 2019 & 2032
- Table 65: Global Whole-Slide Imaging Market Revenue Million Forecast, by Application 2019 & 2032
- Table 66: Global Whole-Slide Imaging Market Volume K Unit Forecast, by Application 2019 & 2032
- Table 67: Global Whole-Slide Imaging Market Revenue Million Forecast, by End User 2019 & 2032
- Table 68: Global Whole-Slide Imaging Market Volume K Unit Forecast, by End User 2019 & 2032
- Table 69: Global Whole-Slide Imaging Market Revenue Million Forecast, by Country 2019 & 2032
- Table 70: Global Whole-Slide Imaging Market Volume K Unit Forecast, by Country 2019 & 2032
- Table 71: United States Whole-Slide Imaging Market Revenue (Million) Forecast, by Application 2019 & 2032
- Table 72: United States Whole-Slide Imaging Market Volume (K Unit) Forecast, by Application 2019 & 2032
- Table 73: Canada Whole-Slide Imaging Market Revenue (Million) Forecast, by Application 2019 & 2032
- Table 74: Canada Whole-Slide Imaging Market Volume (K Unit) Forecast, by Application 2019 & 2032
- Table 75: Mexico Whole-Slide Imaging Market Revenue (Million) Forecast, by Application 2019 & 2032
- Table 76: Mexico Whole-Slide Imaging Market Volume (K Unit) Forecast, by Application 2019 & 2032
- Table 77: Global Whole-Slide Imaging Market Revenue Million Forecast, by Technology 2019 & 2032
- Table 78: Global Whole-Slide Imaging Market Volume K Unit Forecast, by Technology 2019 & 2032
- Table 79: Global Whole-Slide Imaging Market Revenue Million Forecast, by Application 2019 & 2032
- Table 80: Global Whole-Slide Imaging Market Volume K Unit Forecast, by Application 2019 & 2032
- Table 81: Global Whole-Slide Imaging Market Revenue Million Forecast, by End User 2019 & 2032
- Table 82: Global Whole-Slide Imaging Market Volume K Unit Forecast, by End User 2019 & 2032
- Table 83: Global Whole-Slide Imaging Market Revenue Million Forecast, by Country 2019 & 2032
- Table 84: Global Whole-Slide Imaging Market Volume K Unit Forecast, by Country 2019 & 2032
- Table 85: Germany Whole-Slide Imaging Market Revenue (Million) Forecast, by Application 2019 & 2032
- Table 86: Germany Whole-Slide Imaging Market Volume (K Unit) Forecast, by Application 2019 & 2032
- Table 87: United Kingdom Whole-Slide Imaging Market Revenue (Million) Forecast, by Application 2019 & 2032
- Table 88: United Kingdom Whole-Slide Imaging Market Volume (K Unit) Forecast, by Application 2019 & 2032
- Table 89: France Whole-Slide Imaging Market Revenue (Million) Forecast, by Application 2019 & 2032
- Table 90: France Whole-Slide Imaging Market Volume (K Unit) Forecast, by Application 2019 & 2032
- Table 91: Italy Whole-Slide Imaging Market Revenue (Million) Forecast, by Application 2019 & 2032
- Table 92: Italy Whole-Slide Imaging Market Volume (K Unit) Forecast, by Application 2019 & 2032
- Table 93: Spain Whole-Slide Imaging Market Revenue (Million) Forecast, by Application 2019 & 2032
- Table 94: Spain Whole-Slide Imaging Market Volume (K Unit) Forecast, by Application 2019 & 2032
- Table 95: Rest of Europe Whole-Slide Imaging Market Revenue (Million) Forecast, by Application 2019 & 2032
- Table 96: Rest of Europe Whole-Slide Imaging Market Volume (K Unit) Forecast, by Application 2019 & 2032
- Table 97: Global Whole-Slide Imaging Market Revenue Million Forecast, by Technology 2019 & 2032
- Table 98: Global Whole-Slide Imaging Market Volume K Unit Forecast, by Technology 2019 & 2032
- Table 99: Global Whole-Slide Imaging Market Revenue Million Forecast, by Application 2019 & 2032
- Table 100: Global Whole-Slide Imaging Market Volume K Unit Forecast, by Application 2019 & 2032
- Table 101: Global Whole-Slide Imaging Market Revenue Million Forecast, by End User 2019 & 2032
- Table 102: Global Whole-Slide Imaging Market Volume K Unit Forecast, by End User 2019 & 2032
- Table 103: Global Whole-Slide Imaging Market Revenue Million Forecast, by Country 2019 & 2032
- Table 104: Global Whole-Slide Imaging Market Volume K Unit Forecast, by Country 2019 & 2032
- Table 105: China Whole-Slide Imaging Market Revenue (Million) Forecast, by Application 2019 & 2032
- Table 106: China Whole-Slide Imaging Market Volume (K Unit) Forecast, by Application 2019 & 2032
- Table 107: Japan Whole-Slide Imaging Market Revenue (Million) Forecast, by Application 2019 & 2032
- Table 108: Japan Whole-Slide Imaging Market Volume (K Unit) Forecast, by Application 2019 & 2032
- Table 109: India Whole-Slide Imaging Market Revenue (Million) Forecast, by Application 2019 & 2032
- Table 110: India Whole-Slide Imaging Market Volume (K Unit) Forecast, by Application 2019 & 2032
- Table 111: Australia Whole-Slide Imaging Market Revenue (Million) Forecast, by Application 2019 & 2032
- Table 112: Australia Whole-Slide Imaging Market Volume (K Unit) Forecast, by Application 2019 & 2032
- Table 113: South korea Whole-Slide Imaging Market Revenue (Million) Forecast, by Application 2019 & 2032
- Table 114: South korea Whole-Slide Imaging Market Volume (K Unit) Forecast, by Application 2019 & 2032
- Table 115: Rest of Asia Pacific Whole-Slide Imaging Market Revenue (Million) Forecast, by Application 2019 & 2032
- Table 116: Rest of Asia Pacific Whole-Slide Imaging Market Volume (K Unit) Forecast, by Application 2019 & 2032
- Table 117: Global Whole-Slide Imaging Market Revenue Million Forecast, by Technology 2019 & 2032
- Table 118: Global Whole-Slide Imaging Market Volume K Unit Forecast, by Technology 2019 & 2032
- Table 119: Global Whole-Slide Imaging Market Revenue Million Forecast, by Application 2019 & 2032
- Table 120: Global Whole-Slide Imaging Market Volume K Unit Forecast, by Application 2019 & 2032
- Table 121: Global Whole-Slide Imaging Market Revenue Million Forecast, by End User 2019 & 2032
- Table 122: Global Whole-Slide Imaging Market Volume K Unit Forecast, by End User 2019 & 2032
- Table 123: Global Whole-Slide Imaging Market Revenue Million Forecast, by Country 2019 & 2032
- Table 124: Global Whole-Slide Imaging Market Volume K Unit Forecast, by Country 2019 & 2032
- Table 125: GCC Whole-Slide Imaging Market Revenue (Million) Forecast, by Application 2019 & 2032
- Table 126: GCC Whole-Slide Imaging Market Volume (K Unit) Forecast, by Application 2019 & 2032
- Table 127: South Africa Whole-Slide Imaging Market Revenue (Million) Forecast, by Application 2019 & 2032
- Table 128: South Africa Whole-Slide Imaging Market Volume (K Unit) Forecast, by Application 2019 & 2032
- Table 129: Rest of Middle East and Africa Whole-Slide Imaging Market Revenue (Million) Forecast, by Application 2019 & 2032
- Table 130: Rest of Middle East and Africa Whole-Slide Imaging Market Volume (K Unit) Forecast, by Application 2019 & 2032
- Table 131: Global Whole-Slide Imaging Market Revenue Million Forecast, by Technology 2019 & 2032
- Table 132: Global Whole-Slide Imaging Market Volume K Unit Forecast, by Technology 2019 & 2032
- Table 133: Global Whole-Slide Imaging Market Revenue Million Forecast, by Application 2019 & 2032
- Table 134: Global Whole-Slide Imaging Market Volume K Unit Forecast, by Application 2019 & 2032
- Table 135: Global Whole-Slide Imaging Market Revenue Million Forecast, by End User 2019 & 2032
- Table 136: Global Whole-Slide Imaging Market Volume K Unit Forecast, by End User 2019 & 2032
- Table 137: Global Whole-Slide Imaging Market Revenue Million Forecast, by Country 2019 & 2032
- Table 138: Global Whole-Slide Imaging Market Volume K Unit Forecast, by Country 2019 & 2032
- Table 139: Brazil Whole-Slide Imaging Market Revenue (Million) Forecast, by Application 2019 & 2032
- Table 140: Brazil Whole-Slide Imaging Market Volume (K Unit) Forecast, by Application 2019 & 2032
- Table 141: Argentina Whole-Slide Imaging Market Revenue (Million) Forecast, by Application 2019 & 2032
- Table 142: Argentina Whole-Slide Imaging Market Volume (K Unit) Forecast, by Application 2019 & 2032
- Table 143: Rest of South America Whole-Slide Imaging Market Revenue (Million) Forecast, by Application 2019 & 2032
- Table 144: Rest of South America Whole-Slide Imaging Market Volume (K Unit) Forecast, by Application 2019 & 2032
Frequently Asked Questions
1. What is the projected Compound Annual Growth Rate (CAGR) of the Whole-Slide Imaging Market?
The projected CAGR is approximately 6.39%.
2. Which companies are prominent players in the Whole-Slide Imaging Market?
Key companies in the market include MBF Bioscience, Hamamatsu Photonics KK, Nikon Corporation, Leica Microsystems GmbH, Koninklijke Philips N V, 3Dhistech, Visiopharm, Indica Labs, Molecular Machines & Industries, Mikroscan Technologies Inc, Olympus Corporation, Akoya Biosciences.
3. What are the main segments of the Whole-Slide Imaging Market?
The market segments include Technology, Application, End User.
4. Can you provide details about the market size?
The market size is estimated to be USD 1.21 Million as of 2022.
5. What are some drivers contributing to market growth?
Growing Popularity of Virtual Slides as Compared to Physical Slides; Technological Advancements in Whole Slide Imaging; Increasing Research in Drug Discovery.
6. What are the notable trends driving market growth?
Telepathology Segment is Expected to Grow Significantly Over the Forecast Period.
7. Are there any restraints impacting market growth?
Stringent Regulatory Approvals; High Cost of Whole Slide Imaging Systems.
8. Can you provide examples of recent developments in the market?
March 2023: Pramana, Inc., an AI-enabled health tech company modernizing the pathology sector, collaborated with PathPresenter to accelerate the enterprise adoption of digital pathology workflows. The goal of this collaboration is to ensure a seamless user experience for the labs adopting Pramana's Digital Pathology as a Service solution for whole slide image generation, as well as PathPresenter's image management/image viewing platform.
9. What pricing options are available for accessing the report?
Pricing options include single-user, multi-user, and enterprise licenses priced at USD 4750, USD 5250, and USD 8750 respectively.
10. Is the market size provided in terms of value or volume?
The market size is provided in terms of value, measured in Million and volume, measured in K Unit.
11. Are there any specific market keywords associated with the report?
Yes, the market keyword associated with the report is "Whole-Slide Imaging Market," which aids in identifying and referencing the specific market segment covered.
12. How do I determine which pricing option suits my needs best?
The pricing options vary based on user requirements and access needs. Individual users may opt for single-user licenses, while businesses requiring broader access may choose multi-user or enterprise licenses for cost-effective access to the report.
13. Are there any additional resources or data provided in the Whole-Slide Imaging Market report?
While the report offers comprehensive insights, it's advisable to review the specific contents or supplementary materials provided to ascertain if additional resources or data are available.
14. How can I stay updated on further developments or reports in the Whole-Slide Imaging Market?
To stay informed about further developments, trends, and reports in the Whole-Slide Imaging Market, consider subscribing to industry newsletters, following relevant companies and organizations, or regularly checking reputable industry news sources and publications.
Methodology
Step 1 - Identification of Relevant Samples Size from Population Database


Step 2 - Approaches for Defining Global Market Size (Value, Volume* & Price*)

Note*: In applicable scenarios
Step 3 - Data Sources
Primary Research
- Web Analytics
- Survey Reports
- Research Institute
- Latest Research Reports
- Opinion Leaders
Secondary Research
- Annual Reports
- White Paper
- Latest Press Release
- Industry Association
- Paid Database
- Investor Presentations

Step 4 - Data Triangulation
Involves using different sources of information in order to increase the validity of a study
These sources are likely to be stakeholders in a program - participants, other researchers, program staff, other community members, and so on.
Then we put all data in single framework & apply various statistical tools to find out the dynamic on the market.
During the analysis stage, feedback from the stakeholder groups would be compared to determine areas of agreement as well as areas of divergence


